0
View Post
Latest PO Joint Replacement Report Adds Outpatient Rehab Rates, Demographics, and More

Latest PO Joint Replacement Report Adds Outpatient Rehab Rates, Demographics, and More

MVC proudly partners with 40 physician organizations (PO) spanning the state of Michigan and continues to refine and add to the resources tailored to these members. As part of this work, MVC recently refreshed and shared PO joint replacement reports in December. These PO-level reports were first shared in October 2021 with a focus on the shift away from inpatient surgeries as well as post-acute care utilization for combined joint procedures.

The recently refreshed reports carried forward many of the joint episode metrics included previously, but with additional stratification and detail. For instance, whereas the 2021 version presented figures for all joint surgeries combined, many of the figures in the December 2022 version provided data stratified by hip procedure, knee procedure, and all joint procedures. Similarly, some figures are stratified by the location of the procedure (inpatient vs. outpatient). This new differentiation was intended to help POs more easily understand the underlying drivers of their metrics. For example, the blinded hospital below (Figure 1) could observe that its average 30-day price-standardized total episode payment is driven more by hip surgeries ($17,399) than knee surgeries ($16,643). This site could also observe that its overall total episode payment is below both the collaborative-wide PO average and the average in their region, and at the average for other POs of a similar size.

Figure 1.

Additional detail was also added to the patient attribution table, which now identifies the top 10 index facilities (rather than five) where a PO’s attributed patients underwent joint replacement surgery. This table now also includes each index facility’s percent of joint episodes performed in an outpatient setting as well as their average 30-day price-standardized total episode payment for attributed patients. This change was intended to inform quality improvement discussions between POs and partner hospitals or Ambulatory Surgical Centers (ASCs).

Also new to this report were 30-day outpatient rehabilitation rates and a patient population snapshot table to help POs better understand the demographics of patients included in the report. The table included mean age, top two patient Zip codes, the percent of patients living in an “at-risk” or “distressed” Zip code according to the Distressed Communities Index, the proportion of patients belonging to different racial categories, their average length of stay, and their 30-day post-surgery complication rate. Each of these categories was summarized separately by insurance plan.

This report utilized administrative claims from attributed members spanning 1/1/19 – 6/30/21 for Blue Cross Blue Shield of Michigan (BCBSM) PPO Commercial, BCBSM Medicare Advantage, and Medicare Fee-for-Service. Reports were prepared for all POs that participate in MVC and had at least 20 joint replacement episodes in 2019 and 2020, and at least 11 episodes in the first half of 2021.

In general, report findings indicated that utilization of outpatient surgery settings continued to increase in 2021 on average (Figure 2). However, there was still significant variation between MVC’s 40 PO members in their average rate of joint replacement surgeries taking place in outpatient settings (Figure 3). For joint episodes in 2019 through the first half of 2021, outpatient surgery rates ranged from just over 20% to nearly 80%.

Figure 2.

Figure 3.

On average across the collaborative, POs still had low rates of skilled nursing facility (SNF) utilization (6.7%) and higher rates of home health (HH) utilization (55.3%). However, variation in PO member HH utilization rates ranged from approximately 10% to 90%.

If you have feedback on your new PO joint replacement report or would like to request an additional custom analysis to better fit your needs, contact the Coordinating Center at Michigan-Value-Collaborative@med.umich.edu.

0

MVC Coordinating Center Looking Back at 2022 and Forward to 2023

On behalf of the MVC Coordinating Center, I’d like to start by wishing you all a very happy and healthy new year! MVC had a stellar 2022 with a wide range of successful activities, all while continuing to support hospitals, physician organizations, and CQI partners.

Over the course of 2022, MVC welcomed three new members to the collaborative, distributed 21 push reports, grew its analytic offerings by adding pharmacy administrative claims as well as race and equity-related data sets, delivered 23 custom analytic requests, hosted 33 virtual workgroups across six focus areas, advanced both of its value coalition campaigns, and returned to in-person events for the first time since 2019. Additionally, a number of exciting improvements were made to the MVC registry: the creation of three new conditions (endocarditis, small bowel obstruction, and nephrectomy), new filters for patients with a diagnosis of chronic kidney disease or venous thromboembolism, and new comparison groups allowing member hospitals to compare their data to other general acute care hospitals or Critical Access Hospitals.

Additionally, a key MVC accomplishment in 2022 was achieving accreditation as a Qualified Entity (QE) through the Qualified Entity Certification Program (QECP), also known as the Medicare Data Sharing for Performance Measurement Program. As a QE, MVC was able to launch 20 new QE reports on the MVC registry, which give authorized users the ability to drill down into patient-level Medicare data, and recently released its first Qualified Entity Public Report following the completion of MVC’s QECP phase three application.

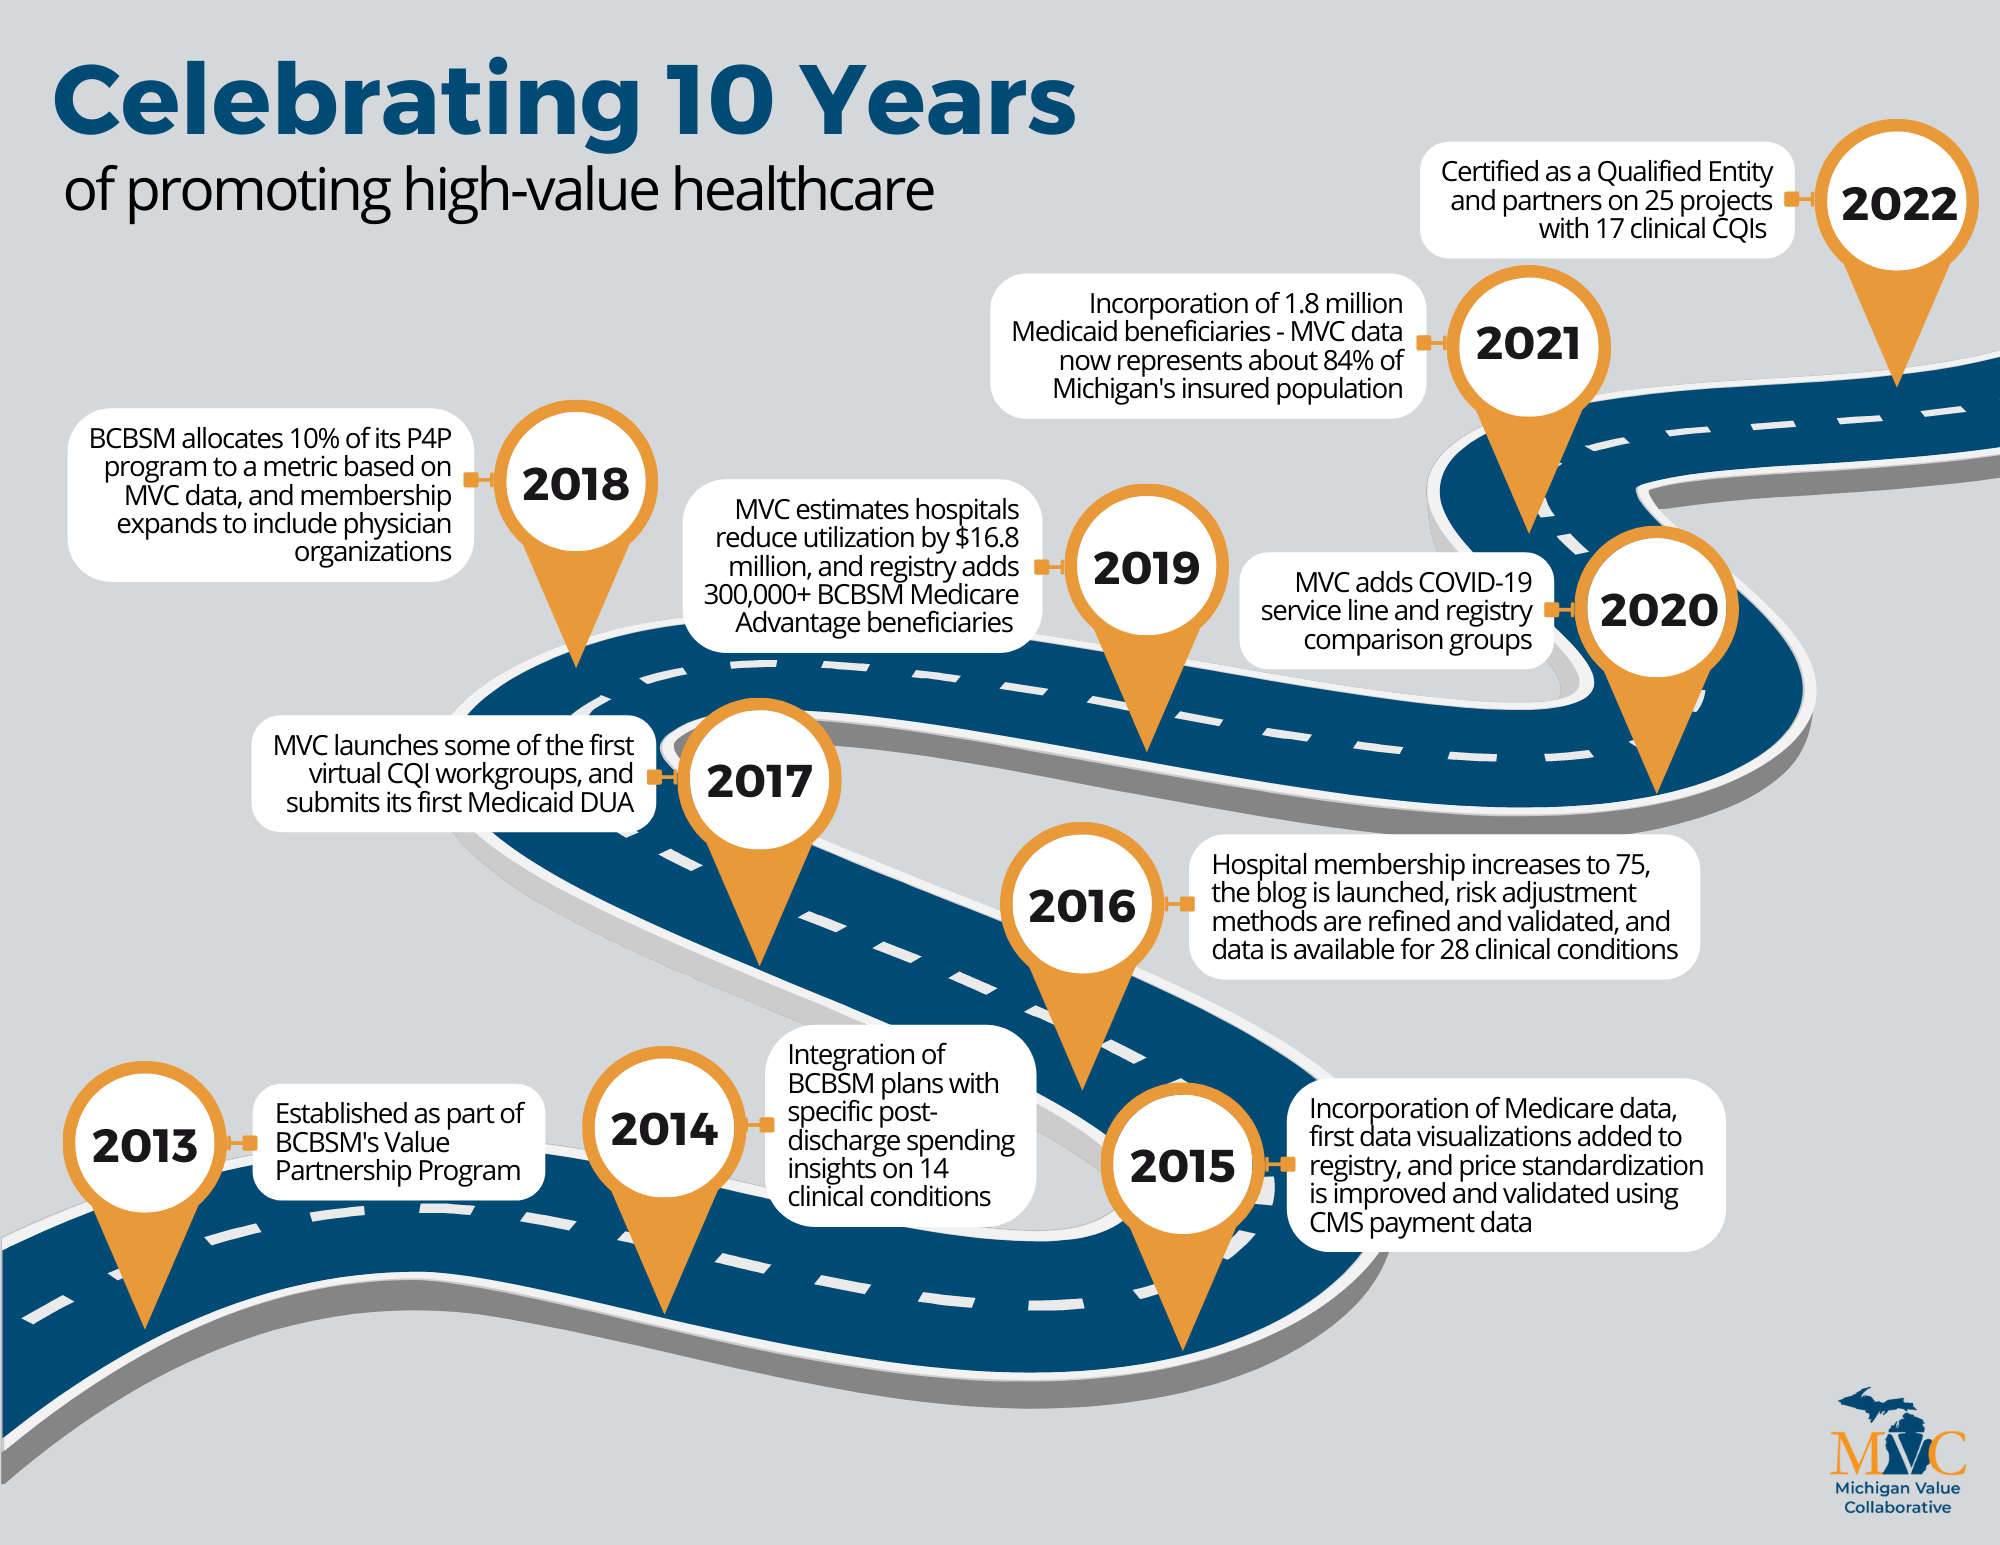
The Coordinating Center is excited for what’s to come in the new year, with MVC celebrating 10 tremendous years advancing its vision of more sustainable, high-value healthcare in Michigan. MVC looks forward to continuing this work and growth into 2023. There are a number of plans for the coming year that I am excited to share with you.

New Push Reports

A number of new reports will be added to MVC’s suite of reporting in 2023, focusing on topics such as transitions of care, health equity, and the revised Program Year (PY) 2024-2025 metrics of the MVC Component of the BCBSM Pay-for-Performance (P4P) Program. The Coordinating Center will work closely with members, the wider CQI community, and other stakeholders to ensure the continued distribution of novel and valuable reporting.

New and Returning MVC Workgroups

The Coordinating Center’s suite of peer-to-peer virtual workgroups will continue to provide a highly accessible online platform for hospital and PO leaders to come together, collaborate, and share practices. MVC will continue offering regular sessions focused on chronic disease management, diabetes, health equity, and health in action. In addition, MVC is looking to host collaborative learning communities for the PY 2024-2025 P4P value metric cohorts, such as the sites that selected cardiac rehabilitation.

Collaborative-Wide Meetings & Reimagined Engagement Events

The MVC team will continue to hold two flagship semi-annual collaborative-wide meetings. These will take place on Friday, May 19 at the VistaTech Center in Livonia and on Friday, Oct. 20 at the Radisson Hotel in Lansing. The MVC team also plans to test new approaches for peer networking to better support practice sharing, such as bringing together sites with similar patient populations and partnering with members to develop impact stories about their quality improvement efforts. Stay tuned for additional details.

Return-on-Investment Analyses

The MVC Coordinating Center made an active effort in 2022 to help its partners measure the impact of their initiatives from an investment and value perspective. MVC’s expertise in this area and its strong relationships throughout the CQI portfolio led to the commission and completion of four ROI exercises last year with additional ROIs in progress in 2023. Similarly, MVC continues to offer its members the ability to request custom analyses using metrics, payers, and date ranges that they specify in order to better understand areas of opportunity. If you are interested in learning more, please submit a Custom Analytics Request and a member of the MVC team will follow up.

As we kick off 2023, I’d like to thank our hospital members, PO members, and CQI partners for their continued collaboration and support. We look forward to working with you throughout the coming year!

0
View Post
MVC Q4 Newsletter Highlights EOY Success Stories

MVC Q4 Newsletter Highlights EOY Success Stories

The Michigan Value Collaborative's quarterly newsletter provides in-depth synopses of MVC events, updates, and spotlights on members and partners. The final newsletter of 2022 was released this week (Figure 1), summarizing the activities and accomplishments that took place in Q4 of this year. First and foremost, the Coordinating Center thanked its members for their partnership in what turned out to be a very active year and highlighted new additions to the collaborative, including new hospital member Bronson Lakeview Paw Paw and new MVC Site Engagement Coordinator Kristy Degener.

Figure 1. Page 1 of MVC December Newsletter for Q4 of 2022

This edition included a full synopsis of MVC's 2022 Fall Semi-Annual Meeting, outlining the unblinded data session and the topics covered by the many talented and inspiring guest speakers. It also called attention to important updates that will impact Program Years 2024-2025 of the MVC Component of the BCBSM Pay-for-Performance (P4P) Program, outlining some aspects of the program structure that are changing and some that are staying the same as previous program cycles. Finally, the December newsletter highlighted the large portfolio of work that was taken on by MVC staff in partnership with its peer Collaborative Quality Initiatives (CQIs), highlighting in particular four completed return-on-investment analyses and several spotlights on the MVC blog.

The publication of MVC's final newsletter in Q4 coincides with MVC's submission of its end-of-year progress report to funder BCBSM. In developing this impressive summary document, MVC developed an infographic that highlights key statistics and accomplishments from the past six months (Figure 2). MVC plans to distribute a public version of this summary report, MVC's Annual Report, in January 2023. In the meantime, read the full MVC Q4 December Newsletter here.

Figure 2. Summary Infographic of MVC Activity, 7/1/22-12/31/22

The MVC Coordinating Center looks forward to continuing its work in 2023 and wishes everyone a happy holiday season and new year!

0
View Post
MVC Team Welcomes a New Site Engagement Coordinator

MVC Team Welcomes a New Site Engagement Coordinator

I am excited to join the Michigan Value Collaborative (MVC) in the role of Site Engagement Coordinator. Through my experiences, I have developed a passion for quality improvement in the delivery of healthcare. I have engaged in the collaborative nature needed to improve health outcomes firsthand, and I am excited to foster this environment as a Site Engagement Coordinator with MVC.

Having lived in New York my entire life, I enjoyed exploring what Michigan has to offer in my first few months here. I love being outdoors and finding new hobbies for all seasons of the year. I enjoy participating in triathlons during the summer months and skiing in the winter. I love spending time with family and friends, and my dog, Sable.

I received my undergraduate degree from the State University of New York at Geneseo, where I majored in biology and minored in Spanish. After completing my bachelor’s degree, I earned my Master of Public Health (MPH) from the State University of New York at Albany with a concentration in social behavior and community health.

While completing my MPH, I had the opportunity to work as a Graduate Student Assistant at the New York State Department of Health within the Division of Family Health and the Office of Quality and Patient Safety. Within the Division of Family Health, I provided programmatic assistance to the intervention projects of the New York State Perinatal Quality Collaborative, an initiative that aims to provide the best, safest, and most equitable care to birthing people and infants across New York State.

Within the Office of Quality and Patient Safety, as a part of an evidence-based intervention to increase colorectal cancer screening rates in the Medicaid Managed Care (MMC) population, I worked directly with MMC enrollees to provide them with necessary screening information and connections to appropriate screening resources.

In my most recent role, I served as a Community Support Specialist Team Supervisor for the New York State COVID-19 Contact Tracing Initiative. This position allowed me to be at the forefront of New York State’s efforts to control the spread of COVID-19 and support those who were in isolation and quarantine due to the pandemic.

As Site Engagement Coordinator, I look forward to developing and strengthening partnerships between MVC members and working together to improve the health of Michigan through sustainable, high-value healthcare. If you have any questions, please contact me at kdegener@med.umich.edu.

0
View Post
New MI Mind CQI Connects Body and Mind to Health in Michigan

New MI Mind CQI Connects Body and Mind to Health in Michigan

Suicide is a leading cause of death in the United States. It claimed nearly 46,000 lives in 2020—a rate 30% higher than two decades ago. More recent data has even shown an increase in the rate of suicide after two years of declining rates. In the state of Michigan, the suicide mortality rate was 14 per 100,000 people.

There are significant opportunities for suicide prevention in primary care and other healthcare settings. Research suggests that patients seek care from primary care physicians within 30 days of establishing a suicide plan or attempting suicide. Furthermore, for every suicide death, there are four hospitalizations and eight emergency department visits (Figure 1).

Figure 1.

In response to this significant health need in Michigan, Blue Cross Blue Shield of Michigan partnered with Henry Ford Health to launch a new Collaborative Quality Initiative (CQI) called the Michigan Mental Innovation Network and Program Design (MI Mind). The MI Mind Coordinating Center team brings providers, health systems, and suicide prevention experts together to reach shared goals of improving suicide prevention, care, and access to key behavioral health services in Michigan. Its mission is to engage psychiatrists, psychologists, and primary care physicians in the use of care pathways to reduce suicides in Michigan significantly.

The core program is a collaboration with provider organizations that aims to determine and implement system-specific suicide prevention elements and use data to implement rapid cycle quality improvement processes. MI Mind hopes to assess what levels and characterizations of risk are most urgent and can be addressed by clinicians to inform recommendations for suicide prevention and quality improvement. The MI Mind program will help facilitate enhanced collaboration and referrals among behavioral health and primary care clinicians and promote purposeful screening for suicidal risk. The MI Mind team aims to train clinical staff using the well-established Zero Suicide protocol and anticipates the program will improve patient support, enable more effective and efficient healthcare, and reduce suicide rates.

The MI Mind collaborative is co-led by Program Director Brian Ahmedani, PhD, LCSW, who is internationally recognized for his work in suicide prevention and the Director for the Center for Health Policy and Health Services Research at Henry Ford Health; and Program Director Cathrine Frank, MD, a practicing and board certified psychiatrist widely regarded as the original clinical architect of the Zero Suicide program and Chair of the Department of Psychiatry and Behavioral Health Services at Henry Ford Health.

For more information on MI Mind, visit their website, where a variety of easy-to-use, organized tools and materials or available for the benefit of primary care providers, behavioral health professionals, patients, and their loved ones. Providers may also contact the MI Mind Coordinating Center at MiMIND@hfhs.org. In addition, the 988 Suicide and Crisis Lifeline (previously the Suicide Prevention Lifeline) is available to provide equitable and accessible suicide prevention support across the United States.

As the Michigan Value Collaborative (MVC) continues to build its offerings for members, the Coordinating Center is mindful that many other CQIs also partner with hospitals and providers throughout Michigan. MVC posts recurring feature blogs about some of its peer CQIs to showcase their activities and highlight collaborations with MVC. Please reach out to the MVC Coordinating Center with any suggestions or questions.

0
View Post
Understanding MVC Episode Creation and the Meaning of Data

Understanding MVC Episode Creation and the Meaning of Data

The Michigan Value Collaborative (MVC) houses a wealth of administrative claims data for Blue Cross Blue Shield of Michigan, Blue Care Network, and Medicare Fee-For-Service beneficiaries in Michigan. These data provide valuable insights about health services utilization, patient outcomes, and the value of care received at facilities across Michigan. To gain meaningful insight from large sets of unprocessed claims data, MVC transforms these claims into 30- and 90-day episodes of care for over 40 different medical conditions and surgical procedures. These episodes are the core of MVC analytics and result in the data available to MVC members through the online data registry and push reports. In order to best understand the meaning of MVC analytic outputs, it’s important to know what an MVC episode actually includes and how it is created.

One of the ways that MVC provides insights into episodes of care is with data on payments for professional and facility healthcare services. A foundational aspect of MVC data is that payments are price standardized and risk adjusted. In other words, the payments that MVC shares in its reports and on the registry are not representative of actual dollars; they represent utilization of healthcare services that account for patient, provider, and payer differences for fairer comparisons between members and over time. Price standardization removes variation due to various factors that impact insurer payments, such as the payer, contractual agreements, geographic location, and time (see example scenario in Figure 1).

Figure 1.

On the other hand, risk adjustment accounts for differences between patients, because some patients have more healthcare needs than others and may experience a worse outcome or require greater amounts of care than another patient. Risk adjustment helps with fair comparisons between hospitals that see more complex patients compared to those with fewer complex patients. MVC’s risk adjustment always accounts for patient age, gender, payer, history of high healthcare expenditures, and comorbidities such as end-stage renal disease. It also sometimes accounts for condition-specific factors. Together, price standardization and risk adjustment allow for patients and hospitals to be compared more accurately and fairly in MVC reporting.

How are MVC episodes created?

Episodes are initiated by one of three types of index events: inpatient admission to a hospital, an emergency department visit resulting in an inpatient admission to a hospital, or an outpatient procedure at a hospital. To become an MVC episode, these initiating events must have corresponding billed and paid insurance claims that fit into the episode definition of an MVC condition. These definitions are typically comprised of inclusion and exclusion codes for ICD-9-CM and ICD-10-CM diagnosis codes, ICD-9-PCS and ICD-10-PCS codes, and/or CPT codes. Generally speaking, episodes of medical conditions have an initiating facility or professional inpatient claim with a qualifying diagnosis code in the primary diagnosis code position. For example, a patient admitted to an inpatient hospital with a primary diagnosis code of R65.20 (severe sepsis without septic shock) may have a sepsis episode in MVC data. The criteria for initiating surgical episodes are more varied and depend on the procedure. For more details about condition-specific episode definitions and rules, please refer to the MVC Episode Definitions document available on the resources page of the MVC registry.

Once an episode is initiated, the claims that follow are attached to that episode and categorized into payment components (Figure 2). The span of the initiation of an episode through initial discharge is called the index event, for which MVC aggregates facility claims and associated price-standardized facility payments for the base payment as well as outlier and transfer payments, if applicable. The claim categories after index discharge make up the bulk of an episode. This post-discharge aspect of MVC episodes allows hospitals to follow their patients after they leave the hospital's four walls. For the 30 or 90 days after discharge, facility claims for that patient’s episode are price-standardized and categorized into post-acute care and inpatient readmission components. Post-acute care is further sub-categorized into the following categories: emergency department (ED), home health care (HH), skilled nursing facility (SNF), rehab (inpatient and outpatient), and outpatient facility-based services. For greater detail about MVC episode creation, see the MVC Data Guide on the resources page of the MVC website.

Figure 2.

While facility claims and their respective price-standardized payments are grouped into various categories, the price-standardized professional payment spans the entirety of the episode. Since claims for facility and professional-based services are billed separately, they can be brought together by service dates for a more comprehensive summary of care. The resources page on the MVC website contains a more detailed breakdown of episode payment components.

How are episodes used?

Once episodes are created, the MVC Coordinating Center analyzes these data to answer a variety of questions about health services utilization. For example, what proportion of a hospital’s joint replacement patients are going to a SNF after their procedure? How does that compare to the statewide average? How long is the average length of stay for a hospital’s sepsis patients? What proportion of sepsis patients are admitted to the ICU/CCU during their hospitalization? There are many questions surrounding utilization and outcomes that MVC utilizes its data to help answer. MVC episodes can help inform a wide variety of quality improvement initiatives for numerous conditions.

In addition to some of the measures mentioned above, MVC frequently includes comparison groups in reporting as a point of reference, which allows hospital and physician organization (PO) members to compare their performance, utilization, or outcomes with the collaborative average, regional average, or other individual hospitals or POs. MVC comparison groups are sometimes further tailored by size or type, such as by critical access hospital status or by PO size. See Figure 3 for a sample caterpillar plot from a recent chronic obstructive pulmonary disease (COPD) report for POs.

Figure 3.

While claims-based analytics can provide insights into health services utilization, it doesn’t always reveal the full picture. MVC encourages members to use its push reports and custom reports in conjunction with electronic medical record data and as conversation starters with staff and clinicians working on particular conditions or service lines. Additionally, many MVC conditions align with other collaborative quality initiatives (CQIs). As the MVC team collaborates with other CQIs to combine clinical and claims data, MVC encourages cross-collaboration of site champions to foster partnerships and information sharing.

The MVC Coordinating Center is always open to comments and suggestions to help improve its portfolio of analytic offerings. If you or your team has any feedback on existing reports, suggestions for new reports, or interest in new MVC conditions, please contact the Coordinating Center at Michigan-Value-Collaborative@med.umich.edu.

0
View Post
PY 2024-2025 Selection Reports Sent for MVC Component of BCBSM P4P Program

PY 2024-2025 Selection Reports Sent for MVC Component of BCBSM P4P Program

Beginning in 2018, Blue Cross Blue Shield of Michigan (BCBSM) allocated 10% of its Pay-For-Performance (P4P) Program to a metric based on Michigan Value Collaborative (MVC) claims data. In 2022, the BCBSM P4P Quarterly Workgroup approved changes to how hospitals are evaluated in future program cycles. The upcoming two-year cycle including Program Years (PYs) 2024 and 2025 will be the first impacted by these changes, with performance years in 2023 and 2024, respectively (see Figure 1). Hospitals received selection reports for the next cycle this week to aid in their decision-making on metrics within the new program structure.

Figure 1.

What is staying the same?

The program will continue to be scored out of 10 points maximum, and hospitals will continue to be evaluated on their risk-adjusted, price-standardized total episode payment, though this will make up a smaller component of the overall program. In addition, most conditions hospitals could select previously for episode payment scoring will still be available for that component of the program. Those include chronic obstructive pulmonary disease (COPD), colectomy (non-cancer), congestive heart failure (CHF), coronary artery bypass grafting (CABG), joint replacement, and pneumonia. Additionally, a hospital’s metric selections will continue to be scored on improvement compared to the hospital’s own past performance and scored on achievement related to an MVC cohort. Each hospital will continue to be awarded the greater of the two scores, either improvement or achievement, which are calculated using Z-scores. Cohort designation is still based on bed size, critical access status, and case mix index.

What is changing?

The PY 2022-2023 program was scored out of 10 points, but 12 points could be earned (10 points from episode spending plus two bonus points). In PYs 2024-2025, the overall program structure (Figure 2) will change so that the maximum score will be 10 points, made up of a maximum of four points from an episode spending metric, a maximum of four points from a value metric (a new component), and a maximum of two points from engagement activities completed in the program year (the calendar year following the performance year). This means that rather than selecting two conditions as in previous program cycles, hospitals will now select one condition for the episode spending metric and select one value metric. In order to be eligible to select a payment condition or value metric, a hospital must be projected to have at least 20 cases in the full baseline year of 2021. No bonus points will be available for PYs 2024-2025.

Figure 2.

Brand new in PYs 2024-2025 will be value metrics, which are evidence-based, actionable measures that show variability across the state. Hospitals will be rewarded for high rates of high-value services or low rates of low-value services. Seven value metrics are available for hospitals to choose from: cardiac rehabilitation after CABG, cardiac rehabilitation after percutaneous coronary intervention (PCI), seven-day follow-up after CHF, 14-day follow-up after COPD, seven-day follow-up after pneumonia, preoperative testing, and risk-adjusted readmission after sepsis. The preoperative testing value metric is composed of a group of three low-risk procedures: cholecystectomy, hernia repair, and lumpectomy. Each procedure will be scored separately, and points for this value metric will be awarded based on the highest points achieved for a hospital’s eligible procedures.

Finally, engagement in MVC activities will be built into the program’s scoring structure, rather than being offered as “bonus” points. Hospitals will be eligible to earn up to two points by attending and participating in MVC activities throughout each program year. These points are intended to increase engagement with other hospitals and the MVC Coordinating Center. Hospitals may select their own combination of activities but must include at least one activity from each of the attendance and participation categories to earn any points.

The P4P selection reports distributed this week include tables for the various episode spending and value metrics that identify projected case counts, the hospital’s average payment or rate of utilization, the cohort and MVC All average payments or rates, and the projected changes necessary for the hospital to earn 1 – 4 points. Accompanying the reports was an interpretation guide to walk recipients through a blinded sample report. It includes guidance on how to interpret the tables with suggestions for how this data could be used to inform a hospital’s P4P selections. The guide can be viewed here.

A complete summary of changes to PYs 2024 and 2025 is available here. These changes will not be retroactively applied to PYs 2022-2023. For complete details about PYs 2024-2025, please refer to the P4P Technical Document. Contact the MVC Coordinating Center with any questions. MVC requests that member hospitals complete and submit their PY 2024-2025 selections by December 23, 2022.

0
View Post
Happy Thanksgiving from the MVC Coordinating Center

Happy Thanksgiving from the MVC Coordinating Center

The Michigan Value Collaborative wishes you a happy Thanksgiving holiday. Thank you to all Michigan hospitals and physician organizations for working tirelessly every day to improve healthcare quality across Michigan. We are grateful for your partnership and your efforts on behalf of Michigan patients.

0
View Post
Latest Sepsis Report Compares Medicare Advantage and Medicare FFS Patient Outcomes

Latest Sepsis Report Compares Medicare Advantage and Medicare FFS Patient Outcomes

The Michigan Value Collaborative distributed refreshed push reports this week for its sepsis service line, providing hospital members with updated figures and measures since the last refresh in April.

The version shared with members this week compares MVC hospitals on 90-day risk-adjusted total episode payments, inpatient length of stay, Intensive Care Unit (ICU)/Cardiac Care Unit (CCU) utilization, inpatient mortality and discharge to hospice, 90-day post-acute care utilization, and 90-day readmission rates. Each figure presented reflects 90-day episodes with index admissions from 7/1/18 – 6/30/21 for Medicare Fee-For-Service (FFS), Blue Cross Blue Shield of Michigan (BCBSM) PPO Commercial, Blue Care Network (BCN) Commercial, BCBSM PPO Medicare Advantage (MA), and BCN MA. Most of the measures also include comparison groups for the "MVC All” average across the collaborative as well as the average for each hospital’s assigned geographic region of Michigan.

This week’s reports stratified many measures by BCBSM/BCN Medicare Advantage and traditional Medicare FFS to investigate differences in outcomes and utilization between these two patient groups. MA saw large increases in yearly enrollment over the last decade, resulting in a growing interest in the difference in quality and cost measures compared to traditional Medicare FFS. Recent research suggested that MA patients experience better outcomes and cost less. This held true for some of the measures in MVC’s latest report. Despite the fact that the MA population is older (77 years) than the Medicare FFS population (72 years), the 90-day readmission rate (see Figure 1) among Medicare FFS sepsis patients was higher (33%) than that of MA sepsis patients (27%).

Figure 1.

Other noticeable differences between the patient populations included disease burden and social barriers. The Medicare FFS population had a greater comorbidity burden than the MA population; 57% of MA patients had three or more comorbidities whereas 61% of the Medicare FFS population had three or more comorbidities. The Medicare FFS population was also more likely to reside in an at-risk or distressed Zip code according to the Distressed Communities Index (37% vs. 31%).

Interestingly, the average 90-day risk-adjusted total episode spending payment among sepsis patients was higher for MA ($38,314) than Medicare FFS ($34,434) (see Figure 2). However, the claims data used in MVC’s report were both price standardized and risk adjusted, so dollars are actually a proxy for healthcare utilization. When taking into account patient factors and payer, BCBSM/BCN MA sepsis patients used more resources than Medicare FFS sepsis patients. Without taking patient factors and payer into account, Medicare FFS sepsis patients used more resources than BCBSM/BCN MA sepsis patients.

Figure 2.

Hospitals can learn more about the differing demographics of these two populations and their BCBSM/BCN commercial counterparts in their patient population snapshot table, a figure that was carried forward from the April reports. The latest reports included additional rows for the rate of septic shock and for the percentage of patients living in an “at-risk” or “distressed” Zip code. The latter is determined by the Economic Innovation Group’s Distressed Communities Index (DCI) data set, which incorporates economic indicators such as education, employment, and income to categorize patient Zip codes as prosperous, comfortable, mid-tier, at-risk, or distressed. The population snapshot table was intended to help hospitals better understand their sepsis patient population. The other demographics included were race, mean age, top three patient Zip codes, the most frequent and average number of comorbidities, and the proportion of patients with a confirmed diagnosis of COVID-19.

The inclusion of COVID-positive patient percentages is an important statistic in the patient population snapshot table since the report included COVID patients. Knowing this percentage could help hospitals understand the extent to which their data is driven (or not) by patients with a confirmed COVID-19 diagnosis.

The latest sepsis reports were also distributed to members of the Michigan Hospital Medicine Safety Consortium (HMS), which partnered with MVC on the original development of this service line for MVC’s registry. MVC plans to provide system-level versions of the latest sepsis report in the coming weeks.

If you have suggestions on how these reports can be improved or the data made more actionable, the Coordinating Center would love to hear from you. We are also seeking feedback on how collaborative members are using this information in their quality improvement projects. Please reach out at Michigan-Value-Collaborative@med.umich.edu.

0
View Post
Distressed Community Index Data Supplements MVC Equity Work

Distressed Community Index Data Supplements MVC Equity Work

Emphasizing health equity in Michigan is a key strategic initiative for the Michigan Value Collaborative. MVC kicked off this strategic initiative at its October 2021 semi-annual meeting with the theme of “The Social Risk and Health Equity Dilemma.” Since then, MVC has expanded its access to data sets related to health equity, developed hospital health equity reports, and regularly convened stakeholders from around the state via a health equity workgroup series that launched in January 2022. MVC is eager to find new and exciting ways to utilize data and collaborate with members on health equity topics in Michigan.

One of the more recent enhancements to MVC’s capacity was the addition of more granular data on social determinants of health. MVC secured access to Distressed Community Index (DCI) data, a tool for measuring the comparative economic well-being of US communities. DCI data was first integrated into MVC reporting in August with the distribution of a new push report on emergency department and post-acute care use. It was also incorporated in MVC’s newest physician organization report on chronic obstructive pulmonary disease, which was distributed to PO members last month.

The DCI data are developed by the Economic Innovation Group and derived from the US Census Bureau’s Business Patterns and American Community Survey Five-Year Estimates (2016-2020). The DCI is a composite measure of ZIP-code level socioeconomic distress comprised of seven key indicators, including education, housing, unemployment, poverty, income, employment changes, and business (see Figure 1).

Figure 1.

The resulting DCI composite measure assigns individual five-digit ZIP codes a number from 0 to 100 with 0 representing the least distressed communities and 100 representing the most distressed communities. The DCI is then grouped into five ordered categories for ease of comparison: distressed, at risk, mid-tier, comfortable, and prosperous. The data include details on 874 ZIP codes in Michigan that have at least 500 residents, of which 192 (22%) are prosperous communities and 120 (14%) are distressed communities. The map below (see Figure 2) highlights the distribution of community-level distress categories across the state of Michigan, with the blue areas representing more prosperous communities and the red areas representing more distressed communities.

Figure 2.

The data also reveal staggering racial/ethnic disparities in Michigan. As seen in Figure 3 below, Black/African American Michiganders are far more likely to live in distressed communities relative to non-Hispanic whites. This information is further evidence of the need for broad efforts to reduce disparities according to race/ethnicity and local community distress.

Figure 3.

Incorporating the DCI into MVC data analytics will offer new opportunities to better understand health equity challenges in Michigan. The MVC Coordinating Center looks forward to using these data in collaboration with its members and is eager to discuss how best to leverage such data sets to identify inequity in Michigan healthcare. Please contact MVC to learn more or request custom analytics.