In February, MVC hosted two virtual workgroup presentations – the first focused on hybrid cardiac rehab program delivery and the second a health in action session focused on patient journey mapping. The MVC Coordinating Center hosts workgroup presentations twice per month with topics rotating between post-discharge follow-up, sepsis, cardiac rehabilitation, rural health, preoperative testing, and heath in action (ad hoc focused topics). Each month, the MVC Coordinating Center publishes key highlights from the past month’s presentations to support practice sharing across the state.
February Cardiac Rehab Workgroup: Henry Ford Health
MVC’s first cardiac rehab workgroup of 2025 featured a presentation by Dr. Steven Keteyian, PhD, Director of Cardiac Rehabilitation/Preventive Cardiology at Henry Ford Health System. The presentation focused on the development and implementation of a non-traditional hybrid model of care delivery.
During the COVID-19 pandemic many healthcare facilities had to transition to virtual platforms to continue providing essential medical care to patients. Henry Ford Health’s cardiac rehabilitation programs, like many other services, pivoted to meet the needs of patients by establishing an evidence-based hybrid delivery model.
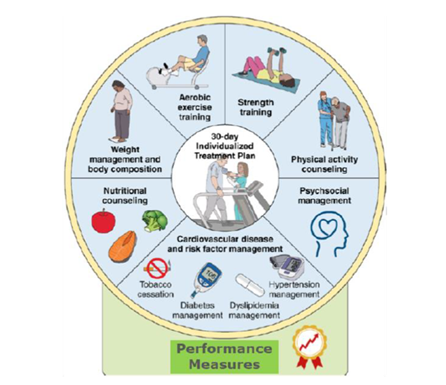
Dr. Keteyian emphasized that cardiac rehabilitation is more than just physical exercise. It is a comprehensive health improvement plan containing several core components (Figure 1) such as nutritional counseling, psychosocial management, weight management and body composition, tobacco cessation counseling, and more. All of these components are combined to establish an individualized treatment plan for the patient.
Figure 1. AACVPR/AHA Cardiac Rehab Performance Measures

Dr. Keteyian explained that their patients begin their program in-person to establish baseline assessments and a treatment plan. Once established, cardiac rehab patients have the option to participate virtually for remaining sessions or return on-site depending on their preferences and the need to assess them in-person. Dr. Keteyian noted several factors that drive the use of hybrid cardiac rehab such as patient needs (returning to work, family care responsibilities, travel distance/transportation limitations), limited resources within the health system for a fully on-site program, and limited patient availability during the on-site hours of operation.
To be eligible for participation in cardiac rehabilitation, patients need to have a qualifying event such as acute coronary syndrome (ACS), heart valve repair/replacement (TAVR), cardiac transplant, or stable heart failure (with less than 35% ejection fraction). Henry Ford uses MVC data to track the percent of eligible patients enrolled in cardiac rehab within 90 days, and compares rates across different qualifying events (e.g., AMI, CHF, TAVR, etc.) to see where cardiac rehab is being underutilized compared to averages for the state and Centers for Medicare & Medicaid Services (CMS). The Henry Ford team began incorporating virtual cardiac rehab delivery as a strategy to increase enrollment and attendance among eligible patients.
Dr. Keteyian also discussed some common questions and concerns he hears when discussing hybrid program delivery, such as needed equipment, patient safety, and program efficacy. He shared information from the iAttend randomized control trial that Henry Ford Health participated in from 2019 – 2024, which tracked cardiac patient demographic data, eligibility, participation, and outcomes for hybrid and facility-based cardiac rehab programming (Keteyian, 2024). Data showed that none of the hybrid participants were required to go on-site due to clinical concerns, no virtual visits required physician intervention, and there were no mechanical falls requiring medical attention indicated in either group. A second randomized trial, HF-ACTION, tracked 2,331 heart failure (HFrEF) patients and found that hospitalizations during or within 3 hours after exercise occurred for 2% of the hybrid participants versus 3% for on-site patients. The mortality rate for patients in both study groups was very low (approximately 0.4%) indicating safety was not an issue. Though the data did show hybrid patients not progressing as quickly through the program as on-site patients, this lag became a teaching moment for cardiac rehab staff and an opportunity for improvement.
Attendance for both programs was comparable, and patient outcomes were statistically similar with patients showing improvement in desired performance measures such as peak oxygen uptake, exercise duration, and walking distance (Keteyian, 2024). Staff burden as a result of running a hybrid program was a key concern. To mitigate the potential for burnout, Henry Ford Health aligned services and materials with how the on-site cardiac rehab program is managed.
Dr. Keteyian closed by pointing out that the number of patients who qualify for cardiac rehabilitation each year outnumbers the available spaces in on-site programs throughout the United States. Even if these programs were running at full capacity, only ~ 50% of the eligible patients could be seen. He argued, therefore, that there is a significant need to increase the number of best-practice cardiac rehabilitation programs and the methods available to patients to access them (Balady, 2011).
Feb. 11, 2025: MVC Cardiac Rehab Workgroup
February Health in Action Workgroup: MVC Coordinating Center
MVC’s health in action workgroup this month included a presentation and workshop on patient journey mapping with MVC’s Associate Program Manager Jana Stewart, MS, MPH. This workshop was a continuation from the October 2024 collaborative-wide meeting’s post-discharge follow-up breakout session. Following the fall workshop, MVC collated member feedback on common barriers to follow-up for heart failure patients, which Stewart summarized as part of the February workgroup presentation. Participants of the workgroup also engaged in polls and two guided breakout discussions aimed at improving outcomes for patients with congestive heart failure.
Using Patient Journey Mapping to Improve Patient Outcomes
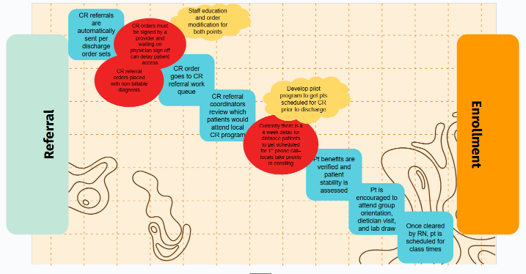
Stewart explained that the purpose of patient journey mapping is to understand the patient’s experience and pain points as they manage their health. This practice looks at service delivery by providers as well as the patients’ steps beyond healthcare appointments, providing useful data for root cause analyses and developing effective interventions. Stewart shared examples of patient journey maps that described what a patient might do, think, and feel as they seek healthcare services as well as maps illustrating a hospital’s workflow for enrolling eligible cardiac rehab patients. By generating maps from both the patient and provider perspective, one can identify opportunities for efficiencies and necessary interventions points.
Figure 2. Sample Patient Journey Map for Enrollment in Cardiac Rehab Following a Heart Procedure

In the first of two breakout sessions, attendees provided feedback and edits on a patient journey map for cardiac rehab enrollment following heart surgery. Attendees reimagined how the patient experience and hospital steps might change for a heart failure patient. Some interventions that were discussed included staff reviewing discharge lists frequently to keep track of patients, having a nurse navigator to help patients prepare for cardiac rehab, and keeping a consistent treatment plan between inpatient and outpatient providers.
Patient Experience – Key Barriers That Impact Patients
Stewart also outlined some key considerations regarding a patient’s experience and some of the barriers that may impact their ability to manage their health. One key barrier discussed was the limitations of our brain's processing capacity and the ways in which mental fatigue make it harder to remember and cope with information. Famed environmental psychologist George Miller once posited that a typical person is able to process and store to memory 5 – 9 pieces of information at a time. When a person is mentally fatigued (e.g., sleep deprived, burned out, cognitively burdened), their ability to understand and store information decreases.
Stewart cited a research study on patient recall after specialty care visits (Laws et al, 2018), which found only half of patients remembered the recommendations they received from a provider, and only about half of what they remembered was recalled correctly. This can have a significant impact on how well a patient follows their treatment plan after they are discharged or sent home. These recall difficulties are further exacerbated in patients with more extensive mental fatigue, such as those experiencing minority stress, unmet social needs, older age, lower health literacy, and other factors. Stewart argued that a patient’s current mental capacity and literacy are key considerations when journey mapping, as they are often the culprit for not following treatment plans.
One strategy Stewart shared that can reduce cognitive burden is the use of storytelling. Used as a framework for delivering information, stories allow patients to better understand and remember details. This can be done through patient story videos as well as case studies that demonstrate the progression of an illness or treatment plan. During one of the breakout discussions, participants brainstormed how they might use storytelling to communicate information to CHF patients. Ideas included establishing private community groups on social media for patients to share their stories, patient story pamphlets, and videos to play on hospital televisions or linked in patient discharge materials.
The feedback and ideas generated by participants during February's health in action workgroup will be used to draft resources for MVC member sites. MVC plans to bring those draft materials to future meetings or workgroups to gather feedback prior to dissemination. Participants also received a copy of the patient journey mapping template so they can utilize this approach at their site(s).
Feb. 27, 2025: Health in Action Workgroup
If you are interested in pursuing a healthcare improvement initiative, MVC has a robust registry of claims data that can be utilized as well as site specialists who can help facilitate connections with peers doing similar work. Please reach out to us here if you would like to learn more about MVC data or engagement offerings.


