0
View Post
Refreshed Hospital-Level, ED-Based Episode Push Reports Coming Soon to Members

Refreshed Hospital-Level, ED-Based Episode Push Reports Coming Soon to Members

The MVC Coordinating Center will soon distribute refreshed hospital-level versions of its push report utilizing emergency department-based episodes (“ED-based episodes”). MVC generated separate versions for acute care hospitals and Critical Access Hospitals (CAHs) with tailored comparison groups. In addition to reflecting more recent data across all included payers, these refreshed hospital-level reports differ from prior versions due to the addition of three high-volume ED conditions and the incorporation of Michigan Medicaid claims.

Each page of the report is dedicated to a specific condition with the same metrics throughout, such as risk-adjusted, price-standardized 30-day total episode spending, inpatient admission rates, and rates of post-ED utilization. Reports feature each hospital’s own attributed ED-based episode data for eight high-volume ED conditions: abdominal pain, cellulitis, chest pain (nonspecific), congestive heart failure (CHF), chronic obstructive pulmonary disease (COPD), diabetes with long-term complications (including renal, eye, neurological, or circulatory), diabetes with short-term complications (including ketoacidosis, hyperosmolarity, or coma), and urinary tract infection (UTI). The three new conditions included in this year’s refresh include diabetes with long-term complications, diabetes with short-term complications, and UTI.

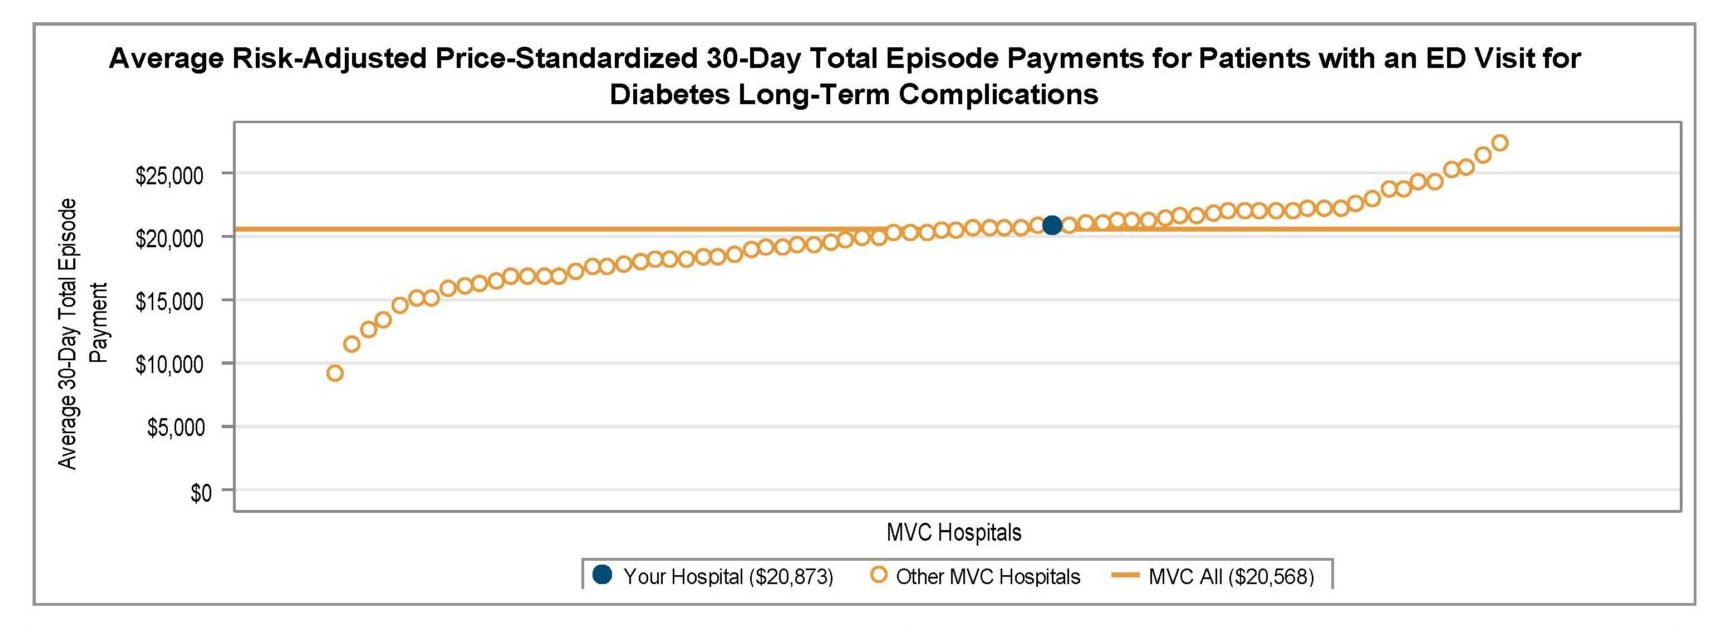
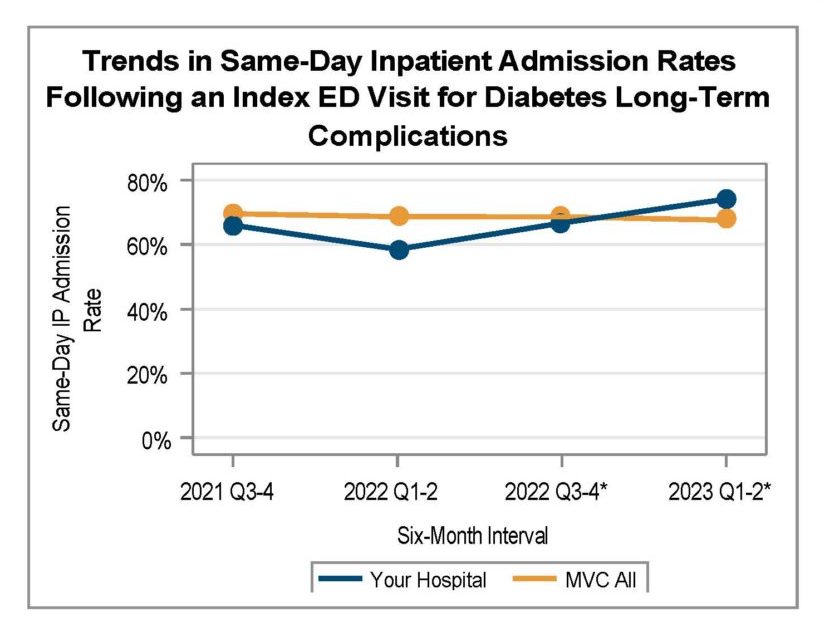
Among general acute care hospitals receiving a report, the average risk-adjusted, price-standardized 30-day total episode payment (Figure 1) for the reported conditions is highest for diabetes with long-term complications ($20,568), CHF ED-based episodes ($17,245), diabetes with short-term complications ($12,087), and COPD ED-based episodes ($10,289). The collaborative-wide average is lowest for chest pain ($3,111) and abdominal pain ($3,123) ED-based episodes. Within each condition, MVC 30-day total episode payments are consistently higher for episodes in which the patient had a same-day inpatient admission compared to episodes in which the patient did not have an inpatient stay beginning on the date of their ED visit. With that information in mind, hospital members can also use their individualized reports to track their same-day inpatient admission rate at six-month intervals using trend graphs for each included ED-based condition (Figure 2).

Figure 1.

Figure 2.

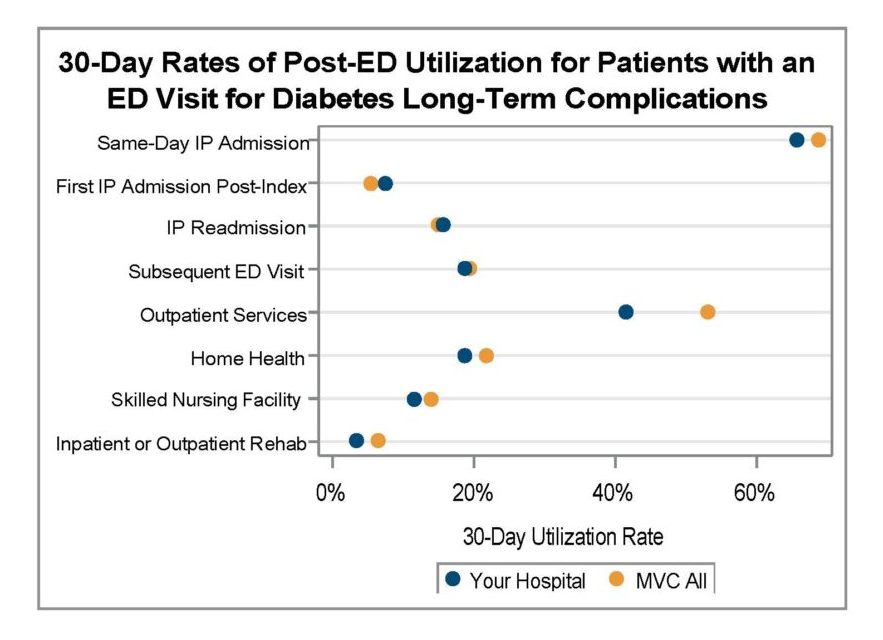
A key goal for these ED-based episode reports is to provide insight into healthcare utilization following index ED visits. Therefore, reports continue to include a dot plot (Figure 3) comparing patient post-ED utilization at a member hospital against their peer comparison group. Dot plots provide information on what percent of episodes had a same-day inpatient admission, what percent did not have a same-day inpatient admission but did see the patient admitted in the 1 to 30 days following the index ED visit, and the percent of patients who had two or more inpatient admissions (thus, at least one readmission) during the episode of care. Also provided are rates of subsequent ED visits, receipt of outpatient services, home health, skilled nursing facility care, and inpatient or outpatient rehab.

Figure 3.

These ED-based episodes are built using MVC’s most recent medical claims data from Medicare FFS, Blue Cross Blue Shield of Michigan PPO Commercial and Medicare Advantage plans, Blue Care Network HMO Commercial and Medicare Advantage plans, and Michigan Medicaid.

ED-based episodes utilize MVC’s newest episode of care data structure, which was developed last year in collaboration with the Michigan Emergency Department Improvement Collaborative (MEDIC), a BCBSM-funded Collaborative Quality Initiative with the goal of improving care and patient outcomes in Michigan emergency departments. MVC and MEDIC team members worked closely to develop 30-day episodes of care initialized by a patient’s visit to the ED and including all claims-documented care received in the 30 days following a patient’s index ED visit.

Please share your feedback with the MVC team if certain report measures are helpful or if you wish to see additional ED-based episode reporting for certain conditions and metrics. MVC is now also accepting custom report requests using its new ED-based data. Contact MVC to learn more.

0
View Post
MVC’s Refreshed Common Conditions Report Coming to Hospital Members Soon

MVC’s Refreshed Common Conditions Report Coming to Hospital Members Soon

MVC members will receive their next batch of updated push reports in the coming days with a refreshed version of MVC’s common conditions report. These reports provide insight into episodes of care for eight medical and surgical conditions that are commonly a focus for quality improvement efforts at MVC hospitals: acute myocardial infarction (AMI), chronic obstructive pulmonary disease (COPD), colectomy (non-cancer), congestive heart failure (CHF), coronary artery bypass graft (CABG), total knee and hip (joint) replacement, pneumonia, and spine surgery. MVC’s general acute care hospital and Critical Access Hospital (CAH) members will receive tailored versions of the report, with each group receiving benchmark data specific to their own category of hospitals.

Although the metrics provided vary by condition and case count, report pages generally focus on 30-day total episode payments, readmission rates, common reasons for readmissions, and post-acute care utilization. MVC price standardizes total episode payments to Medicare FFS amounts so that comparisons can be made across hospitals and over time. Payments are risk adjusted for patient age, gender, payer, comorbidities, and high or low prior healthcare utilization/payments.

Post-acute care utilization benchmarking for each of the eight medical and surgical conditions includes graphs displaying the percentage of each hospital’s patients who used home health care, inpatient/outpatient rehab, skilled nursing facility care, outpatient services, or emergency department care in the 30 days following their index hospitalization or surgery. Across the collaborative, reports show high use of 30-day home health care and outpatient services for these common conditions. For patients initiating their episode of care at a general acute care hospital within the collaborative, the home health care utilization rate was highest following CABG (69%) and joint replacement (50%).

Patients with a CABG episode were also high utilizers of outpatient services in the 30 days post-index (Figure 1), with a 73% average utilization rate. Patients with episodes for CHF (58%) and AMI (53%) were also high utilizers of outpatient services. Across conditions, use of outpatient services in the 30 days post-index was generally higher among episodes originating at CAHs than among episodes originating at general acute care hospitals.

Figure 1.

Reports also assess the setting of care for joint replacements and spine surgeries. For total knee and hip replacements, MVC data shows that the percent of joint replacements performed in an outpatient setting at general acute care hospitals across Michigan continued to rise from January 2021 through September 2022 (Figure 2).

Figure 2.

The patient population in these reports comprises adult patients who had surgery or an inpatient hospitalization at an MVC-participating hospital between January 2021 and September 2022. Measures are based on 30-day inpatient and surgical-based episodes of care data, incorporating paid claims from Blue Cross Blue Shield of Michigan and Blue Care Network Commercial and Medicare Advantage plans as well as paid claims from Medicare Fee-for-Service. Episodes meeting any of the following criteria were excluded from calculations: patients transferred to another acute care hospital or to hospice, patients who died during their index stay, and patients with a primary diagnosis of COVID-19 received in an inpatient setting at any point during their 30-day episode.

We hope our collaborative participants find these reports valuable, and as always, we welcome MVC members to contact MVC with any questions or analytic requests.

0
View Post
MVC’s 2023 Chronic Disease Management Follow-Up Reports Coming to Members Soon

MVC’s 2023 Chronic Disease Management Follow-Up Reports Coming to Members Soon

MVC will soon distribute the 2023 version of its chronic disease management follow-up reports to members. This refreshed version provides summary data on patients eligible for follow-up care after discharge from hospitalizations for congestive heart failure (CHF) or chronic obstructive pulmonary disease (COPD).

MVC defines timely follow-up care as receipt of an in-person or remote outpatient follow-up visit within 30 days of hospital discharge to home or home health care and before any readmission, emergency department (ED) visit, or procedure. Patients admitted to a skilled nursing facility, long-term acute care hospital, or inpatient rehab within the 30-day episode were excluded. MVC’s follow-up analyses was performed using claims-based episodes of care with index hospital admissions between 7/1/2019 and 06/30/2022 for Blue Cross Blue Shield of Michigan (BCBSM) PPO Commercial and Medicare Advantage (MA), Blue Care Network (BCN) HMO Commercial and MA, and Medicare Fee-for-Service insurance plans. For each of the two chronic conditions included in the report, hospitals with at least 11 episodes per year for a given condition received that condition-specific data.

The report offers a comparison of demographic characteristics for CHF and COPD patients who received a follow-up visit within 30 days versus those who did not receive follow-up. Demographic characteristics tabulated for each condition include the percent of patients living in “at-risk” or “distressed” Zip codes as defined by the Economic Innovation Group’s Distressed Community Index, patients’ average number of comorbidities, the mean age of patients, and the distribution of race and ethnicity. MVC recently refined and expanded its reporting of race and ethnicity identities, and these updates were reflected in the report. Patients are grouped as Hispanic if their insurance provider categorized their combined race/ethnicity as Hispanic or their ethnicity as Hispanic. Additionally, MVC no longer combines smaller groups and discontinued its use of the terms “other” and “unknown.”

On the first page provided for each condition, hospital follow-up rates are provided for three windows of time compared to those at other MVC hospitals (Figure 1), as well as trends over time for each follow-up window (Figure 2). For CHF, follow-up rates are provided in 3-day, 7-day, and 14-day time windows. For COPD, follow-up rates are provided in 7-, 14-, and 30-day time windows.

Figure 1.

Figure 2.

The second page of condition-specific feedback includes a summary of average 30-day risk-adjusted, price-standardized total episode payments by follow-up status compared to statewide and regional averages. Among general acute care hospitals included in the analysis, the statewide total average payment for CHF episodes was $17,235 for patients who received follow-up and $20,069 for those who did not; for COPD episodes, the statewide average payments were $13,815 among those with follow-up and $16,056 among those without. In reports generated for Critical Access Hospitals (CAHs), payments were compared to averages across all MVC CAH members. Rates of 30-day follow-up were also compared by payers across the same groups.

The final figure (Figure 3) in the report for each condition is a summary of follow-up method among those who received any follow-up care. Patients who received follow-up were categorized as having received only in-person follow-up visit(s), only remote follow-up, or both in-person and remote follow-up. MVC found that more than 80% of CHF and COPD patients statewide exclusively received in-person follow-up after a hospitalization.

Figure 3.

If you have any questions or feedback about this report, please contact the MVC Coordinating Center.

0
View Post
MVC Publishes its 2023 QECP Public Report as a Qualified Entity

MVC Publishes its 2023 QECP Public Report as a Qualified Entity

Today the MVC Coordinating Center published its annual Qualified Entity Certification Program (QECP) public report for 2023. One of the requirements of being a qualified entity (QE) with the Centers for Medicare & Medicaid Services (CMS) through the QECP is the annual dissemination of a public report created using claims data. MVC shared its first public report last year, making the 2023 report the second iteration.

As with last year, the 2023 MVC QECP Public Report provides unidentified aggregated data on Michigan hospitals for two measures: rates of 30-day rehospitalizations following start of home health care, and rates of outpatient follow-up received after hospitalization for congestive heart failure (CHF) or chronic obstructive pulmonary disease (COPD). Both measures were created using data from episodes of care initialized by inpatient hospitalizations or surgeries between 1/1/2018 and 12/31/2021.

For 2018-2021, the overall rate of 30-day unplanned rehospitalizations from home health among MVC member hospitals in Michigan was 11.3%. Risk-adjusted rates by index hospital ranged from 1.6% to 18.5% (Figure 1). By home health provider, risk-adjusted rates ranged from 2.0% to 23.6%. Patients whose episode of care began with an index event for endocarditis, COPD, CHF, or percutaneous coronary intervention (PCI) were more likely than patients with other index conditions to experience an unplanned rehospitalization in the 30 days after they started home health care.

Figure 1. Risk-Adjusted Rates of 30-Day Unplanned Rehospitalization from Home Health, by MVC Hospital

Across the 102 MVC hospitals with attributed episodes of care data underlying this report, the unadjusted rates of patients receiving outpatient follow-up were higher following index hospitalizations for CHF than for COPD (Figures 2 and 3). This was the case whether follow-up occurred three days (16% vs. 13%), seven days (45% vs. 37%), 14 days (63% vs. 54%), or 30 days (72% vs. 64%) after discharge.

Figure 2. 30-Day Follow-Up After CHF by MVC Hospital

Figure 3. 30-Day Follow-Up After COPD by MVC Hospital

For more information and the entire set of findings, we invite you to read the full report, which is available online to any member of the public on the MVC Resources page or directly here.

QE certification status allows MVC to provide hospital members with additional data from Medicare Fee-for-Service (FFS) claims at a level of granularity not otherwise available under standard CMS data use agreements. Reports located under the “QE Data” icon on the MVC registry allow hospital registry users to see unsuppressed data that include case counts <11 as well as utilization rates and average payments based on case counts <11. In addition, on any QE Data registry report, members can click on specific data points to load a list of all episodes underlying that data point. From that episode list, it is possible to view drill-down information on any individual listed episode to learn more about the claims and price-standardized payments comprising that episode.

MVC members representing one or more MVC-participating hospitals can send an email to Michigan-Value-Collaborative@med.umich.edu to learn more about data available through MVC’s QECP reports and to receive the forms necessary to gain access to those registry reports.

0
View Post
MVC’s SNF and HH Push Report Latest in Post-Discharge Insights

MVC’s SNF and HH Push Report Latest in Post-Discharge Insights

MVC released another new push report recently with the first iteration of a skilled nursing facility (SNF) and home health focused report. MVC members frequently identify post-discharge care and SNF utilization as focus areas for quality improvement; therefore, this report was developed to help hospitals benchmark their performance in this area and identify opportunities to improve care coordination. Critical access hospitals (CAHs) received a tailored version of the report to allow for metric comparisons to only other CAHs.

This report highlighted various SNF and home health utilization metrics using 30-day claims-based episodes for MVC’s medical conditions: acute myocardial infarction (AMI), atrial fibrillation, chronic obstructive pulmonary disease (COPD), congestive heart failure (CHF), endocarditis, pneumonia, sepsis, small bowel obstruction, and stroke. Patient episodes were included if they had an inpatient admission between 1/1/2021 and 6/30/2022 and had one of the following insurance plans: Blue Care Network (BCN) HMO Commercial or Medicare Advantage (MA), Blue Cross Blue Shield of Michigan (BCBSM) PPO Commercial or MA, or Medicare Fee-for-Service (FFS).

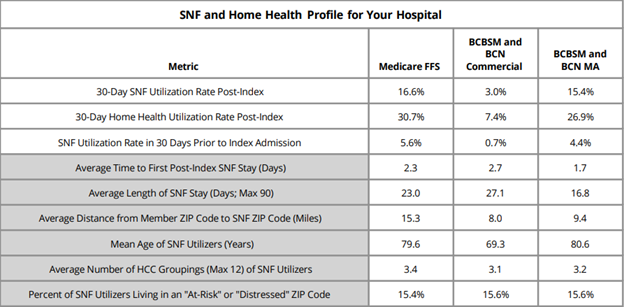
The first page of the report contained a SNF and home health profile table (Figure 1), which included nine metrics designed to give an overall look at post-discharge utilization patterns as well as information about a given hospital’s patient population. The first three metrics reflected all patients treated for medical conditions in this time period for the included payers and the metrics in gray were comprised only of patients that utilized SNF in the 30 days post-discharge from their episode's index hospitalization. Overall, MVC found that Medicare FFS patients utilized SNF and home health services more often than other payers. For CAHs, this table was not separated by payer.

Figure 1.

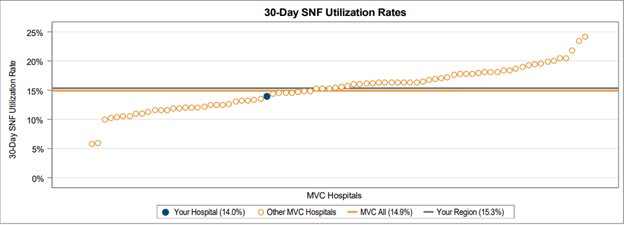
On the subsequent pages, 30-day overall SNF and home health utilization rates were provided in a caterpillar plot format to showcase variation across the collaborative (Figure 2). These rates varied between 5% and 25% for SNF utilization and between 10% and 40% for home health utilization.

Figure 2.

MVC also provided 30-day SNF and home health utilization rates broken out by condition to allow each hospital to benchmark rates across their site’s medical service lines and compared to the MVC average rate for each condition (Figure 3). Medical conditions were only included in this figure if a hospital had at least 11 cases between 1/1/2021 and 6/30/2022. On average across the collaborative, the highest 30-day post-discharge SNF utilization rates were observed in endocarditis (28%), sepsis (19.5%), and stroke (19.5%) patients.

Figure 3.

Hospitals also received a table identifying the most frequently utilized SNFs from a medical condition episode to help sites understand where their patients are going when receiving SNF care after discharge. A similar table was shown for home health providers.

The final page of the report included four caterpillar plots tailored to specific denominators. This included 30-day SNF and home health utilization rates for the cohort of patients discharged home. It also included readmission rates for patients who were discharged to SNF and readmission rates for patients discharged to home health. These plots were included to inform each hospital about patterns in their transitions of care and readmissions. There was significant variability in readmission rates following discharge to either a SNF or home health facility, with some hospitals averaging close to 5% readmission rates and some hospitals seeing an average of nearly 40% of patients readmitted during the 30-day post-discharge window (Figure 4).

Figure 4.

As part of its new Lunch & Learn series, MVC recently hosted a session focused on MVC data that included a walkthrough of its SNF/HH report and a deeper dive into those report metrics using MVC’s registry. Those who were unable to attend can watch a recording of the presentation here, which demonstrates how to replicate aspects of the push report on MVC’s registry in order to view additional episode spending and patient-level data.

If you have any questions or feedback about this report, please reach out to the MVC Coordinating Center.

0
View Post
MVC Workgroup Planned to Support Members Focused on Cardiac Rehabilitation Rates

MVC Workgroup Planned to Support Members Focused on Cardiac Rehabilitation Rates

Next week marks the kickoff of American Heart Month, commemorating the more than 600,000 Americans who die from heart disease each year and raising awareness about strategies that support heart health. Cardiac rehabilitation (CR) is one of those critical strategies, with the second full week of February each year dedicated to promoting its role in reducing the harmful effects of heart disease. In support of efforts to promote this life-saving program, MVC will host a CR-focused workgroup on Feb. 16, from 2-3 p.m., with MVC Co-Director Mike Thompson, Ph.D., assistant professor in the Department of Cardiac Surgery at Michigan Medicine, as its guest speaker. He will highlight some recent efforts to increase patient enrollment.

This is the third time MVC has hosted a workgroup dedicated to CR utilization; the first took place during last year’s CR week in February 2022 and featured guest presenters Steven Keteyian, Ph.D., Director of Preventive Cardiology at Henry Ford Medical Group, and Greg Merritt, Ph.D., patient advocate, in a discussion about strategies for increasing CR use. The second in November 2022 featured Diane Hamilton, BAA, CEP, of Corewell Health Trenton Hospital, who discussed addressing transportation barriers as an obstacle to CR attendance.

CR is a medically supervised program encompassing exercise, education, peer support, and counseling to help patients recovering from a cardiac event, disease, or procedure. There is high-quality evidence that it saves lives and money. A 2016 meta-analysis estimated that for every 37 coronary heart disease patients who attended CR, one of their lives was saved on average. Additionally, the Blue Cross Blue Shield of Michigan Cardiovascular Consortium (BMC2) and the Michigan Value Collaborative (MVC) came together recently to measure the impact attributed to CR for percutaneous coronary intervention (PCI) patients treated between 2015 and 2019, and estimated 86 lives saved, 145 readmissions avoided, and approximately $1.8 million in savings.

Despite the evidence in favor of its clinical impact and cost-effectiveness, CR remains heavily underutilized, with only one in three eligible Michiganders participating. MVC’s hospital-level cardiac rehab reports showcase similar findings (Figure 1). These reports were rebranded recently under the new Michigan Cardiac Rehabilitation Network (MiCR) umbrella in partnership with BMC2. They measure whether and when patients started CR at MVC hospitals and how long they kept going. The collaborative-wide average for PCI patients, for example, was 38.3%, with hospital rates ranging from approximately 10%-60%. Such a wide range in patient participation rates suggests MVC member hospitals would benefit from the insights of top-performing peers.

Figure 1.

MVC is pursuing several strategies to address this critical gap in utilization. The upcoming Feb. 16 workgroup will be one of several CR-focused workgroups offered throughout 2023. The Coordinating Center decided to offer workgroups on this topic in part because of its recent incorporation of a CR measure into the MVC Component of the BCBSM Pay-for-Performance (P4P) Program. MVC member hospitals were recently asked to make metric selections for the upcoming Program Year 2024-2025 cycle, and as of February 2023 just over one quarter of hospitals elected to be scored on their CR rates for the new value metric component of the MVC measure. These hospitals will receive more P4P points if their CR utilization rate improves over time or is greater relative to their peers. These hospitals are currently treating the patients who will make up their performance year data for Program Year 2024 of the MVC measure. Therefore, MVC aims to offer tailored workgroups to support those sites being scored on CR utilization, most likely incorporating some unblinded data presentations and highlighting key resources and practices for quality improvement purposes.

The MVC team hopes these efforts to facilitate peer learning within the collaborative will help hospitals across the state improve CR participation. Doing so would save the lives of patients and improve the value of healthcare in Michigan. Sites that selected CR as their value metric component of the MVC P4P measure are encouraged to attend; however, anyone interested in this area of healthcare is welcome. Those interested in attending may register here. Please contact the MVC Coordinating Center with any questions at Michigan-Value-Collaborative@med.umich.edu.

0
View Post
MVC Distributes New Push Report Dedicated to P4P Conditions

MVC Distributes New Push Report Dedicated to P4P Conditions

MVC launched a new push report this week dedicated to the MVC P4P conditions. Its purpose is to support hospitals in identifying areas of opportunity within past and present conditions of the MVC Component of the Blue Cross Blue Shield of Michigan (BCBSM) Pay-for-Performance (P4P) Program. The conditions currently included in P4P and in this report are chronic obstructive pulmonary disease (COPD), congestive heart failure (CHF), colectomy (non-cancer), coronary artery bypass graft (CABG), joint replacement (hip and knee), pneumonia, and spine surgery. Acute myocardial infarction (AMI) is also included in this report as a historical P4P condition. Hospitals received a page for each condition if they met a case count threshold of 11 episodes in 2019 and 2020.

This report was limited to episodes included in the P4P program with index admissions in 2019 and 2020, and thus included the following payers: BCBSM Preferred Provider Organization (PPO), BCBSM Medicare Advantage, Blue Care Network (BCN) Health Maintenance Organization (HMO), BCN Medicare Advantage, and Medicare Fee-For-Service (FFS). To align with the P4P program, MVC excluded patients with a discharge disposition of inpatient death or transfer to hospice, episodes that started with an inpatient transfer, and episodes with a COVID-19 diagnosis on a facility claim in the inpatient setting. To fully exclude COVID-19 patients, pneumonia episodes in March 2020 were also excluded.

The reports provided data on hospital trends in episode payments, readmission rates, post-acute care utilization, and emergency department utilization for P4P patients. Data from the push report can be used in conjunction with the registry reports to inform areas of opportunity in the P4P conditions. The push reports also provided a snapshot of each hospital’s P4P patient population (see Figure 1), including race, mean age, and the average number of comorbidities.

Figure 1. Patient Population Snapshot for Blinded Hospital

For Critical Access Hospitals (CAHs), the report also included index length of stay. For acute care hospitals, the report included a “reasons for readmissions” table that identified the top five reasons a P4P patient was readmitted. However, this table was removed from the report’s joint replacement page due to low readmission rates among joint replacement surgeries. In its place, acute care hospitals received their ratio of outpatient to inpatient surgeries.

As with other push reports, hospitals were compared to other members in the collaborative for select measures. For acute care hospitals, each hospital’s report includes a comparison point for all MVC episodes (“MVC All”) as well as for episodes at hospitals in the same geographic region (“Your Region”). These reference points do not include episodes that occurred at hospitals with a CAH designation. Similarly, the reports distributed to CAHs included comparison points for MVC episodes at all CAHs in the collaborative (“CAH Average”).

This report takes the place of the cardiac service line reports, which included data on CHF, AMI, and CABG. The new P4P conditions push report uses many of the same measures and figures from the cardiac service line reports, but for the complete list of P4P conditions.

For more information on the MVC Component of the P4P Program, see the MVC P4P Technical Document. Please share your feedback on the newest P4P conditions push report with the MVC Coordinating Center at michiganvaluecollaborative@gmail.com.

0

CHF Workgroup Discusses Value of Outpatient Intravenous Diuresis

The Michigan Value Collaborative (MVC) holds bi-monthly virtual workgroups on six different clinical areas of focus. The goal of these workgroups is to bring collaborative members together to discuss current quality improvement initiatives and challenges. These six different clinical areas include chronic disease management (CDM), chronic obstructive pulmonary disease (COPD), congestive heart failure (CHF), diabetes, joint, and sepsis. At the most recent MVC CHF workgroup, the discussion centered around inpatient versus outpatient intravenous diuresis for the acute exacerbation of CHF.

The prevalence of heart failure in the United States is increasing, with one study indicating it affects more than 5.7 million people. The study reports that up to 80% of patients with acute decompensated heart failure (ADHF) visit their emergency departments and that 91.5% of those patients were thereafter readmitted to the hospital for diuresis.

With increasing prevalence comes greater direct and indirect healthcare costs associated with CHF, accounting for approximately $40 billion annually in the United States. For patients over the age of 65, it is a leading cause of hospitalization with annual costs of $11 billion.

Despite significant costs and healthcare burden associated with this condition, the same study finds that no official guidance exists regarding an appropriate location for therapy. Since hospital readmission reduction programs seek to incentivize reductions in readmissions, it is important to simultaneously provide guidance to providers and patients on safe and effective options for outpatient treatment and therapy.

To address this concern, the workgroup discussed the benefits and safety of outpatient intravenous (IV) diuresis and how the outpatient administration of furosemide can be safe and effective. MVC members shared their experiences with setting up these clinics, their inclusion criteria, and other protocols. A standard diuretic protocol could include each patient being given an IV furosemide bolus with continuous infusion within the most appropriate outpatient setting, which could include the patient’s home or in a mobile clinic.

While in the outpatient setting, patients undergoing this treatment would be monitored via cardiac telemetry and appropriate blood panels before and after the infusion. Patients on maintenance medications are instructed to continue their standard dose in the outpatient setting as appropriate based on their individualized treatment protocol. Patients should follow up with their cardiology and primary care teams to maintain their treatment and care maintenance plans. Following the outpatient IV diuresis encounter, the study reported patients had lower costs, fewer hospital stays, and lower mortality risk than CHF patients who did not receive outpatient IV diuresis.

Overall, studies indicate that outpatient CHF IV diuresis treatment is a safe and effective method of relieving CHF symptoms with a low risk of adverse events. The MVC members in attendance had positive thoughts and experiences regarding outpatient IV diuresis clinics and would recommend further discussion on them. The outpatient mobile CHF diuresis clinic was of notable interest to the MVC members in attendance and will be considered for a specialty topic in future workgroups and blog posts.

The MVC Coordinating Center is interested in hearing how your organization is improving CHF patient care and reducing CHF hospital readmissions. If you would like to present at or attend an upcoming MVC workgroup, please contact the MVC Coordinating Center at the michiganvaluecollaborative@gmail.com.

0
View Post
MVC Efforts to Improve Cardiac Rehab Enrollment in Michigan

MVC Efforts to Improve Cardiac Rehab Enrollment in Michigan

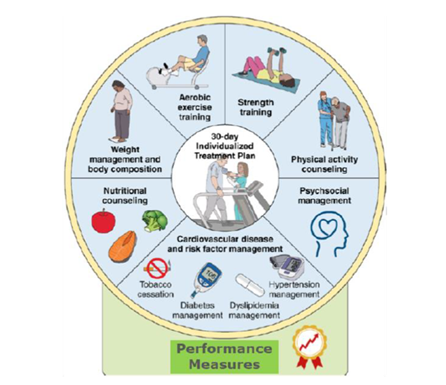
Cardiac rehabilitation (CR) is designed to improve cardiovascular function and mitigate risk factors for future cardiovascular events through monitored exercise, patient education, lifestyle modifications, smoking cessation, and social support (1). For over a decade, CR has been a Class I indication in clinical guidelines for patients who have had a heart attack, chronic stable angina, chronic heart failure, or have undergone a percutaneous coronary intervention (PCI), surgical (SAVR) or transcatheter aortic valve replacement (TAVR), or coronary artery bypass grafting (CABG). The evidence supporting CR as a high-value therapy for patients is clear: better long-term survival, fewer secondary cardiovascular events, fewer readmissions, improved quality of life, and lower healthcare utilization (2–6). 

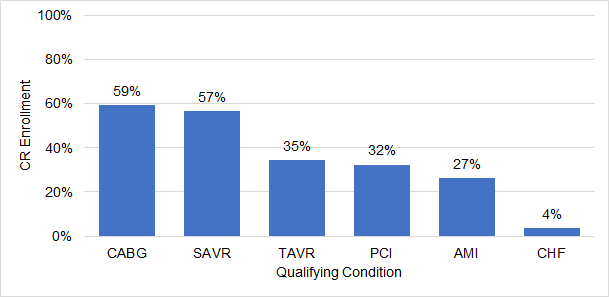
Unfortunately, only a fraction of Michigan residents eligible for CR attend a single session following hospitalization for a qualifying condition, with rates as high as 59% for patients undergoing CABG and as low as 4% for patients with congestive heart failure (CHF) (see Figure 1). These data highlight that we as a state are well short of the national goal set by the Million Hearts Initiative of 70% enrollment for all eligible patients. Data from Michigan also suggests wide variation in CR enrollment across hospitals that are not fully explained by differences in patient case-mix (7).

Figure 1. Collaborative-wide CR enrollment rates for qualifying conditions (01/2017-12/2019)

Since 2019 the MVC Coordinating Center sought to equitably increase participation in CR for all eligible individuals in Michigan in partnership with the Blue Cross Blue Shield Cardiovascular Consortium (BMC2) and the Michigan Society of Thoracic and Cardiovascular Surgeons Quality Collaborative (MSTCVS-QC). In an effort to drive improvement in this area across the collaborative’s membership, MVC developed a number of resources and strategies. For example, the MVC Coordinating Center built hospital-level reports that provide members with information on CR enrollment across eligible conditions benchmarked against all MVC hospitals. This week the newest iteration of this CR report was distributed to members. The previous version of the report was sent in March 2021 with a reporting period of 1/1/17 – 12/31/19. The latest version shifted that reporting period by six months (7/1/17 – 6/30/20), included Medicaid episodes for the first time, expanded the time horizon from 90 days to one year, and added information on CHF and acute myocardial infarction (AMI) episodes. 

With the addition of CHF and AMI (both “high-volume” MVC conditions), the number of hospitals eligible to receive a CR report doubled from 47 to 95, so many MVC hospitals received this report for the first time this month. The most significant methodological change compared to the previous report was the expansion of the episode window from 90 days to 365 days (one year). Previous reports undercounted the number of CR visits by using the standard MVC episode length of 90 days when a full CR program consists of 36 sessions, which are often not feasible to complete in 90 days. Therefore, it was important to expand the time horizon to achieve a fuller count. The report instead looked one full year beyond the index event (either PCI, TAVR, SAVR, CABG, CHF, or AMI) to calculate CR utilization rates and number of visits.

The MVC team also convened a multidisciplinary stakeholder group of CR practitioners, physicians, and CQI leaders to foster discussion around barriers and facilitators to CR enrollment. Many of the recent changes to the CR reports were a direct result of suggestions from this stakeholder group. Quarterly seminars have also provided opportunities for local facilities to share ongoing quality improvement activities and to learn from national leaders about innovations in the delivery and quality of CR.

More recently, the MVC team conducted virtual site visits with several CR facilities around the state to learn about their programs, the successes and challenges they have encountered, and ways to improve collaboration in Michigan around CR enrollment. Common themes emerged as barriers to CR enrollment, including lack of patient or physician engagement, geographical and/or technological gaps in care between the hospital and CR facility, and insurance coverage and reimbursement. Through collaborative learning and dissemination of best practices, the MVC Coordinating Center believes that its members can begin to address many of these challenges moving forward. 

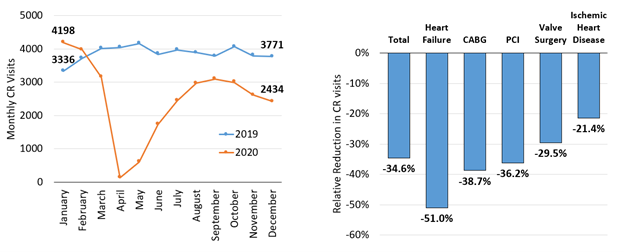
These efforts are all the more important as CR facilities begin to recover from the effects of the COVID-19 pandemic. Many facilities had to reduce capacity and staff as a result of the pandemic, and the number of CR visits declined significantly compared to pre-pandemic months (see Figure 2). While many CR facilities are back to operating at full capacity, continued efforts will be needed to return CR enrollment to pre-pandemic levels. Some sites in Michigan have adopted virtual, home-based, or hybrid versions of CR to continue providing care to patients throughout the pandemic, and its place as a substitute for facility-based CR will require continued exploration that can be supported through collaborative efforts.

Figure 2. Changes in CR enrollment from 2019 to 2020 over time and by qualifying condition

While many challenges remain to achieve the national goal of 70% enrollment in CR for eligible individuals, the MVC Coordinating Center is optimistic that its current and planned efforts will provide opportunities for Michigan to lead the way. If you are interested in joining our efforts to equitably increase CR enrollment for eligible patients in Michigan, please reach out for more information at michiganvaluecollaborative@gmail.com.

References

  1. Rubin R. Although Cardiac Rehab Saves Lives, Few Eligible Patients Take Part. JAMA [Internet]. 2019 Jul 17; Available from: http://dx.doi.org/10.1001/jama.2019.8604 PMID: 31314061
  2. Heran BS, Chen JM, Ebrahim S, Moxham T, Oldridge N, Rees K, Thompson DR, Taylor RS. Exercise-based cardiac rehabilitation for coronary heart disease. Cochrane Database Syst Rev. 2011 Jul 6;(7):CD001800. PMCID: PMC4229995
  3. Taylor RS, Long L, Mordi IR, Madsen MT, Davies EJ, Dalal H, Rees K, Singh SJ, Gluud C, Zwisler A-D. Exercise-Based Rehabilitation for Heart Failure: Cochrane Systematic Review, Meta-Analysis, and Trial Sequential Analysis. JACC Heart Fail. 2019 Aug;7(8):691–705. PMID: 31302050
  4. Taylor RS, Brown A, Ebrahim S, Jolliffe J, Noorani H, Rees K, Skidmore B, Stone JA, Thompson DR, Oldridge N. Exercise-based rehabilitation for patients with coronary heart disease: systematic review and meta-analysis of randomized controlled trials. Am J Med. 2004 May 15;116(10):682–692. PMID: 15121495
  5. Anderson L, Thompson DR, Oldridge N, Zwisler A, Rees K, Martin N, Taylor RS. Exercise‐based cardiac rehabilitation for coronary heart disease. Cochrane Database Syst Rev [Internet]. John Wiley & Sons, Ltd; 2016 [cited 2021 Jan 25];(1). Available from: https://www.cochranelibrary.com/cdsr/doi/10.1002/14651858.CD001800.pub3/abstract
  6. Rejeski WJ, Foy CG, Brawley LR, Brubaker PH, Focht BC, Norris JL 3rd, Smith ML. Older adults in cardiac rehabilitation: a new strategy for enhancing physical function. Med Sci Sports Exerc. 2002 Nov;34(11):1705–1713. PMID: 12439072
  7. Thompson MP, Yaser JM, Hou H, Syrjamaki JD, DeLucia A 3rd, Likosky DS, Keteyian SJ, Prager RL, Gurm HS, Sukul D. Determinants of Hospital Variation in Cardiac Rehabilitation Enrollment During Coronary Artery Disease Episodes of Care. Circ Cardiovasc Qual Outcomes. American Heart Association; 2021 Feb;14(2):e007144. PMID: 33541107
0

The Michigan Value Collaborative’s Refreshed Cardiac Service Line Reports

The Michigan Value Collaborative (MVC) Coordinating Center disseminated it’s long-running customized cardiac service line report to hospital and physician organization (PO) members on February 23, 2021. These reports provide hospital-level information on congestive heart failure (CHF), acute myocardial infarction (AMI), and coronary artery bypass graft (CABG) conditions. To receive information on any one of these conditions, a hospital must have at least 20 cases per year over the three-year reporting period (1/1/17 – 12/31/19).

Since the last iteration of the cardiac service line report sent in June 2020, the Coordinating Center has defined four distinct regions within Michigan, allowing members to make regional comparisons. These comparisons have been incorporated into the 30-day risk-adjusted total episode payment trend chart, the post-acute care utilization bar graph, and the 30-day readmission rate trend chart of the reports as shown in the following AMI figures for a fictional institution, Hospital A.

Acute Myocardial Infarction Figures. Hospital A

Figure 1 shows the 30-day risk-adjusted total episode payments broken up into six-month intervals, illustrating that episode payments for AMI hold steady across the Collaborative at an average of around $22,000. Please note that as with all MVC reports, this represents price standardized dollars to allow for fair comparisons between hospitals. The price standardized dollars can be thought of as a measure of utilization as opposed to true dollar amounts.

Figure 2 displays the percentage of AMI patients who utilized home health (15.0% across MVC), rehab (14.1% across MVC), or skilled nursing facilities (9.9% across MVC). Figure 3 illustrates that, between 2017 and 2019, approximately 14% of AMI patients were readmitted within 30 days. Finally, Figure 4 shows Hospital A that based on the most recent claim before a readmission occurred, 90.9% of readmitted patients were coming from home, 8.8% were coming from Skilled Nursing Facilities (SNF), and very few were coming from inpatient rehabilitation (0.3%). Hospitals can use this information to observe if they are an outlier in any of the categories and where they may have an opportunity to improve, to benchmark themselves against the MVC all and regional averages, and to notice trends in their performance

These combined-payer push reports are distributed twice a year, meaning the next iteration is likely to be sent out in the summer of 2021. In the meantime, single-payer information is always available on the MVC registry, allowing for continued monitoring of these metrics. Data is added every month for Blue Cross payers and quarterly for Medicare. Michigan Medicaid data will be live on the registry at the start of Q2 this year.

If you need registry access, if you have ideas on how these reports can be made more versatile, or if you are using these data for a quality improvement project at your institution, please contact michiganvaluecollaborative@gmail.com. Additionally, please reach out if you want further information in the way of custom analytics.