0
View Post
MVC’s Updated Common Conditions Report Now Available to Hospital Members

MVC’s Updated Common Conditions Report Now Available to Hospital Members

On Monday, the Coordinating Center distributed a refreshed version of MVC’s common conditions report. This report delivers a comprehensive analysis of care episodes for eight prevalent medical and surgical conditions, frequently targeted for quality improvement initiatives within MVC hospitals. It assesses hospital performance and highlights potential areas for growth. The report’s current conditions include chronic obstructive pulmonary disease (COPD), colectomy (non-cancer), congestive heart failure (CHF), total knee and hip (joint) replacement, percutaneous coronary intervention (PCI), pneumonia, and sepsis. Notably, acute myocardial infarction (AMI) and spine surgery, which were previously included, have been replaced by two new conditions, PCI and sepsis, in the latest report.

MVC generated reports for 96 eligible hospitals. General acute care hospital and Critical Access Hospital (CAH) members received tailored versions of the report, which included benchmark data specific to their respective hospital categories and tailored comparison groups.

Although the provided metrics vary by condition and case count, report pages generally focus on 30-day total episode payments, post-acute care and post-discharge ED utilization, readmission rates, and common reasons for readmissions. MVC price standardizes total episode payments to Medicare FFS amounts so that comparisons can be made across hospitals over time. Payments are risk-adjusted for patient age, gender, payer, comorbidities, and high or low prior healthcare utilization/payments.

The report has been updated to feature recent data covering the period of January 1, 2022, through December 31, 2023, for Blue Cross Blue Shield of Michigan (BCBSM) / Blue Care Network (BCN) Commercial, BCBSM/BCN Medicare Advantage (MA), and Michigan Medicaid; Medicare FFS data covers the period of January 1, 2022, through November 30, 2022.

Upon opening the latest report, MVC members will find the integration of a “Common Conditions and Procedures Report”, which consolidates the patient population data for all conditions at each hospital, facilitating a more comprehensive and effective comparison.

Additionally, each page now features a figure displaying the breakdown of 30-day risk-adjusted, price-standardized post-acute care payments by new payer categories (See Figure 1). The new categories include BCBSM/BCN Commercial, BCBSM/BCN Medicare Advantage, Medicare Only, Medicaid Only, and Dual Eligible. With the addition of the “Dual-Eligible” category, it should be emphasized that dual-eligible patients have been reclassified as such and are now exclusively represented within this new category and no longer represented in the separate Medicare and Medicaid categories.

Figure 1.

Beyond offering insights into payments by payer and post-acute care categories, this figure gains significant value when analyzed alongside the new graphical representation of post-acute care utilization rates (See Figure 2). This comparative analysis serves to clarify the spending trends associated with each post-acute care category, illustrating how spending aligns with utilization frequency. The updated dot figure now features expanded post-acute care categories, with the addition of Inpatient Rehabilitation (IP Rehab), Outpatient Rehabilitation (OP Rehab), Emergency Department (ED), and Long-Term Acute Care Hospital (LTACH) services. This figure also depicts the percentage of each hospital’s patients who utilized home health care, skilled nursing facility (SNF) care, and outpatient services.

Figure 2.

Across the collaborative, reports continue to show high use of 30-day home health care and outpatient services for these common conditions. For patients initiating their episode of care at a general acute care hospital within the collaborative, the home health care utilization rate was highest following CABG and joint replacement.

Patients experiencing a CABG episode were noted to have significant use of outpatient services within the 30 days following the index event, demonstrating an average utilization rate of 66%. This rate reflects a 7% decline in utilization rate from the figures reported in the previous common conditions report. Patients with episodes of CHF and PCI were also high utilizers of outpatient services.

One final trend noted across the collaborative is a general decrease in 30-day readmission rates for colectomy, COPD, CABG, CHF, pneumonia, and sepsis (See Figure 3).

Figure 3.

MVC is dedicated to regularly updating its commons conditions report, aiming to equip collaborative partners with insightful data that can drive and reinforce meaningful advancements in healthcare quality. We hope these reports prove beneficial and welcome MVC members to contact MVC with any questions or analytic requests.

0
View Post
MVC Introduces New Multi-Payer Cardiac Rehab Registry Reports

MVC Introduces New Multi-Payer Cardiac Rehab Registry Reports

The MVC Coordinating Center added four new multi-payer reports to its online registry in April. These new reports evaluate cardiac rehabilitation utilization and encompass all metrics previously provided annually in MVC’s hospital-level cardiac rehab push report for acute myocardial infarction (AMI), percutaneous coronary intervention (PCI), heart valve repair or replacement (SAVR or TAVR), coronary artery bypass graft (CABG), and congestive heart failure (CHF). Each report reflects the most up-to-date available claims data from Blue Cross Blue Shield of Michigan (BCBSM) PPO Commercial, BCBSM PPO Medicare Advantage (MA), Blue Care Network (BCN) HMO Commercial, BCN MA, Medicare Fee-for-Service, and Medicaid insurance plans. Users may select any combination of cardiac conditions and insurance plans to assess in each report.

In addition to allowing dynamic selection of cardiac conditions and payers, the reports allow for customization of report date range (the span of episode start dates), episode length (the time period following each index event), and index place of service (e.g., inpatient, outpatient, emergency department). Users may also filter by patient characteristics including gender, age, and comorbidities (diagnoses prior to the index event). Other patient-level characteristics related to the reflected episode can also be filtered, including whether the patient was transferred during their index event, was diagnosed with COVID-19 during the index event or within 30 days post-discharge, and by certain diagnoses during the index event or within 90 days. Up to four comparison groups are offered for each figure: the collaborative-wide measure, MVC All; the measure among other hospitals in the region, Hospital Region; the measure among only hospitals of the same type, Acute Care/Critical Access Cohort; and the measure among other rural hospitals (if applicable), MHA Rural Hospital Cohort.

Cardiac Rehab Utilization Rates

The first of the four new report provides data on cardiac rehab utilization rates (Figure 1). This report includes a description of cardiac rehab benefits followed by two figures reflecting utilization rates among episodes of the desired condition and payer combinations after all selected filters have been applied. The first figure shows the overall rate of cardiac rehab compared to utilization goals set by the Michigan Cardiac Rehab network (MiCR) and Million Hearts®. The second figure shows utilization trends over time at the user’s hospital(s) and a selected comparison group. This full report and all other reports can be downloaded as a ready-to-print PDF or image file.

Figure 1. Cardiac Rehab Utilization Rates Report

Cardiac Rehab Utilization Rankings

The next report provides data on cardiac rehab utilization rankings, showcasing the ranked order of hospital-level utilization rates for a selected comparison group. For example, in Figure 2 there are data points for cardiac rehab utilization rates during AMI, CABG, PCI, SAVR, and TAVR episodes originating at MVC Hospitals A, B, and C between December 1, 2018, and November 30, 2023 compared to all other MVC general acute care hospitals. The average rate across all comparison hospitals is about 31%, and each point outlined in orange represents the rate at an individual comparison hospital. Again, this report and all others may be downloaded in a ready-to-share format.

Figure 2. Cardiac Rehab Utilization Rankings Report

The remaining new cardiac rehab registry reports provide visual hospital rankings in the same format as the utilization rankings report, but for two other measures: 1) mean days to first cardiac rehab visit, which ranks the average number of days from index discharge to patients’ first cardiac rehab visit (up to 365 days); and 2), mean number of cardiac rehab visits, which ranks the average number of cardiac rehab visits completed within a selected episode length. These reports offer the same dynamic filters and output capabilities.

All MVC registry users will have access to these reports to view the data for their site(s). If you do not have registry access and are interested in using the registry to view these data, you should complete MVC’s user access request form. If you have any questions or feedback about the new registry reports, please contact the Coordinating Center.

0
View Post
MVC Finalizes Summary Evaluation of PY22-23 P4P Cycle

MVC Finalizes Summary Evaluation of PY22-23 P4P Cycle

This year, the Michigan Value Collaborative (MVC) completed all scoring and evaluation for Program Year 2023 of the MVC Component of the Blue Cross Blue Shield of Michigan (BCBSM) Pay-for-Performance (P4P) Program. This concluded a two-year program cycle encompassing the program methodologies and conditions utilized in PYs 2022 and 2023. MVC is excited to share its member evaluation document for these two program years, which highlights hospital performance on average 30-day risk-adjusted, price-standardized total episode payments for the included conditions across both program years.

The PY 2022-2023 program cycle utilized episode claims from 2019 through 2022. PY 2022 scoring compared performance year data from 2021 against baseline year data from 2019. PY 2023 scoring compared performance year data from 2022 against baseline year data from 2020.

Hospitals chose two conditions from seven available options for the PY 2022-2023 program cycle, including chronic obstructive pulmonary disease (COPD), coronary artery bypass graft (CABG), congestive heart failure (CHF), colectomy (non-cancer), joint replacement (hip and knee), spine surgery, and pneumonia. Among these seven P4P conditions, joint replacement was the most selected condition (40), and colectomy was selected the least (4). Trends in average price-standardized episode payments showed a consistent decrease over the years for CABG and joint replacement, and a recent downward trend for pneumonia, spine, and colectomy payments as seen in Figure 1. MVC observed relatively consistent average payments over time for CHF and COPD episodes during PY 2022-2023.

Figure 1. Average Price-Standardized Episode Payment Trends for P4P Conditions

The most striking observation in PYs 2022 and 2023 is the increasing shift to the outpatient setting for both spine and joint replacement surgeries. For joint replacement surgeries, 23.2% of episodes took place outpatient in 2019, 49.4% were outpatient in 2020, 71.6% were outpatient in 2021, and 85.4% were outpatient in 2022. Similar shifts were observed for spine surgeries during the PY 2022-2023 cycle, with the percent of outpatient spine surgery procedures increasing from 30.4% in 2019 to 51.4% in 2022 as seen in Figure 2.

Figure 2. Utilization of Outpatient Setting for Spine Surgery by Year

This shift in outpatient utilization also impacted the decrease in average total episode payments since the associated costs for outpatient surgeries were significantly lower than inpatient surgeries. The decrease in total episode payments for spine and joint replacement surgeries was largely reflected in the index payments for PYs 2022 and 2023 respectively (Figures 3 and 4).

Figure 3. Change in Average Price-Standardized Episode Components, PY 2022

Figure 4. Change in Average Price-Standardized Episode Components, PY 2023

Overall, there was not much change between PY 2022 and PY 2023 in the overall points earned and average points based on hospital characteristics, though the scores on average were slightly higher in PY 2022 (Figures 5 and 6).  For detailed, condition-specific analyses on scoring, please refer to the full member evaluation document.

Figure 5. PY 2022 Total Point Distribution (Includes Bonus Points)

Figure 6. PY 2023 Total Point Distribution (Includes Bonus Points)

If you have any questions regarding the MVC Component of the BCBSM P4P Program, please reference the P4P Technical Document for Program Years 2022 and 2023 and the MVC P4P FAQ PY 2022-2023. If you would like to set up a meeting to review your hospital’s performance, please contact the Coordinating Center at Michigan-Value-Collaborative@med.umich.edu.


0
View Post
MVC 2024 Spring Collaborative-Wide Meeting Summary: Promoting Care Coordination Across the Continuum

MVC 2024 Spring Collaborative-Wide Meeting Summary: Promoting Care Coordination Across the Continuum

The Michigan Value Collaborative (MVC) held its spring 2024 collaborative-wide meeting on Friday, May 10, in Midland. A total of 114 attendees representing 69 hospitals, 10 physician organizations, 4 Collaborative Quality Initiatives (CQIs), and 10 healthcare systems from across the state of Michigan came together to discuss new strategies for coordinating care across the continuum. The theme of this meeting was chosen in response to questions echoed by many attendees at the fall 2023 meeting about how to improve care coordination for our patients and families. Looking to the success stories of members and other stakeholders across the state, the MVC Coordinating Center recognized care coordination as a key strategy to high-value healthcare delivery.

MVC Director Hari Nathan, MD, PhD, kicked off Friday’s meeting with an update from the MVC Coordinating Center (see slides). He welcomed MVC’s newest team members - Site Engagement Coordinator Emily Bair and Senior Advisor Nora Becker – and expressed recognition and gratitude for Mike Thompson’s contributions as MVC’s Co-Director as he transitions to the role of senior advisor. Additionally, Dr. Nathan highlighted the successes delivered by the Coordinating Center since October’s collaborative-wide meeting, including co-hosting the Michigan Cardiac Rehab network (MiCR) meeting and launching a preoperative testing trial. MVC’s new multi-payer cardiac rehab registry reports were also introduced. Dr. Nathan then provided an overview of MVC’s refreshed strategic framework, which will serve to guide the Coordinating Center’s strategic direction over the coming years. Key components of MVC’s refreshed framework (Figure 1) include augmenting existing data to enhance and enrich MVC data sources, methods, and outputs; extending membership reach to broaden MVC’s membership base and refresh engagement approaches; and emphasizing equity to increase focus on health equity and social risk to improve the health of all groups.

Figure 1.

Following the MVC’s updates, Dr. Nathan introduced Kim Fox, MPH, Senior Data Analyst with MVC, who led a presentation on exploring organizational and system-level insights through MVC custom analytics (see slides). In collaboration with McLaren Macomb, the session highlighted MVC’s custom analytic process, the value and impact of customized reports (Figure 2), and findings from a recent report prepared for McLaren Macomb.

Figure 2.

Ms. Fox detailed how this recent custom report investigated total episode payments, post-discharge care utilization, and specialist participation for patients admitted for a congestive heart failure (CHF) or chronic obstructive pulmonary disease (COPD) event. After a detailed walk-through of the report components, focusing on patients with CHF, Ms. Fox introduced Beth Wendt, DO, Vice President of Clinical Operations and Medical Director of Quality and Accreditation at McLaren Macomb, who shared how McLaren Macomb has leveraged it’s custom MVC report to inform quality improvement efforts for their patients (Figure 3).

Figure 3.

After Dr. Wendt’s presentation, Ms. Fox shared unblinded data from MVC hospitals for timing of first home health visit by patients following a CHF-related admission. If you are interested in a custom analytic report, please reach out to the MVC Coordinating Center to schedule a kick-off meeting.

Following the MVC data presentation, an MVC member presentation was delivered by Steven Frazier, BA, RN, ACM, RN, Director of Quality and Patient Safety, Post-Acute Care with MyMichigan Health, and Allison Klimaszewski, RN, BSN, Nursing Supervisor at the Continuing Care Clinic Midland with MyMichigan Medical Group. They detailed how MyMichigan Health has implemented a continuing care clinic model (Figure 4) to support patients struggling to access primary care services in receiving post-discharge follow-up care after a hospitalization (see slides). Mr. Frazier and Ms. Klimaszewski shared that, while data is limited, the Continuing Care Clinic is making a difference for their patients. Patients receiving transition support care through the Continuing Care Clinic are showing lower all-cause readmission rates, pneumonia mortality rates are decreasing, and feedback is positive.

Figure 4.

Following MyMichigan Health’s presentation, attendees were invited to participate in a poster session, featuring quality improvement initiatives from MVC hospital and physician organization members. The MVC Coordinating Center would like to thank all poster presenters for sharing their work. Electronic copies of the posters are available here: Posters 1-6, Posters 7-13.

After a networking lunch, attendees reconvened for roundtable discussions. During the session, attendees visited five tables of their choosing, where they learned about the work of the roundtable speaker, asked questions, and discussed the table topic with their peers. The MVC Coordinating Center would like to thank its roundtable presenters (Figure 5) for sharing their work and expertise.

Figure 5.

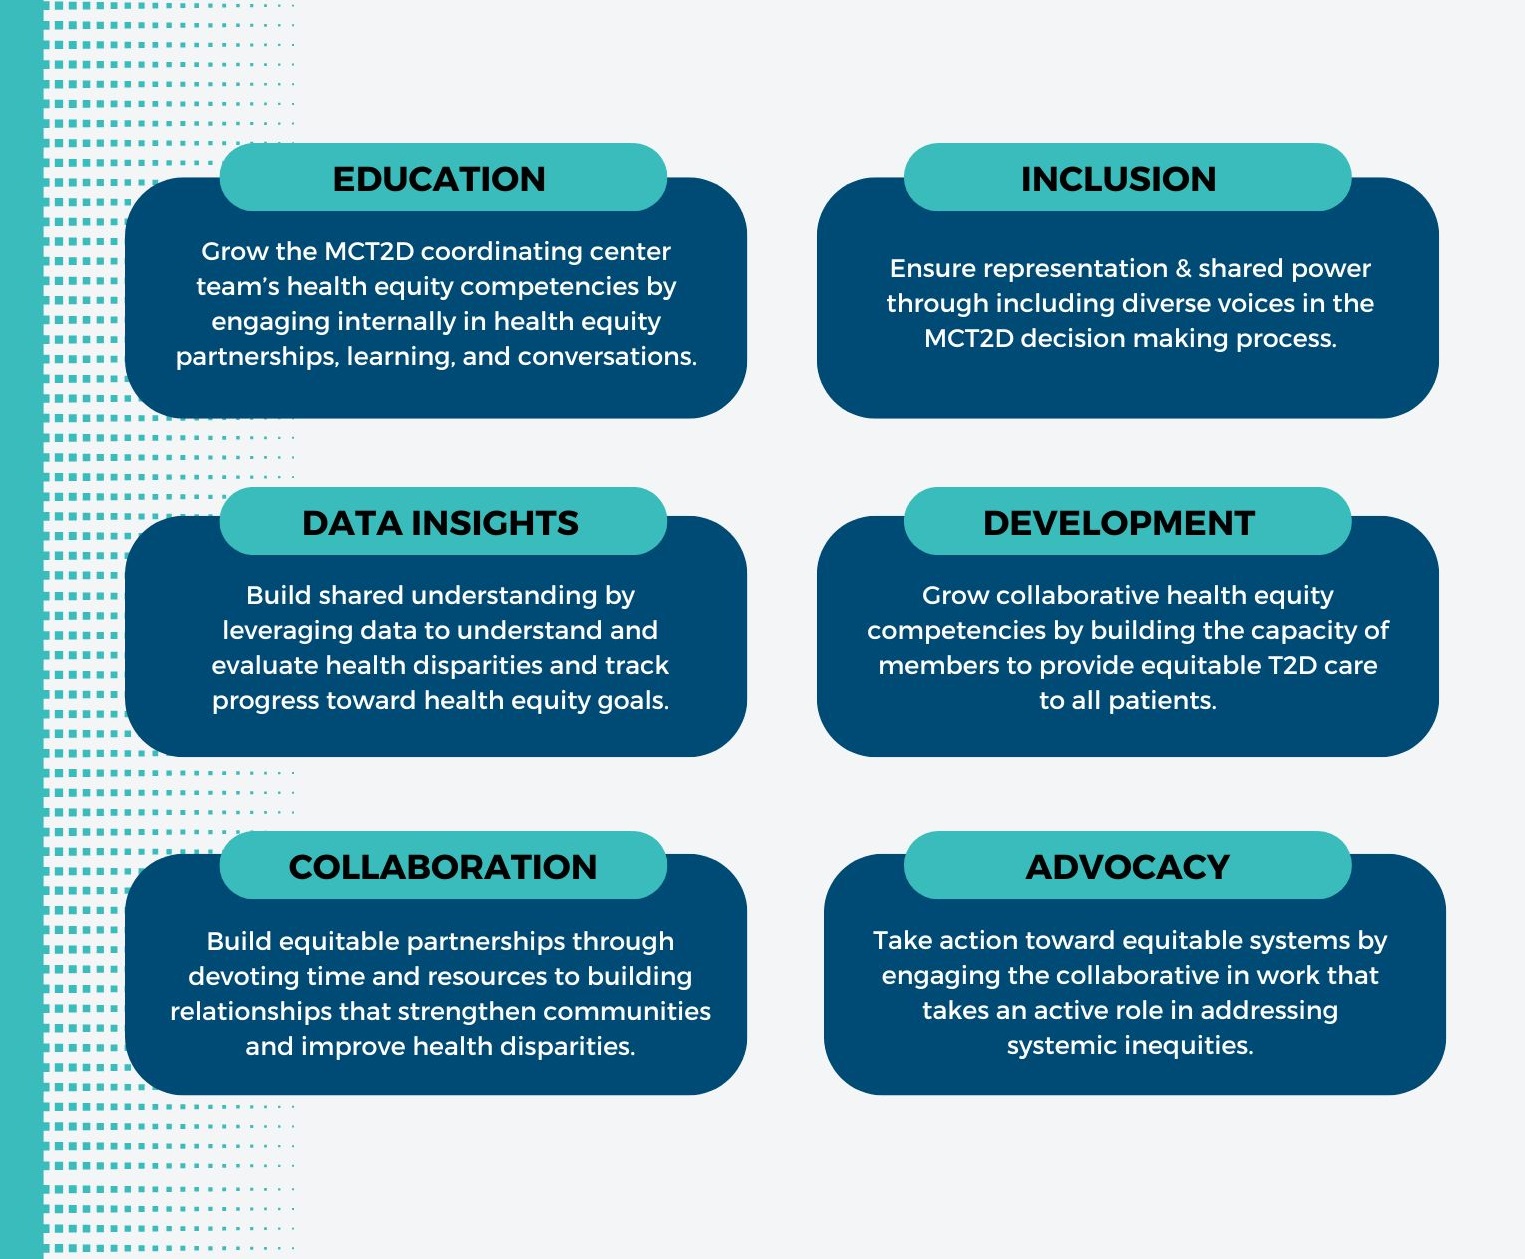
Following the roundtable discussions, Jana Stewart, MS, MPH, Project Manager with MVC, presented results from MVC’s recent health equity member survey (see slides). After discussing the survey’s goals, use cases, and overarching questions, Ms. Stewart provided a high-level snapshot of the results, including the most common initiatives to reduce patient access challenges, common demographics of focus, the top barriers preventing hospitals from developing and implementing health equity initiatives, and the most common data sources hospitals are using to identify or measure patient health disparities. Ms. Stewart also shared MVC’s equity strategy (Figure 6), detailing how MVC will support members in the health equity space.

Figure 6.

To close out the meeting, MVC Co-Director Mike Thompson, PhD, MPH, provided a review of Program Year (PY) 2023 of the MVC Component of the BCBSM P4P Program (see slides). After reviewing the program components, Dr. Thompson provided a summary of PY23 performance across the collaborative. It was also noted that PY 2024 mid-year scorecards will be distributed in the summer and current scores can be access by members on the MVC registry. If you or members of your team would like access to MVC’s registry, please contact the MVC Coordinating Center.

If you have questions about any of the topics discussed at MVC’s spring collaborative-wide meeting or are interested in following up for more details, contact the MVC Coordinating Center. MVC’s next collaborative-wide meeting will be in person on Friday, October 25, 2024, in Livonia.

0
View Post
Hospitals Receive New Push Reports on MVC’s P4P Episode Spending and Value Metrics

Hospitals Receive New Push Reports on MVC’s P4P Episode Spending and Value Metrics

The Michigan Value Collaborative (MVC) Coordinating Center distributed a new report earlier this month focused on Program Years (PYs) 2024 and 2025 for the MVC Component of the Blue Cross Blue Shield of Michigan (BCBSM) Pay-for-Performance (P4P) Program. PYs 2024 and 2025 retained the episode spending component of the program but incorporated MVC’s value metrics – specific process measures of utilization that are evidence-based, actionable, and show variability across the state. This report, therefore, highlighted data for each hospital’s specific PY 24-25 episode spending and value metric selections. We hope that these reports will be utilized to inform quality improvement efforts by identifying areas of opportunity for episode spending conditions or value-based practices.

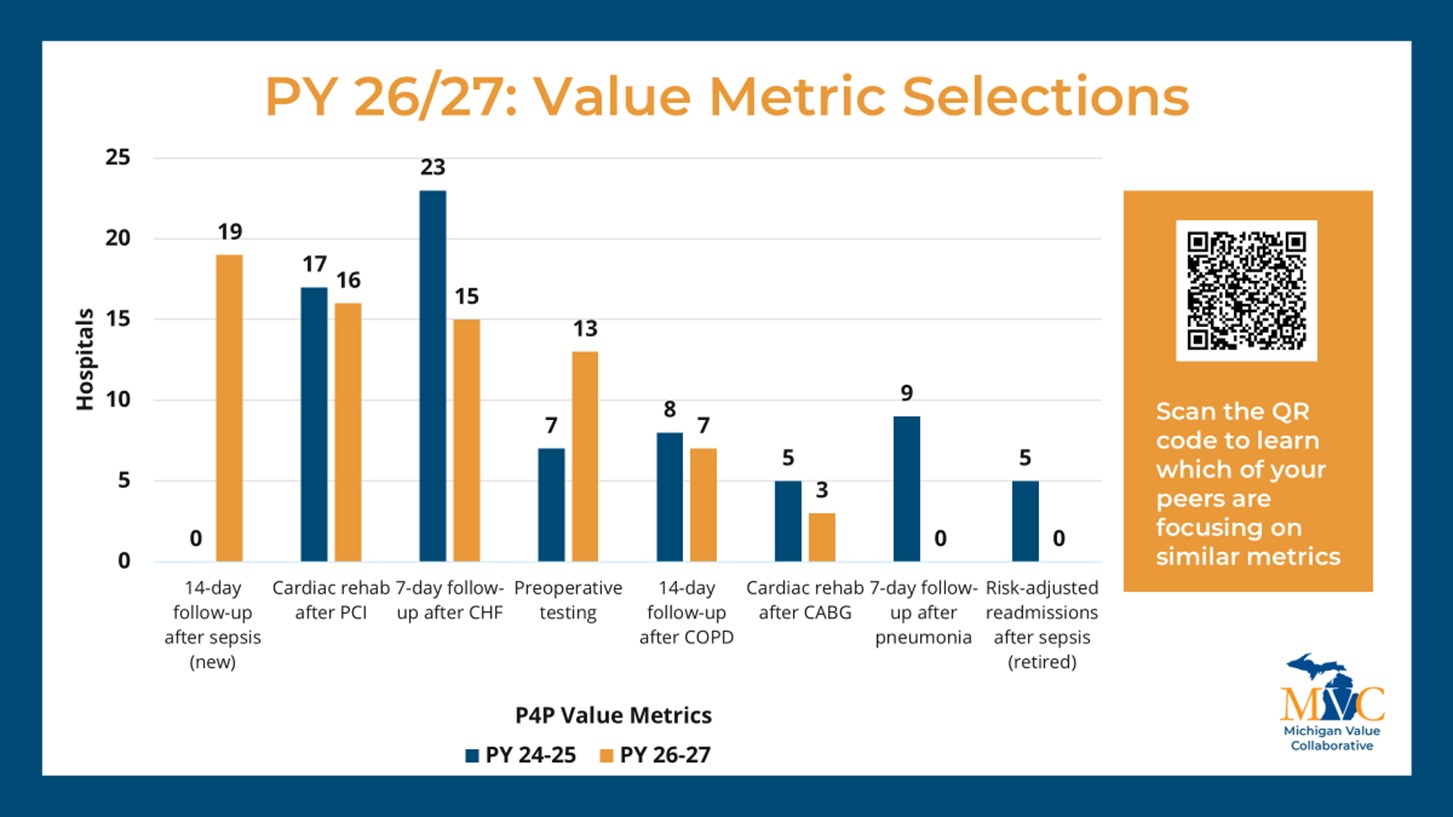
Hospitals selected chronic obstructive pulmonary disease (COPD), colectomy (non-cancer), congestive heart failure (CHF), coronary artery bypass grafting (CABG), joint replacement, or pneumonia for their episode spending scoring. Seven value metrics were available to choose from, including cardiac rehabilitation after CABG, cardiac rehabilitation after percutaneous coronary intervention (PCI), seven-day follow-up after CHF, 14-day follow-up after COPD, seven-day follow-up after pneumonia, preoperative testing, and risk-adjusted readmission after sepsis. With the exception of the trend figure on the report’s value metric page (which has a data range of 1/1/2020 – 12/31/2022), the data in this report reflected baseline year data (2021) for PY 2024. Any impact to utilization or patient outcomes achieved by hospitals this year will contribute to their performance year data for PY 2025.

The first data page focused on a hospital’s episode spending selection, and provided a caterpillar plot (Figure 1) for price-standardized and risk-adjusted total episode payments for that hospital compared to other MVC hospitals as well as the MVC collaborative-wide average and that hospital’s P4P cohort average. P4P cohorts were determined based on hospital bed size, case mix index, and critical access status.

Figure 1.

The report also included episode spending figures focused on price-standardized, risk-adjusted payments for major episode components (index, professional, readmission, and post-discharge) as well as post-discharge payment components (emergency department, home health, skilled nursing facility, inpatient and outpatient rehab, and outpatient services). These two figures (Figure 2 and 3) could be used to identify the components contributing most significantly towards a hospital’s total episode payment.

Figure 2.

Figure 3.

The second data page provided information about a hospital’s value metric selection. The first figure was a caterpillar plot (Figure 4) displaying that hospital’s value metric rate compared to other MVC hospitals as well as the MVC collaborative-wide average and that hospital’s P4P cohort average.

Figure 4.

The value metric page also included a trend graph detailing a hospital’s value metric rate by six-month interval, and a final figure that varied by hospital to provide additional metric-specific insights. Hospitals being scored on cardiac rehab after CABG or PCI received a caterpillar plot of average days to the first cardiac rehab visit among cardiac rehab utilizers. Hospitals being scored on follow-up after CHF, COPD, or pneumonia received a bar chart of follow-up rates by setting (in-person only, remote only, or both in-person and remote). Hospitals being scored on preoperative testing will see a bar chart of preoperative testing rates by test type. Lastly, hospitals being scored on 30-day readmissions after sepsis received a table of the most common reasons for readmission after the initial sepsis episode’s discharge.

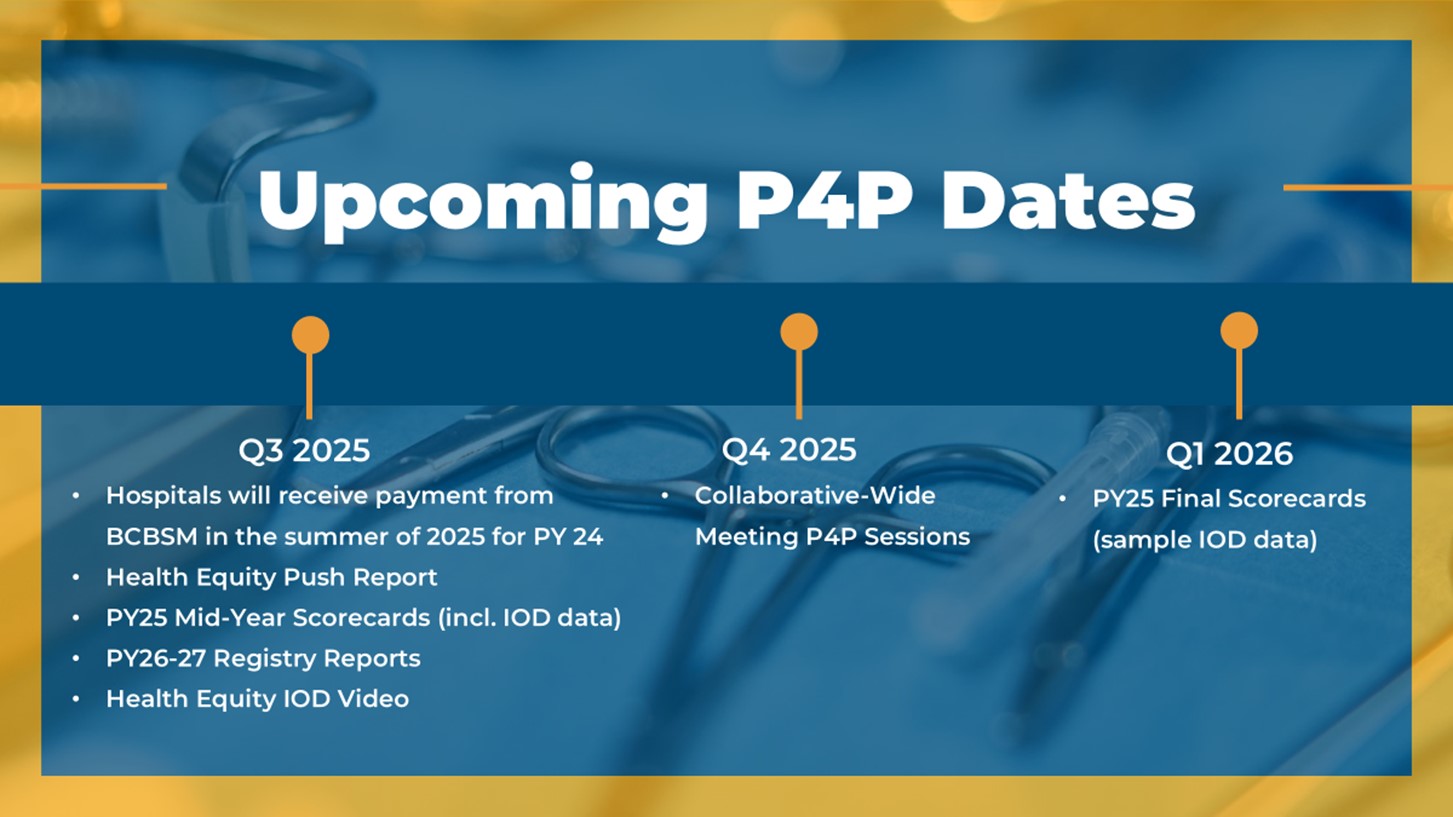
For more information about your hospital’s episode spending and value metric selections and data, as well as other conditions and value metrics not selected, hospitals can utilize the PY 2024-2025 reports on the MVC Registry. PYs 2024 and 2025 also introduced a new engagement component, awarding 2 out of the 10 program year points for completed engagement activities. Please see the following event list and calendar for 2024 engagement opportunities, which will contribute to a hospital’s PY 2024 score.

If you have any questions regarding the MVC Component of the BCBSM P4P Program, please reference the P4P Technical Document for Program Years 2024 and 2025. If you would like to set up a meeting to review your hospital’s performance, please contact the Coordinating Center at Michigan-Value-Collaborative@med.umich.edu.

0
View Post
MVC Welcomes Emily Bair, MS, MPH, RDN as Site Engagement Coordinator

MVC Welcomes Emily Bair, MS, MPH, RDN as Site Engagement Coordinator

I’m excited to be joining the Michigan Value Collaborative (MVC) as a Site Engagement Coordinator. As a new member of MVC, I am looking forward to learning and working alongside this talented team of forward-thinking coordinators, administrators and analysts in their efforts to improve the health of Michigan through accessible, high-value healthcare.

Throughout my training I have always been fascinated by the intersection of physical and social sciences. Specifically, how healthcare and medical practices are influenced by social constructs such as race, education and economic stability. I was first introduced to this during my undergraduate education when I pursued a Bachelor of Arts in Anthropology & Biology at Kalamazoo College. I then continued in this vein of study earning a Master of Science in Biomedical Anthropology at SUNY Binghamton University and then a Master of Public Health (MPH) in Nutrition Sciences at the University of Michigan School of Public Health.

Following this portion of my educational journey, I decided to additionally train to become a registered dietitian and was honored in being selected for a Michigan Leadership Education in Neurodevelopmental and Related Disabilities (MI-LEND) fellowship. Through these experiences I developed a greater understanding of the barriers to accessing healthcare for specific populations, namely women, children and the disabled, as well as a passion for educating both patients and providers in these issues.

For the last 5 years I have practiced as a clinical registered dietitian specializing in pediatric gastrointestinal disorders, surgical recovery, and developmental disabilities. I’ve also engaged with projects spanning simulated medical education, hospital volunteer program development, and clinical research writing. This collection of experiences has provided me with a unique lens through which to observe and drive future healthcare efforts.

As Site Engagement Coordinator, I look forward to working with MVC and its members to continue to identify equitable health practices and opportunities for improved health outcomes. If you have any questions or wish to get in touch, please feel free to email me at baire@med.umich.edu.

0
View Post
Health Equity in Action: Using Data to Drive Systematic Change

Health Equity in Action: Using Data to Drive Systematic Change

In the United States, disproportionate rates of chronic disease and illness are commonly documented among communities of color. National Minority Health Month (NMHM) takes place throughout April as a way to raise awareness about health disparities among minority groups and how racism and barriers to healthcare access have historically marginalized such groups. According to the CDC, health equity is “the state in which every individual has a fair and just opportunity to attain their highest level of health.” To achieve such a state, extensive efforts are necessary to address systematic injustices and support equitable access to healthcare.

At MVC, emphasizing this vast issue and supporting change begins with one critical step: identifying and quantifying current disparities within patient communities in Michigan. MVC is utilizing claims-based data analytics to identify differences in care for specific patient demographic groups. For instance, in a recent analysis of MVC claims, MVC found differences by race in the rates of patients attending cardiac rehabilitation after a coronary artery bypass graft (CABG), with lower average utilization rates among some minority groups compared to patients who are white and higher average utilization rates among other minority groups (Figure 1). There are also significant disparities in cardiac rehabilitation utilization rates after CABG by gender and payer categories. Highlighting the landscape of current healthcare utilization may help quality improvement teams understand where disparities exist within their patient populations and prompt discussions about the social and environmental circumstances that may contribute to such findings.

Figure 1.

MVC also recently collected surveys from its members on their health equity priorities, challenges, and initiatives to date. The survey results will be summarized at MVC’s upcoming spring collaborative-wide meeting, and some of the survey responses will be further expanded upon and shared with members as blogs and case studies to provide real-world examples of the work happening in hospitals across the state. Since health equity is a strategic priority for many healthcare teams, MVC’s recent survey was developed to help members understand what others are doing and facilitate shared learning on this topic.

However, there is also much to learn from national examples and strategies. In December 2022, for example, Blue Cross Blue Shield of Massachusetts announced the creation of payment contracts that provide financial rewards to practices addressing racial and ethnic inequities in healthcare delivery. Dr. Mark Friedberg, Senior Vice President, Performance Measurement and Improvement at Blue Cross explained, “This encourages health care systems to increase their investments in developing, expanding and sustaining programs that produce measurable improvements in equity.” This financial investment is a huge breakthrough for Blue Cross which will allow healthcare providers and organizations to learn what barriers to care exist and methods of resolution.

Financial incentives focused on equity are also a large component of State Medicaid strategies. In California, Medicaid plans could earn incentive funds by demonstrating improvement in the two race/ethnicity groups with the lowest baseline vaccination rates. In Michigan, there are financial incentives for using withheld funds for improvement on a subset of quality measures within the African American and Hispanic population groups. As more states and systems begin to invest in financial incentives with equity goals, MVC is working to re-evaluate the methodologies and metrics of the MVC Component of the BCBSM Pay-for-Performance (P4P) Program for opportunities to similarly incentivize and reward achievement and/or improvement in equitable care delivery.

As health equity activity continues to grow and evolve, MVC is committed to expanding its data sources and reporting to support members' understanding of the needs of their patients. Studies emphasize that disparate health outcomes are closely related to social determinants/influencers of health (SDOH/SIOH), with social factors often predicting the incidence of illness and disease. It is for this reason that MVC has continued to incorporate Distressed Communities Index (DCI) data into patient demographic tables in MVC push reports, in addition to stratifying select outcome measures by relevant demographic categories. MVC continues to explore opportunities to integrate additional supplemental SDOH data sets into its analyses – a recent example was shared at MVC’s October collaborative-wide meeting presentation (see slides), which focused on the relationship between county-level social need indicators and post-discharge care utilization.

Organizational strategies and investments are rapidly growing and evolving within healthcare, and will likely be necessary for years to achieve meaningful improvements. MVC is eager to support member activity in this space to achieve high-value care for all and will continue to highlight the excellent work and success stories happening across its membership. If you have a success story to share or would like to request a custom analysis focused on a specific patient population, please contact the MVC Coordinating Center.

0
View Post
MVC Coordinating Center Releases 2023 Annual Report

MVC Coordinating Center Releases 2023 Annual Report

The Coordinating Center published its 2023 annual report to the MVC website recently. It outlines key successes and activities accomplished last year and the new strategy guiding MVC's 2024 efforts. Read the report below or view the PDF Parts A [LINK] and B [LINK]) now.

0
View Post
MVC Component of the BCBSM P4P Program: PY23 in Review

MVC Component of the BCBSM P4P Program: PY23 in Review

This month the Michigan Value Collaborative (MVC) Coordinating Center distributed the final scorecards for Program Year (PY) 2023 of the MVC Component of the Blue Cross Blue Shield of Michigan (BCBSM) Pay-for-Performance (P4P) Program. The 2023 program year was the second year of a two-year cycle for which hospitals were evaluated using MVC data. Hospitals were scored on two conditions that they selected from seven options: chronic obstructive pulmonary disease (COPD), colectomy, congestive heart failure (CHF), coronary artery bypass graft (CABG), joint replacement, pneumonia, and spine surgery. Figure one shows the frequency of hospital condition selections for the two-year program cycle. Joint replacement was the most commonly selected condition, and colectomy was selected the least.

Figure 1. Distribution of Hospital Condition Selections for PY 2023

The MVC Component of the BCBSM P4P Program evaluates each participating hospital’s risk-adjusted, price-standardized, average 30-day episode payments for their two selected conditions through two methods. Hospitals can earn points by reducing their payments from the baseline period (which included index admissions in 2020) to the performance period (which included index admissions in 2022). These are termed “improvement points.” Alternatively, hospitals can earn points by being less expensive than the other hospitals in their cohort. These are referred to as “achievement points.” The MVC cohorts are groups of hospitals determined to be peers using bed size and case mix index.

While participants are scored on both improvement and achievement, members receive the higher of the two scores for each condition. Hospitals were also eligible to receive a bonus point for each condition by completing a questionnaire designed to inform MVC of member hospital quality improvement practices. While 12 points were available, a maximum of 10 points were awarded to participating members. Figure 2 shows the distribution of total points earned by hospitals for the 2023 program year.

Figure 2. Distribution of Total P4P Scores for PY 2023

On average hospitals earned 7.4 points total, a decrease of 0.3 points from PY 2022’s average of 7.7 points. The majority (90.7%) of hospitals earned at least one of the two possible bonus points. As shown in Figure 3, the condition with the highest average point total was joint replacement (4.5 points) followed by spine surgery (4.3 points).

Figure 3. Average Points by Condition

If you have any questions regarding the MVC Component of the BCBSM P4P Program, please reference the P4P Technical Document for Program Years 2022 and 2023 and the MVC P4P FAQ PY 2022-2023. If you would like to set up a meeting to review your hospital’s performance, please contact the Coordinating Center at Michigan-Value-Collaborative@med.umich.edu.  The Coordinating Center will evaluate and release mid-year scorecards for PY 2024 in the summer of 2024.

0
View Post
Post-Discharge Workgroup Highlights Systems Approach to Caring for Multiple-Visit Patients

Post-Discharge Workgroup Highlights Systems Approach to Caring for Multiple-Visit Patients

This month MVC hosted its first post-discharge follow-up workgroup presentation of the year, which featured a presentation by guest speaker Lisa Powell, MBA, PTA, Clinical Director of Operations of Sparrow Hospital. She shared insights from a recent Sparrow Hospital project launched to reduce readmissions and acute care utilization.

The project came about when E.W. Sparrow Hospital identified that readmissions were a key driver of capacity limitations in the acute care setting and that Sparrow was underperforming compared to peers. After observing high readmission rates for their facility, Sparrow investigated utilization by asking questions about the social determinants of health impacting the patient population and looking into specific identity metrics.

Figure 1.

As part of Sparrow’s investigation, they drilled down on specific patient cases for context, discovering 35 discrete patients in 2021 who accounted for a total of 434 admissions and 2,088 acute care days. This unique subset of patients was defined by the Sparrow team as multiple-visit patients (MVPs)—those with 10 or more combined inpatient and observation admissions over the past 12 months. The data available on MVPs exemplified a disconnect in the delivery, management, and transition of care, and a need for a care plan that could be implemented the next time an MVP patient presented to the emergency department. The resulting plan was designed to transition away from episodic care, close the primary care gap to improve care in the right setting, and remove barriers to accessing specialty care, all within Sparrow's resource and time constraints.

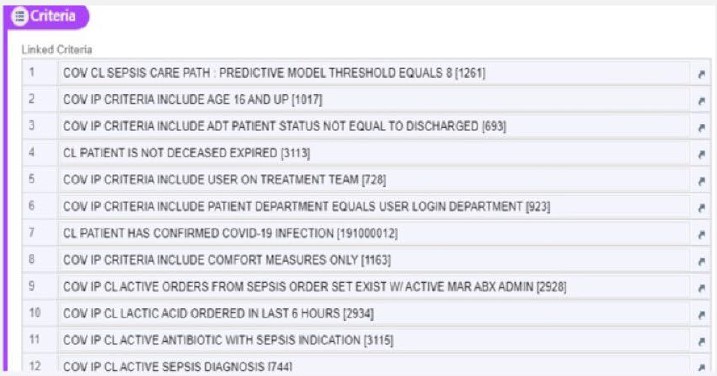
Focusing on one patient at a time, the physicians and care team members were tasked to work offline on their own time to articulate a brief care plan and synopsis of the patient from their respective disciplines. The providers later came together at one-hour multidisciplinary virtual meetings to discuss each patient and achieve consensus on their proposed plan. Once a plan was established and agreed upon, the team distributed the information to hospital staff utilizing layered EMR tools such as FYI flags, specialized note types for MVP care plans, and best practice advisories (BPA).

After receiving initial feedback and analyzing usage data, providers found certain EMR tools more effective than others. FYI flags were the least utilized tool and not effective on their own in changing clinical behavior, as they were often ignored. Implementing a specialized note type for MVP care plans, however, was extremely effective and user-friendly (Figure 2). Through this development, providers no longer needed to search through lengthy patient medical histories to locate their MVP care plan, increasing the likelihood that the care provided would be in line with the agreed upon multidisciplinary plan.

Figure 2.

Four months after Sparrow Hospital launched this EMR systems approach, they reduced acute care days as well as the number of patients who met the multi-visit patient definition of 10 or more admissions over 12 months (see Figures 3 and 4) with sustained improvement for over two years. Providers consistently provide positive feedback and Sparrow has continued to expand the scope and use of the approach.

Figure 3.

Figure 4.

Although over the past two years, readmission rates and the number of MVPs that frequent their hospital have decreased (Figure 5), the impact of this project expands far beyond improving hospital readmission rates and acute care utilization. Sparrow Hospital’s systems approach to MVPs keeps patients out of the hospital and improves their lives. Although no patient-reported outcomes data has been collected on this to date, Sparrow Hospital is confident that this approach is improving the quality of life for many patients.

Figure 5.

As the project continues to evolve, Sparrow Hospital hopes to expand the utilization of multidisciplinary care plans delivered through EMR tools, which are inherently designed for flexibility in use. The target population can be broadened, providers can escalate patients who may benefit from an MVP plan of care, and tools can be utilized for difficult transitions of care.

Sparrow’s systems-level approach to supporting MVPs in a hospital setting has shown great promise in care management and improvement, and the participants in last week’s workgroup were eager to share the success of this project with their sites and colleagues. Sparrow Hospital identified an area of poor performance and collaborated to design an initiative that addressed patient needs within established systems and resources. As we look toward the future of healthcare quality improvement, feasibility in implementation must be a high priority to achieve success.

MVC workgroups consist of a diverse group of representatives from Michigan hospitals and physician organizations that meet virtually to collaborate and share ideas. If you were unable to attend this workgroup, you can access the recording here. To register for upcoming workgroups, visit MVC’s 2024 events calendar. If your team has a successful initiative or project to share with the Collaborative, please reach out to MVC.