0
View Post
Refreshed Hospital-Level, ED-Based Episode Push Reports Coming Soon to Members

Refreshed Hospital-Level, ED-Based Episode Push Reports Coming Soon to Members

The MVC Coordinating Center will soon distribute refreshed hospital-level versions of its push report utilizing emergency department-based episodes (“ED-based episodes”). MVC generated separate versions for acute care hospitals and Critical Access Hospitals (CAHs) with tailored comparison groups. In addition to reflecting more recent data across all included payers, these refreshed hospital-level reports differ from prior versions due to the addition of three high-volume ED conditions and the incorporation of Michigan Medicaid claims.

Each page of the report is dedicated to a specific condition with the same metrics throughout, such as risk-adjusted, price-standardized 30-day total episode spending, inpatient admission rates, and rates of post-ED utilization. Reports feature each hospital’s own attributed ED-based episode data for eight high-volume ED conditions: abdominal pain, cellulitis, chest pain (nonspecific), congestive heart failure (CHF), chronic obstructive pulmonary disease (COPD), diabetes with long-term complications (including renal, eye, neurological, or circulatory), diabetes with short-term complications (including ketoacidosis, hyperosmolarity, or coma), and urinary tract infection (UTI). The three new conditions included in this year’s refresh include diabetes with long-term complications, diabetes with short-term complications, and UTI.

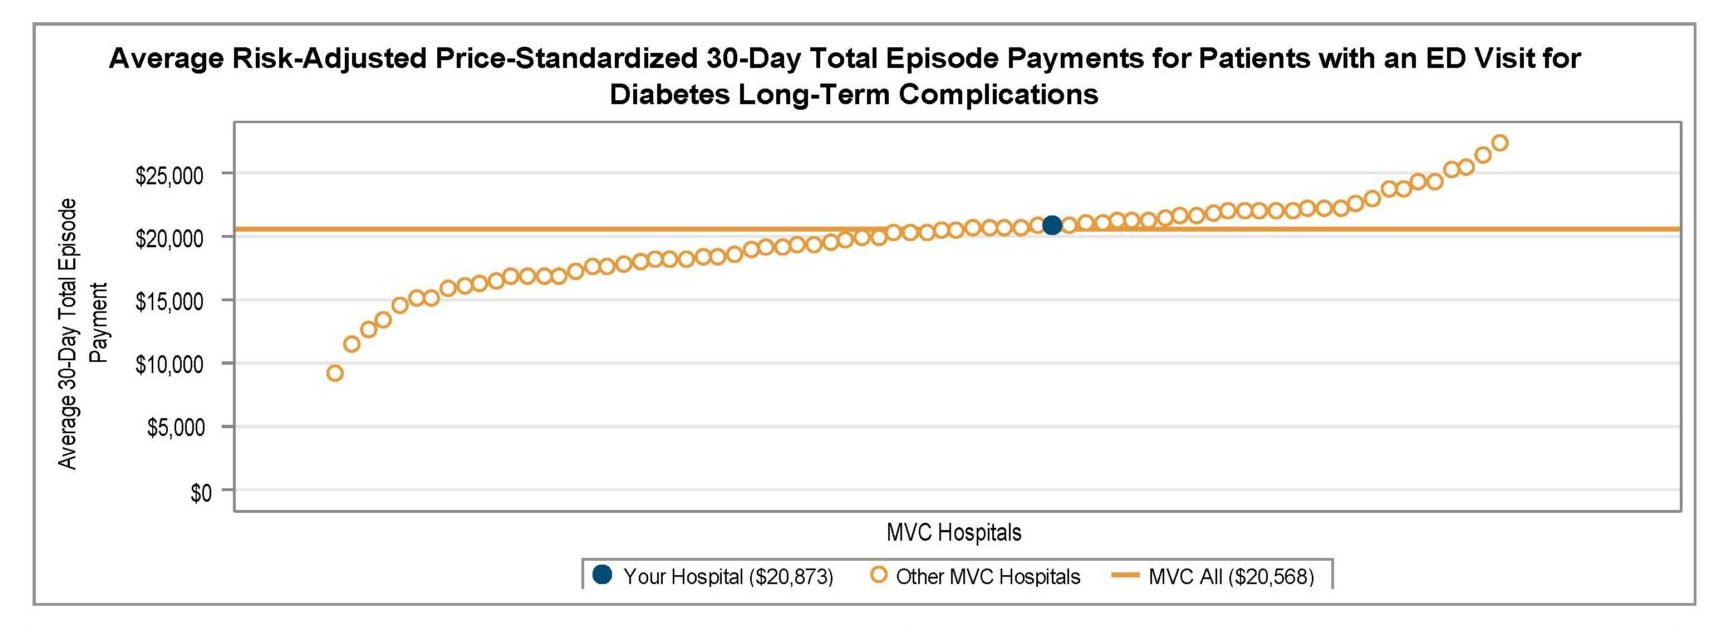
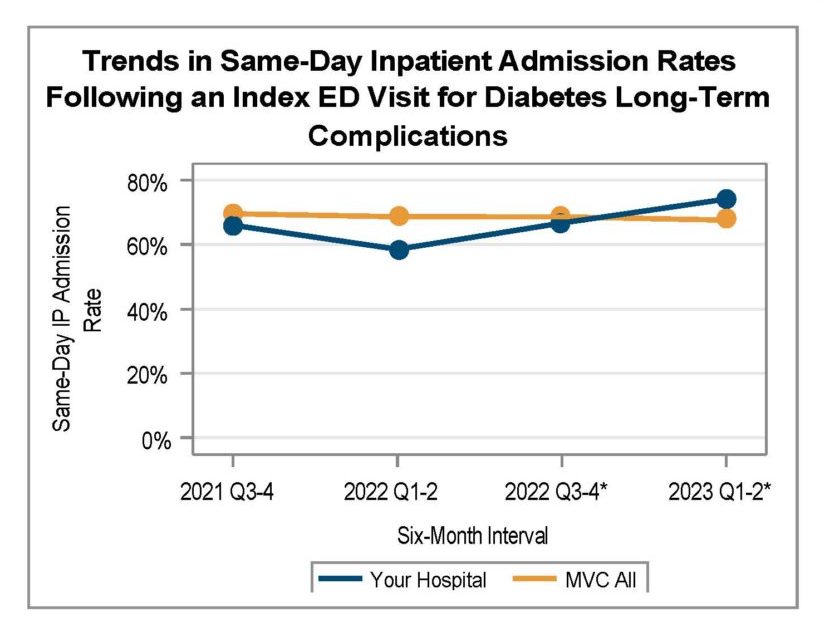
Among general acute care hospitals receiving a report, the average risk-adjusted, price-standardized 30-day total episode payment (Figure 1) for the reported conditions is highest for diabetes with long-term complications ($20,568), CHF ED-based episodes ($17,245), diabetes with short-term complications ($12,087), and COPD ED-based episodes ($10,289). The collaborative-wide average is lowest for chest pain ($3,111) and abdominal pain ($3,123) ED-based episodes. Within each condition, MVC 30-day total episode payments are consistently higher for episodes in which the patient had a same-day inpatient admission compared to episodes in which the patient did not have an inpatient stay beginning on the date of their ED visit. With that information in mind, hospital members can also use their individualized reports to track their same-day inpatient admission rate at six-month intervals using trend graphs for each included ED-based condition (Figure 2).

Figure 1.

Figure 2.

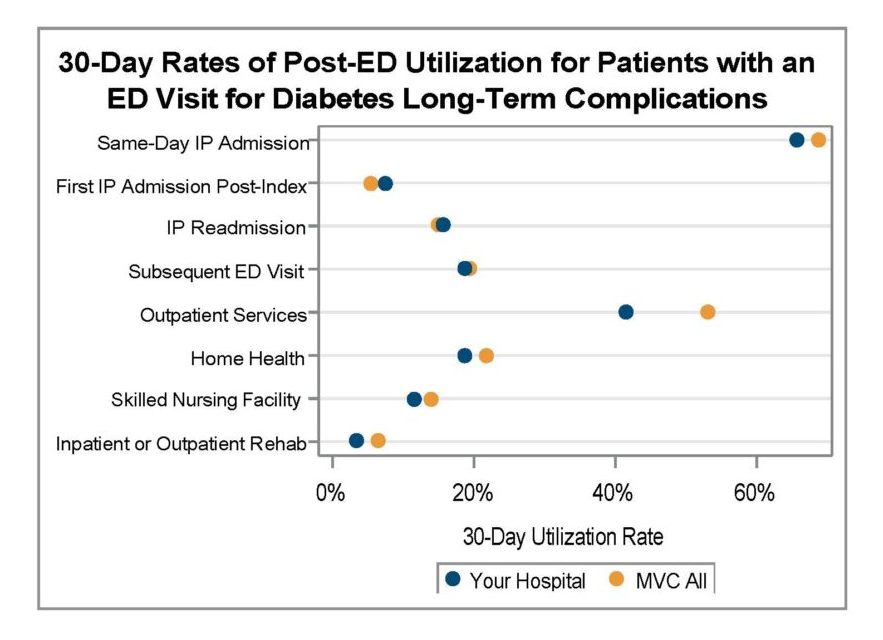
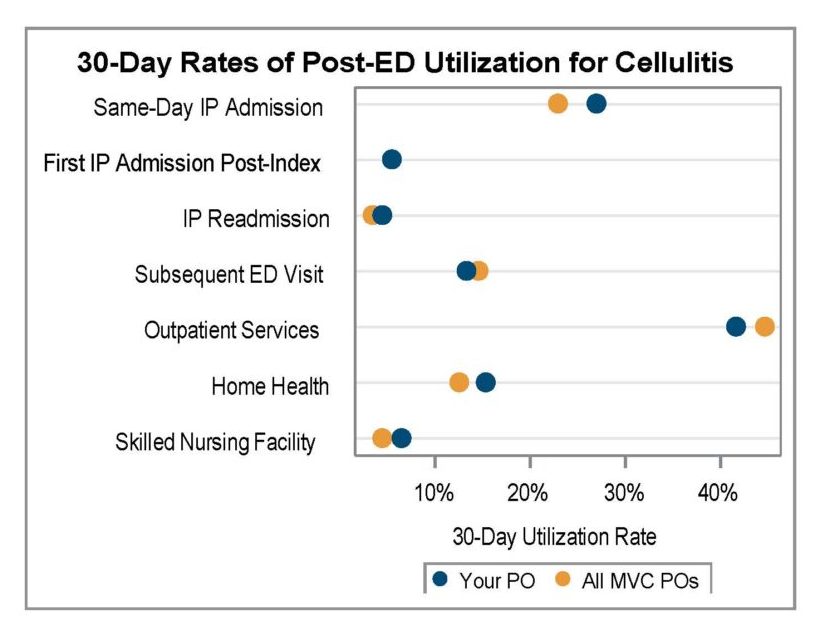
A key goal for these ED-based episode reports is to provide insight into healthcare utilization following index ED visits. Therefore, reports continue to include a dot plot (Figure 3) comparing patient post-ED utilization at a member hospital against their peer comparison group. Dot plots provide information on what percent of episodes had a same-day inpatient admission, what percent did not have a same-day inpatient admission but did see the patient admitted in the 1 to 30 days following the index ED visit, and the percent of patients who had two or more inpatient admissions (thus, at least one readmission) during the episode of care. Also provided are rates of subsequent ED visits, receipt of outpatient services, home health, skilled nursing facility care, and inpatient or outpatient rehab.

Figure 3.

These ED-based episodes are built using MVC’s most recent medical claims data from Medicare FFS, Blue Cross Blue Shield of Michigan PPO Commercial and Medicare Advantage plans, Blue Care Network HMO Commercial and Medicare Advantage plans, and Michigan Medicaid.

ED-based episodes utilize MVC’s newest episode of care data structure, which was developed last year in collaboration with the Michigan Emergency Department Improvement Collaborative (MEDIC), a BCBSM-funded Collaborative Quality Initiative with the goal of improving care and patient outcomes in Michigan emergency departments. MVC and MEDIC team members worked closely to develop 30-day episodes of care initialized by a patient’s visit to the ED and including all claims-documented care received in the 30 days following a patient’s index ED visit.

Please share your feedback with the MVC team if certain report measures are helpful or if you wish to see additional ED-based episode reporting for certain conditions and metrics. MVC is now also accepting custom report requests using its new ED-based data. Contact MVC to learn more.

0
View Post
Members to Receive Refreshed Preoperative Testing Reports

Members to Receive Refreshed Preoperative Testing Reports

MVC hospital members will soon receive their second preoperative testing push report of 2023, providing an opportunity to benchmark progress on reducing low-value testing rates within their facility. MVC first introduced its preoperative testing push reports in 2021 to support members in reducing this low-value practice. Ordering these tests before low-risk elective and outpatient procedures often provides no clinical benefits to patients but is ordered regularly at hospitals across Michigan.

Similar to the report distributed earlier this year, members will continue to see their rates across various tests for three elective and outpatient procedures: laparoscopic cholecystectomy, laparoscopic inguinal hernia repair, and lumpectomy. Claims were evaluated in the 30 days before the procedures for the following common tests: electrocardiogram (ECGs), echocardiogram, cardiac stress test, complete blood count, basic and comprehensive metabolic panel, coagulation studies, urinalysis, chest x-ray, and pulmonary function with index admissions from 1/1/2021 through 12/31/2022. This refreshed push report exclusively utilizes claims from the Blue Cross Blue Shield of Michigan (BCBSM) and Blue Care Network (BCN) plans. Members will receive reports if they have at least 11 index admissions in one of the three conditions and at least 20 admissions across all three conditions during the reporting period.

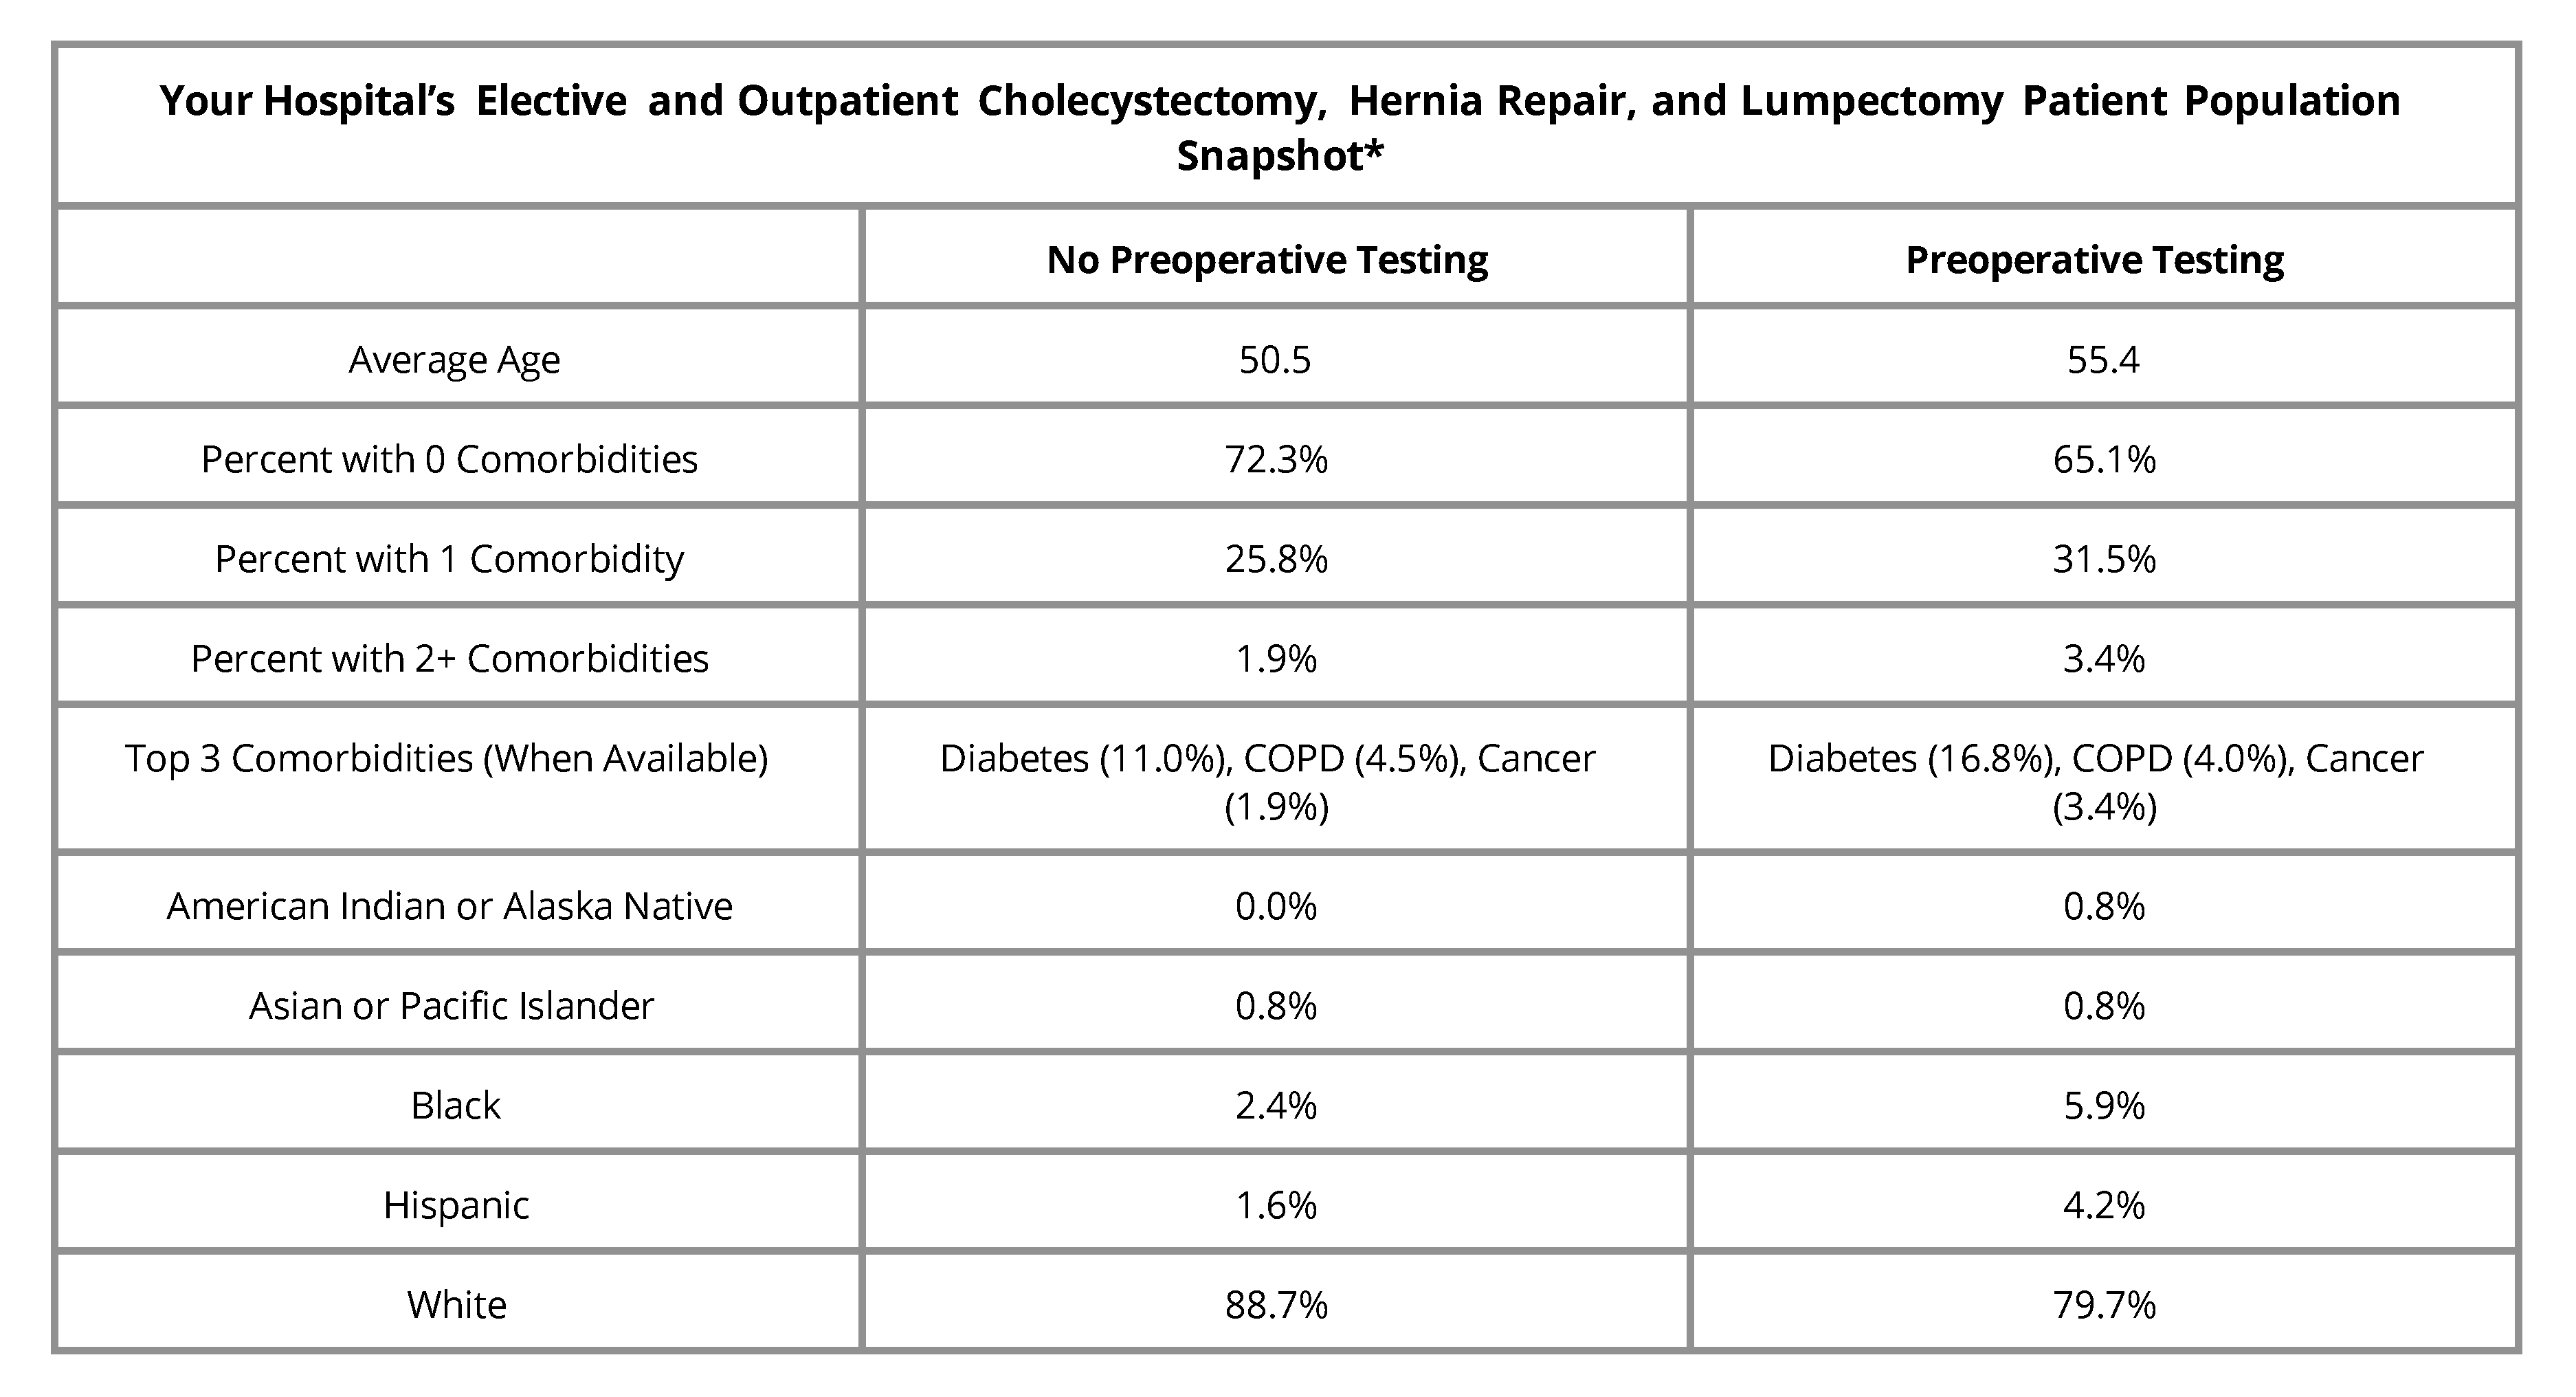
Like other MVC push reports, members will see a patient population snapshot table that identifies rates for preoperative testing and no preoperative testing in patients with varying demographic characteristics (Figure 1). Compared to the version received by hospitals this summer, the latest version of this report now also includes testing rates among patients who identified as Hispanic or American Indian/Alaska Native. On average, patients who had preoperative testing were older and had more than one comorbidity than patients who had no preoperative testing.

Figure 1.

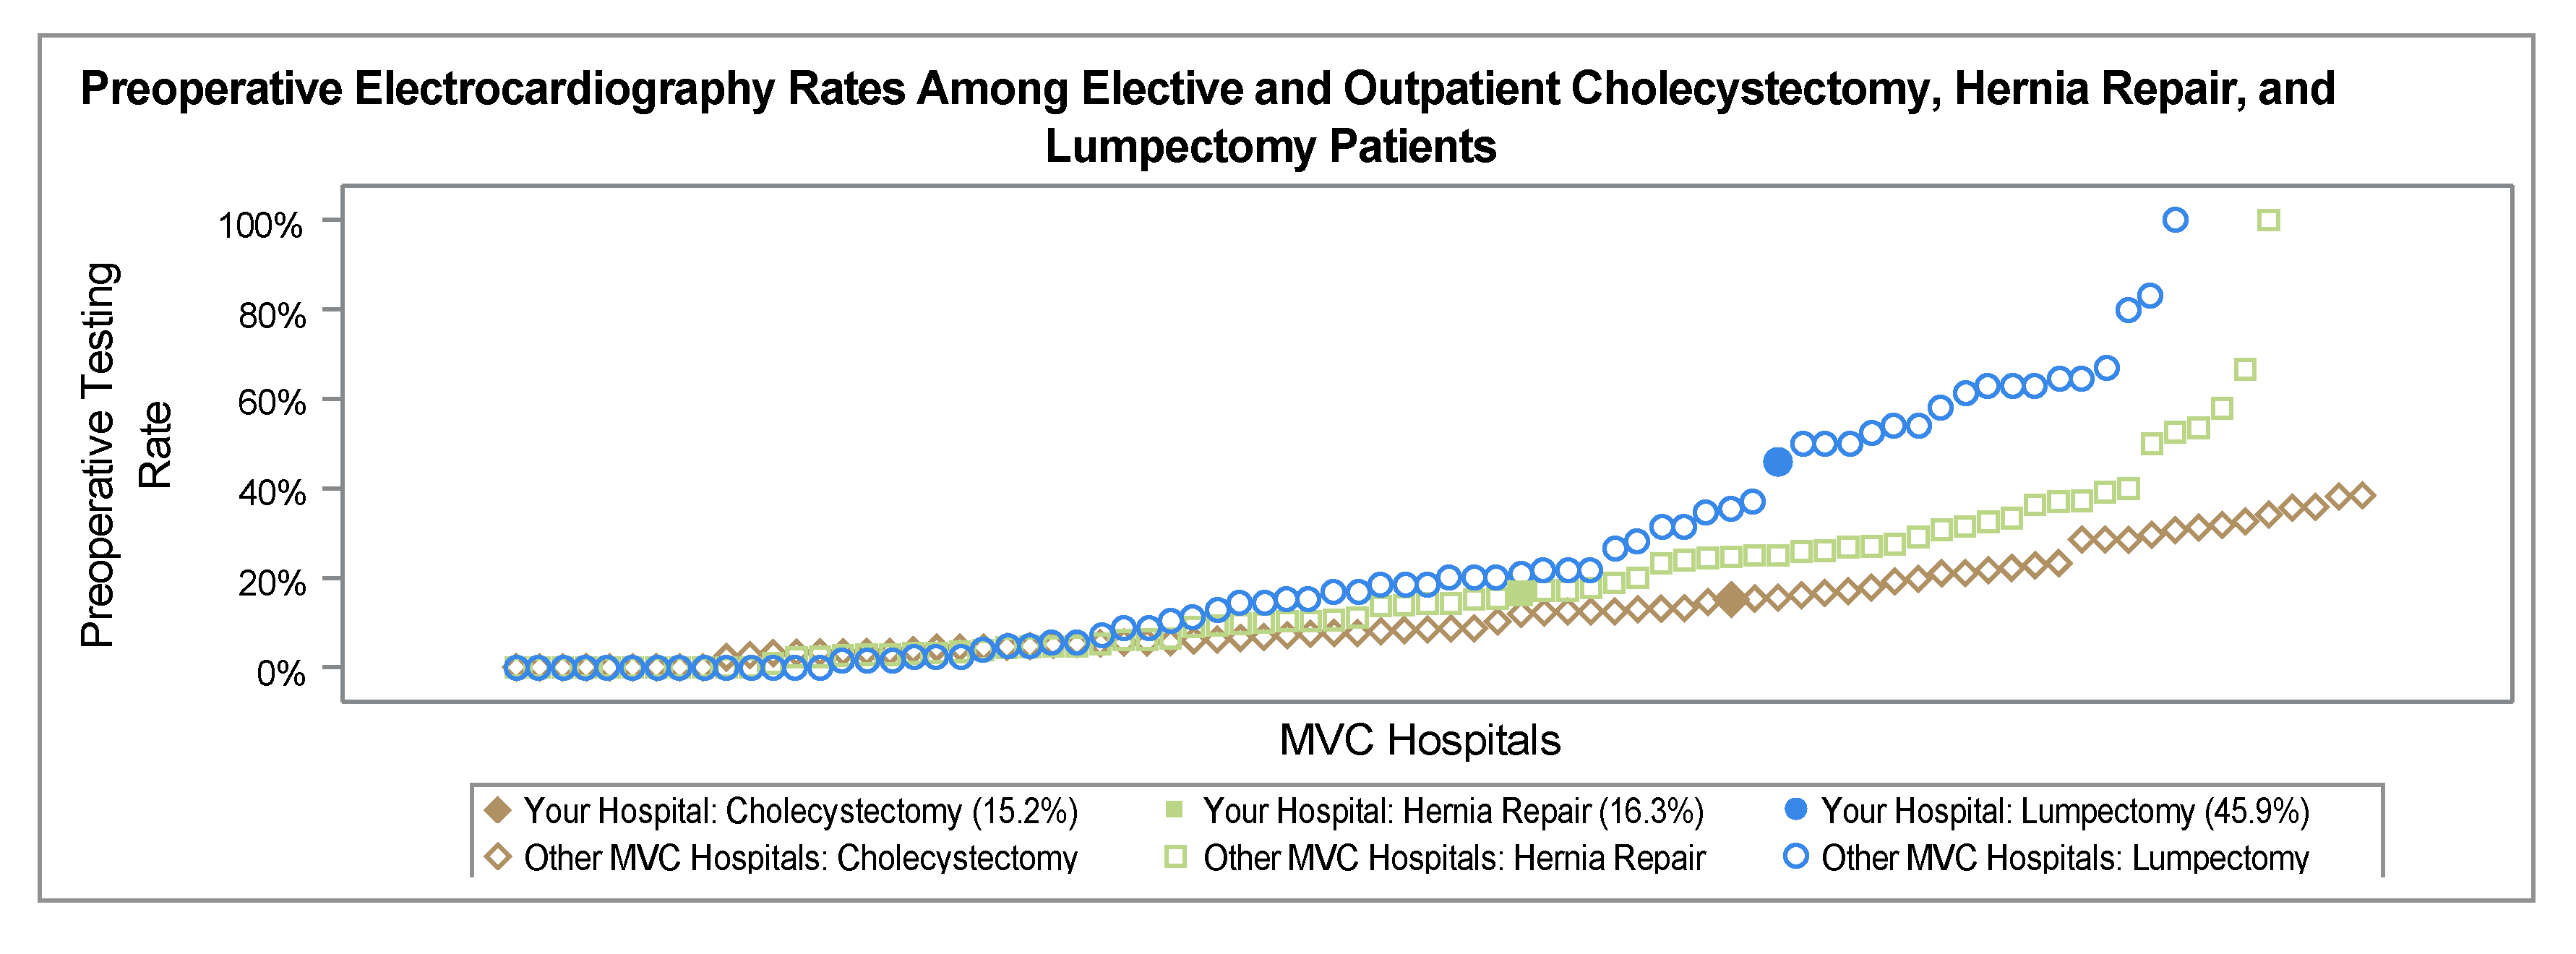
Members will see their average testing rate across all three procedures, as well as their rate for each specific procedure (Figure 2). A hospital’s combined rate can easily be compared with the average for that hospital’s geographic region within the state of Michigan as well as the collaborative-wide average. This figure showcases the wide variability across the collaborative in average testing rates across procedures—some in the collaborative have an average testing rate close to 10% and some nearly 100%.

Figure 2.

The next figure in the report showcases overall preoperative testing rates by six-month intervals for 2021 and 2022. It includes data points for the MVC average and regional comparison groups (Figure 3), with evidence of very little change in overall testing rates over time when looking at all three procedures combined.

Figure 3.

Although the overall rate across the collaborative has been steady, MVC has identified shifts in testing rates for individual members. To support members in tracking these changes, a caterpillar plot is also included that depicts the absolute change in any preoperative testing from 2021 to 2022 (Figure 4). Members can see the percentage change—positive or negative—in their annual testing rate from 2021 to 2022 for a specific procedure, as well as how their absolute change compares to the rest of the collaborative. This figure showcases that although the collaborative is not seeing much change in its overall rates for any testing over time, individual members might see greater variability over time for specific tests or procedures, especially in instances of low case counts. Overall, MVC observed slight reductions in the average collaborative-wide procedure-specific testing rates from 2021 to 2022 for all three surgical procedures, with the highest reduction observed among lumpectomy episodes (-6.2%).

Figure 4.

Members will also be able to take deeper dives into their rates for specific tests (Figure 5) in the figures that make up the remaining pages of the report. Viewing one’s preoperative testing rates for each specific test can help members understand if any specific tests are driving their overall testing rate or are ordered more frequently than the majority of their peers.

Figure 5.

MVC is eager to drive improvement in this area and encourages members to visit the Waive the Workup resource website developed in partnership with the Michigan Surgical Quality Collaborative (MSQC) and the Michigan Program on Value Enhancement (MPrOVE). If you are interested in a more customized report, please contact the MVC Coordinating Center at Michigan-Value-Collaborative@med.umich.edu.

0
View Post
MVC Refreshes Sepsis Push Reports for Hospital Members

MVC Refreshes Sepsis Push Reports for Hospital Members

The Michigan Value Collaborative distributed refreshed sepsis push reports this week, providing its hospital members with updated figures and measures using the latest MVC episode data. In addition, the latest reports were also distributed to members of the Michigan Hospital Medicine Safety Consortium (HMS), a valued partner in the initial development of this service line within MVC's registry.

This week’s reports included MVC’s updated race and ethnicity categories, which were modified and expanded to ensure greater inclusivity and accuracy. MVC also recently adopted a methodological change to its identification of patients admitted with COVID-19 that impacted the episode data used in this analysis. MVC episodes were flagged as containing significant COVID-19 care if a COVID-19 diagnosis (U07.1) was found in the primary diagnosis code position on a facility claim during the 90-day episode. Previously, MVC looked for COVID-19 diagnosis in the first three diagnosis code positions. These episodes are often excluded from MVC’s push reports but have historically been included in sepsis reporting to help hospitals gauge the impact of COVID-19 diagnosis on their sepsis metrics. Combined with the natural decline in disease prevalence, there was a significant reduction in the percentage of patients with a COVID-19 diagnosis who were treated for sepsis, compared to the previous reporting period.

The version shared with MVC members this week continued to provide price-standardized, risk-adjusted benchmarking for total episode payments, as well as length of inpatient stay, Intensive Care Unit (ICU)/Cardiac Care Unit (CCU) utilization, inpatient mortality or discharge to hospice, 90-day post-acute care utilization, and 90-day readmission rates. MVC’s general acute care hospital (GACH) and Critical Access Hospital (CAH) members were provided with tailored versions using comparison groups most suitable to their hospital category.

Sepsis is currently the third leading cause of death in U.S. hospitals, so inpatient mortality and discharge or hospice were included in MVC’s sepsis reports as important quality checks. The average inpatient mortality rate among patients hospitalized for sepsis was 13.3% across member GACHs (Figure 1) and 6.5% for CAHs (Figure 2). Rates for discharge to hospice at home or a medical facility were lower.

Figure 1.

Figure 2.

The latest report also investigated differences in 90-day readmission rates for patients hospitalized for sepsis. Within GACH, patients with Medicare FFS coverage exhibited the highest average readmission rate (30.4%), followed by patients insured by BCBSM/BCN MA plans (25.6%) and BCBSM/BCN Commercial plans (16.4%), respectively (Figure 3). BCBSM/BCN Commercial patients had a younger average age and lower average comorbidity count than patients with Medicare or MA plans. Within CAHs, the average 90-day readmission rate was 22.4%.

Figure 3.

The report also included benchmarking for average index length of stay by specific payer groups as well as for all payers combined. The average index length of stay across all payers was 8.7 among GACH patients and 5.5 among CAH patients.

Another significant finding was the difference in post-acute care utilization by service type among patients hospitalized for sepsis (Figure 4). On average across GACHs in the collaborative, outpatient services had a noticeably higher utilization rate (59.3%) compared to home health (29.4%) or skilled nursing facility (21.9%). The same was true for CAHs (Figure 5), with a much higher average utilization rate for outpatient services (75.2%) compared to home health (29.5%) or skilled nursing facilities (18.6%).

Figure 4.

Figure 5.

These reports were prepared using 90-day MVC episode data with index admissions from 7/1/19 – 6/30/22 for the following insurance plans: Medicare Fee-For-Service (FFS), Blue Cross Blue Shield of Michigan (BCBSM) PPO Commercial, Blue Care Network (BCN) Commercial, BCBSM PPO Medicare Advantage (MA), and BCN MA.

MVC welcomes your recommendations for enhancing these reports and welcomes your feedback on how collaborative members are using these data to support their quality improvement efforts. Please don't hesitate to contact the MVC team at Michigan-Value-Collaborative@med.umich.edu.

0
View Post
MVC’s Refreshed Common Conditions Report Coming to Hospital Members Soon

MVC’s Refreshed Common Conditions Report Coming to Hospital Members Soon

MVC members will receive their next batch of updated push reports in the coming days with a refreshed version of MVC’s common conditions report. These reports provide insight into episodes of care for eight medical and surgical conditions that are commonly a focus for quality improvement efforts at MVC hospitals: acute myocardial infarction (AMI), chronic obstructive pulmonary disease (COPD), colectomy (non-cancer), congestive heart failure (CHF), coronary artery bypass graft (CABG), total knee and hip (joint) replacement, pneumonia, and spine surgery. MVC’s general acute care hospital and Critical Access Hospital (CAH) members will receive tailored versions of the report, with each group receiving benchmark data specific to their own category of hospitals.

Although the metrics provided vary by condition and case count, report pages generally focus on 30-day total episode payments, readmission rates, common reasons for readmissions, and post-acute care utilization. MVC price standardizes total episode payments to Medicare FFS amounts so that comparisons can be made across hospitals and over time. Payments are risk adjusted for patient age, gender, payer, comorbidities, and high or low prior healthcare utilization/payments.

Post-acute care utilization benchmarking for each of the eight medical and surgical conditions includes graphs displaying the percentage of each hospital’s patients who used home health care, inpatient/outpatient rehab, skilled nursing facility care, outpatient services, or emergency department care in the 30 days following their index hospitalization or surgery. Across the collaborative, reports show high use of 30-day home health care and outpatient services for these common conditions. For patients initiating their episode of care at a general acute care hospital within the collaborative, the home health care utilization rate was highest following CABG (69%) and joint replacement (50%).

Patients with a CABG episode were also high utilizers of outpatient services in the 30 days post-index (Figure 1), with a 73% average utilization rate. Patients with episodes for CHF (58%) and AMI (53%) were also high utilizers of outpatient services. Across conditions, use of outpatient services in the 30 days post-index was generally higher among episodes originating at CAHs than among episodes originating at general acute care hospitals.

Figure 1.

Reports also assess the setting of care for joint replacements and spine surgeries. For total knee and hip replacements, MVC data shows that the percent of joint replacements performed in an outpatient setting at general acute care hospitals across Michigan continued to rise from January 2021 through September 2022 (Figure 2).

Figure 2.

The patient population in these reports comprises adult patients who had surgery or an inpatient hospitalization at an MVC-participating hospital between January 2021 and September 2022. Measures are based on 30-day inpatient and surgical-based episodes of care data, incorporating paid claims from Blue Cross Blue Shield of Michigan and Blue Care Network Commercial and Medicare Advantage plans as well as paid claims from Medicare Fee-for-Service. Episodes meeting any of the following criteria were excluded from calculations: patients transferred to another acute care hospital or to hospice, patients who died during their index stay, and patients with a primary diagnosis of COVID-19 received in an inpatient setting at any point during their 30-day episode.

We hope our collaborative participants find these reports valuable, and as always, we welcome MVC members to contact MVC with any questions or analytic requests.

0
View Post
MVC’s 2023 Chronic Disease Management Follow-Up Reports Coming to Members Soon

MVC’s 2023 Chronic Disease Management Follow-Up Reports Coming to Members Soon

MVC will soon distribute the 2023 version of its chronic disease management follow-up reports to members. This refreshed version provides summary data on patients eligible for follow-up care after discharge from hospitalizations for congestive heart failure (CHF) or chronic obstructive pulmonary disease (COPD).

MVC defines timely follow-up care as receipt of an in-person or remote outpatient follow-up visit within 30 days of hospital discharge to home or home health care and before any readmission, emergency department (ED) visit, or procedure. Patients admitted to a skilled nursing facility, long-term acute care hospital, or inpatient rehab within the 30-day episode were excluded. MVC’s follow-up analyses was performed using claims-based episodes of care with index hospital admissions between 7/1/2019 and 06/30/2022 for Blue Cross Blue Shield of Michigan (BCBSM) PPO Commercial and Medicare Advantage (MA), Blue Care Network (BCN) HMO Commercial and MA, and Medicare Fee-for-Service insurance plans. For each of the two chronic conditions included in the report, hospitals with at least 11 episodes per year for a given condition received that condition-specific data.

The report offers a comparison of demographic characteristics for CHF and COPD patients who received a follow-up visit within 30 days versus those who did not receive follow-up. Demographic characteristics tabulated for each condition include the percent of patients living in “at-risk” or “distressed” Zip codes as defined by the Economic Innovation Group’s Distressed Community Index, patients’ average number of comorbidities, the mean age of patients, and the distribution of race and ethnicity. MVC recently refined and expanded its reporting of race and ethnicity identities, and these updates were reflected in the report. Patients are grouped as Hispanic if their insurance provider categorized their combined race/ethnicity as Hispanic or their ethnicity as Hispanic. Additionally, MVC no longer combines smaller groups and discontinued its use of the terms “other” and “unknown.”

On the first page provided for each condition, hospital follow-up rates are provided for three windows of time compared to those at other MVC hospitals (Figure 1), as well as trends over time for each follow-up window (Figure 2). For CHF, follow-up rates are provided in 3-day, 7-day, and 14-day time windows. For COPD, follow-up rates are provided in 7-, 14-, and 30-day time windows.

Figure 1.

Figure 2.

The second page of condition-specific feedback includes a summary of average 30-day risk-adjusted, price-standardized total episode payments by follow-up status compared to statewide and regional averages. Among general acute care hospitals included in the analysis, the statewide total average payment for CHF episodes was $17,235 for patients who received follow-up and $20,069 for those who did not; for COPD episodes, the statewide average payments were $13,815 among those with follow-up and $16,056 among those without. In reports generated for Critical Access Hospitals (CAHs), payments were compared to averages across all MVC CAH members. Rates of 30-day follow-up were also compared by payers across the same groups.

The final figure (Figure 3) in the report for each condition is a summary of follow-up method among those who received any follow-up care. Patients who received follow-up were categorized as having received only in-person follow-up visit(s), only remote follow-up, or both in-person and remote follow-up. MVC found that more than 80% of CHF and COPD patients statewide exclusively received in-person follow-up after a hospitalization.

Figure 3.

If you have any questions or feedback about this report, please contact the MVC Coordinating Center.

0
View Post
MVC Develops PO Post-Discharge and ED-Based Episode Reports

MVC Develops PO Post-Discharge and ED-Based Episode Reports

The Michigan Value Collaborative (MVC) recently completed the development of two new push reports tailored to physician organizations (POs). Both reports mirrored hospital-level push reports distributed earlier this summer and reflect MVC’s ongoing approach to refining and tailoring its analytic offerings to the patient populations and needs of its diverse membership. The first new PO report of 2023 was released in July and focused on post-discharge care, and the second is set to be released next week using new emergency department (ED)-based episodes.

PO ED-Based Episodes Report

The forthcoming PO ED-based episode report features MVC’s new ED-based episode data for five high-volume ED conditions: chest pain, abdominal pain, chronic obstructive pulmonary disease (COPD), congestive heart failure (CHF), and cellulitis. A hospital-level version was distributed in June.

ED-based episodes are a new episode of care structure developed by MVC in collaboration with the Michigan Emergency Department Improvement Collaborative (MEDIC). These episodes are initialized by a patient’s visit to the ED and include all claims-documented care received in the 30 days following a patient’s index ED visit.

For each of the five index conditions included in this forthcoming report, POs will receive information on risk-adjusted and price-standardized 30-day total episode payments, same-day inpatient admission rates over time, utilization of healthcare services across an attributed patient’s 30-day episode of care, and the hospitals where a PO’s attributed patients most frequently presented to the ED for a given index condition. Patient claims data were included for adult patients aged 18 and older who had an ED visit between 1/1/21 and 8/31/22 and were insured by Blue Cross Blue Shield of Michigan (BCBSM) PPO Commercial, BCBSM Medicare Advantage (MA), or Medicare Fee-for-Service (FFS).

Among POs receiving a report, average risk-adjusted, price-standardized 30-day total episode payments for the five reported conditions were highest for CHF ED-based episodes ($16,936) followed by COPD ED-based episodes ($10,286), and lowest for unspecified chest pain ($3,714). Within each condition, MVC 30-day total episode payments were consistently higher for episodes in which the attributed patient had a same-day inpatient admission compared to episodes in which the attributed patient did not have an inpatient stay begin on the date of their ED visit.

A key goal for these ED-based episode reports was to provide insight into healthcare utilization following index ED visits. Therefore, reports included a dot plot (Figure 1) comparing each PO’s post-ED utilization for their attributed patients compared to the average across all 40 MVC member POs.

Figure 1.

PO Skilled Nursing Facility & Home Health Report

In July, MVC distributed PO-level reports on post-discharge care that included metrics on skilled nursing facility and home health utilization. A hospital-level version was distributed in June. The purpose of this report was to support understanding of care coordination opportunities and benchmark post-discharge care utilization.

This report highlighted various SNF and home health utilization metrics using 30-day claims-based episodes for MVC’s medical conditions: acute myocardial infarction (AMI), atrial fibrillation, COPD, CHF, endocarditis, pneumonia, sepsis, small bowel obstruction, and stroke. A PO’s attributed patient episodes were included if they had an inpatient admission between 1/1/2021 and 6/30/2022 and were insured by BCBSM PPO Commercial, BCBSM MA, or Medicare FFS.

As with other PO-level push reports, MVC included several comparison groups to aid individual POs in benchmarking their performance for select report metrics. Each PO can compare their data to the average for POs of a similar size, the average for POs located within the same geographic region of Michigan according to MVC’s region designations, and the collaborative-wide average for all MVC member POs. Only POs with 20 or more episodes in 2021 and 11 or more in 2022 received a report and were included in comparison group calculations.

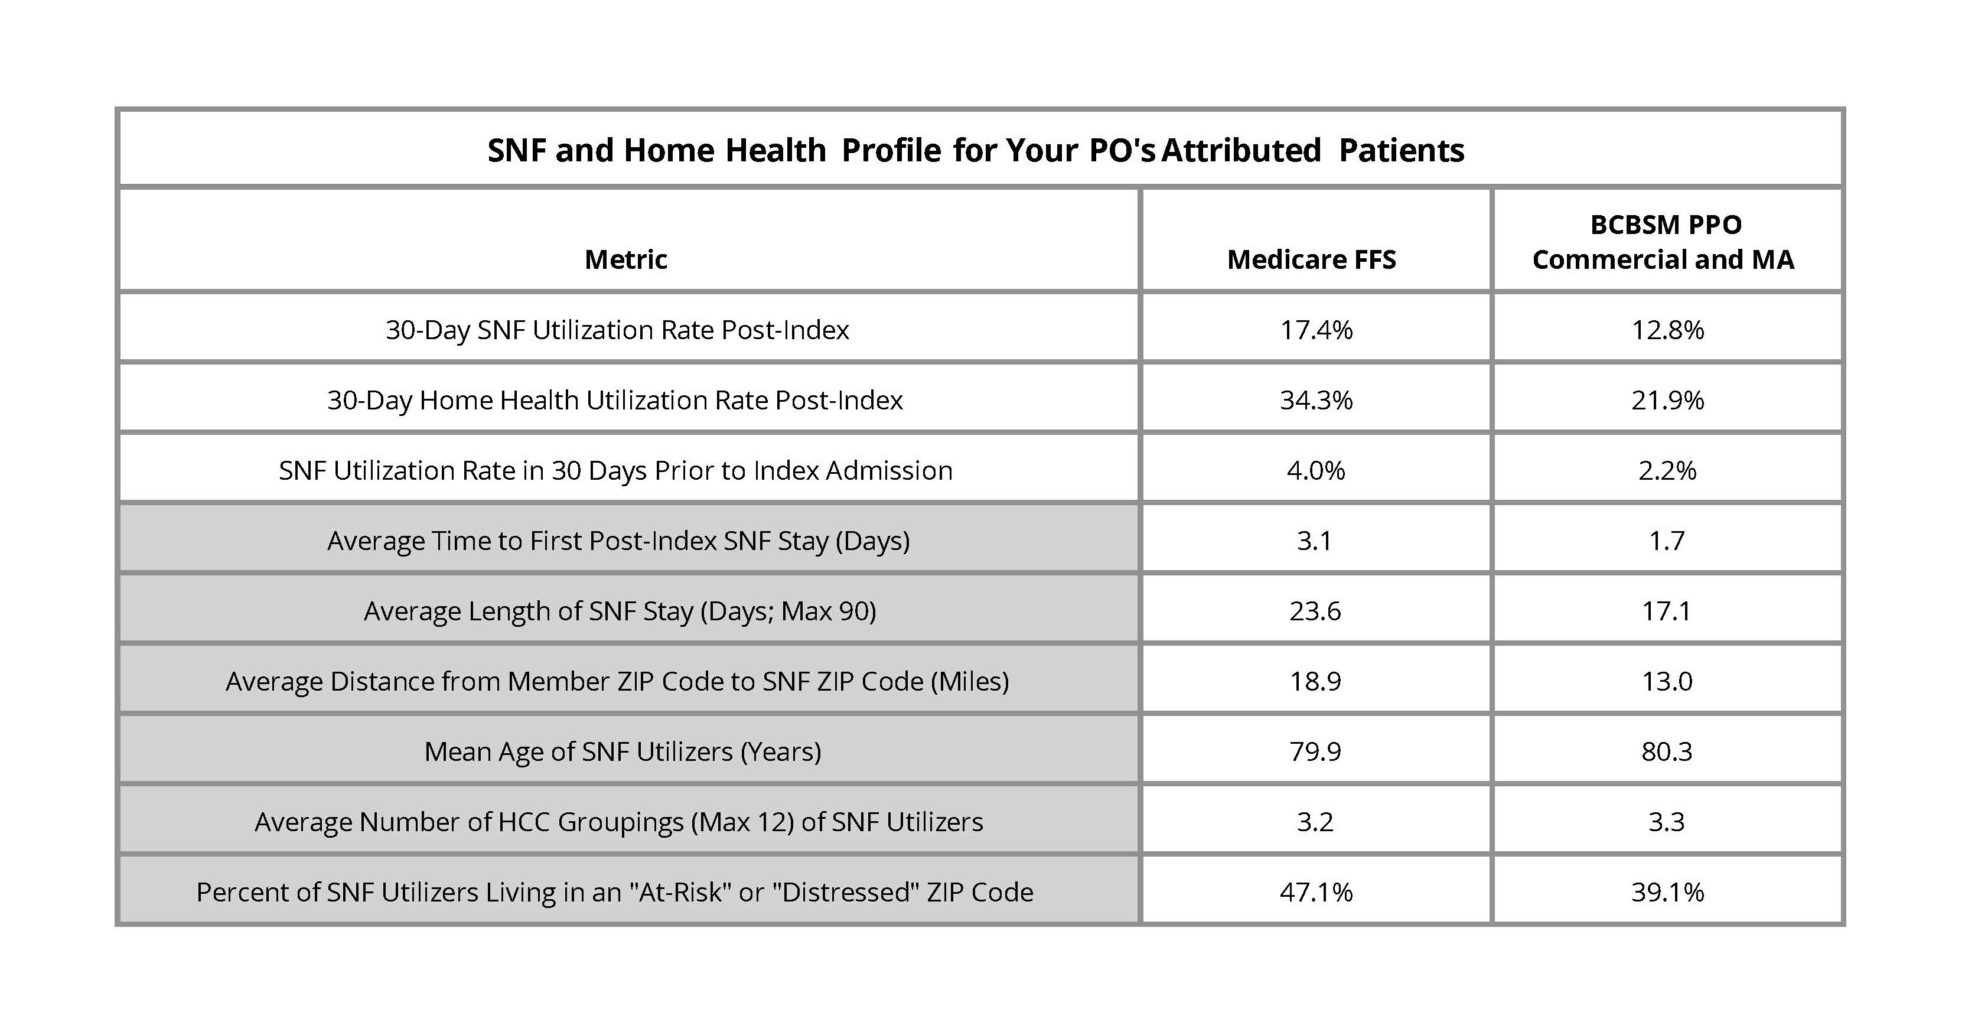
Similar to the hospital-level version, the first page of the report contained a SNF and home health profile table (Figure 2), which provided an overall look at post-discharge utilization patterns by payer as well as information about a given PO's patient population. The first three metrics reflected all attributed patients treated for medical conditions in this time period for the included payers and the metrics in gray were comprised only of attributed patients who utilized SNF in the 30 days post-discharge from their episode's index hospitalization. Overall, MVC found that Medicare FFS patients utilized SNF and home health services more often.

Figure 2.

Measures in this report include SNF and home health utilization rates overall and by condition, SNF and home health utilization rates among patients discharged to their home, inpatient readmission rates for SNF and home health utilizers, and a list of the most frequently utilized SNFs and home health providers to help POs understand where their attributed patients are going when receiving SNF or home health care after discharge. MVC presented 30-day overall SNF and home health utilization rates in a caterpillar plot format to showcase variation across POs. These rates varied between roughly 9% and 16% for SNF utilization (Figure 3) and between 19% and 32% for home health utilization (Figure 4).

Figure 3.

Figure 4.

MVC observed average 30-day inpatient readmission rates of 21% among attributed PO patients discharged to SNF (Figure 5) and 17.2% among attributed patients discharged to home health (Figure 6).

Figure 5.

Figure 6.

New Report Distribution Process

MVC piloted a new method for distributing its push reports when sending out the PO SNF/HH reports and is continuing that method for the distribution of its PO ED-based episode reports. Over the summer, PO site coordinators received an email from Dropbox as well as from MVC with a link to their PO’s designated Dropbox folder. Since then, MVC has been working to confirm that contacts are able to successfully access their designated folder and reports.

This new report distribution process will allow MVC’S contacts to access all available MVC reports in a single, secure location, and address some of the email firewall issues experienced by some members. Going forward, members may access and download their individualized reports using Dropbox rather than receiving reports through email. When a new report is made available to members, MVC will still notify all recipients via email with the details of the report. MVC plans to launch this new report distribution process with its hospital partners in the coming months, beginning with Program Year 2023 mid-year scorecards for the MVC Component of the BCBSM Pay-for-Performance (P4P) Program.

If you have any follow-up questions about your site’s latest push reports or the new report distribution process, please contact the MVC Coordinating Center at Michigan-Value-Collaborative@med.umich.edu.

0
View Post
MVC Calls Attention to Research, Resources During Week-Long Preoperative Testing Campaign

MVC Calls Attention to Research, Resources During Week-Long Preoperative Testing Campaign

Prior to surgery, most Michigan patients will undergo a series of tests, such as blood draws, urinalysis, chest x-rays, or electrocardiograms (ECGs/EKGs). Many of these tests are unnecessary for healthy patients undergoing low-risk procedures such as groin hernia repair. Routine preoperative testing is widely considered a low-value service, and yet a majority of hospitals continue to order these tests. In an effort to drive improvement in this area, MVC hosted its second annual preoperative testing awareness campaign this week.

“For a patient, it is key they get the right amount of preoperative assessment,” said Dr. Michael Englesbe, professor of surgery at the University of Michigan, director of the Blue Cross Blue Shield of Michigan-funded Collaborative Quality Initiatives, director of the Michigan Surgical Quality Collaborative (MSQC), and co-director of the Michigan Opioid Prescribing and Engagement Network (Michigan OPEN). “Too little testing and important risks may be missed, too much and patients may be exposed to critical risks of unnecessary testing and delays in care.”

MVC’s Coordinating Center supports preoperative testing de-implementation in several ways. One is providing opportunities for MVC’s members to collaborate and learn from one another. This year MVC launched a workgroup series focused on preoperative testing, the first of which took place in March. As part of its campaign this week, MVC promoted the next session in this workgroup series, set to take place Tues., Aug. 1, from 1-2 p.m. featuring guest speaker Nick Berlin, MD, MPH, MS. Those interested in this topic should register to attend here.

Another key strategy MVC uses to support preoperative testing de-implementation is through data analysis and reporting. MVC analysts utilize administrative claims data to calculate testing rates in the preoperative period, and then share these results with members as reports or as unblinded data at collaborative-wide meetings. More recently, MVC partnered with MSQC to distribute these reports more widely to support cross-collaboration between clinical and quality personnel at a given site.

These reports are an invaluable resource in benchmarking the extent of the issue statewide, says Dr. Hari Nathan, MVC’s director and the chief of hepato-pancreato-biliary surgery at Michigan Medicine. “MVC data can be used by hospitals and providers to understand how their rates of preoperative testing compare to those of other hospitals in Michigan,” he said. “By focusing on a homogeneous cohort of healthy patients undergoing common, low-risk surgical procedures, MVC benchmarks can help all hospitals understand where they have an opportunity to improve, regardless of facility size, resources, or patient population.”

Across the collaborative, MVC sees wide variation in preoperative testing for low-risk elective surgeries like hernia repairs and lumpectomies, with testing rates among young, healthy patients ranging from 10% to 97% across MVC hospitals. This level of interhospital variation is evidence that many hospitals in Michigan are safely performing low-risk surgeries without widespread preoperative testing and that even those hospitals with average rates likely have room to safely reduce their testing further.

MVC also sees quite a bit of intrahospital variation, with certain surgeries driving the overall preoperative testing rate at a given site. Based on the findings of its latest report, one potential area of focus for sites may be reducing the rate of cardiac testing; the rate of ECGs is quite variable across the collaborative and could lead to a cascade of care.

MVC shared its refreshed preoperative testing push report with members in April and also held a report review webinar in June to review the measures included. This webinar also included advice from Dr. Nathan about how to take action using this data. Dr. Nathan promoted several new resources developed in partnership by MSQC, the Michigan Program on Value Enhancement (MPrOVE), and MVC. These include a customizable decision aid (Figure 1), which sites can download to add their branding or modify. It is accompanied by a similarly customizable preoperative testing reference chart (Figure 2).

Figure 1.

Figure 2.

Both of these resources are currently housed on a new Waive the Workup de-implementation resource website managed by MPrOVE, MSQC, and MVC. In addition to pages for the decision aid and chart, the site also offers talking points for debunking common myths about preoperative testing. For instance, one common counterargument to reducing preoperative testing prior to low-risk surgery is a perception that there’s no harm in ordering them, either because they are relatively inexpensive or because they are not invasive tests.

On the contrary, research has established substantial financial costs and risks to patient harm because of preoperative testing, which can and should be safely reduced. Mihir Surapaneni, BBA, a medical student at the University of Michigan Medical School, has been conducting research with MVC on preoperative testing and its impact. “One of the major theories for why there’s so much variability—and indeed just a high utilization rate—for preoperative testing is that there’s no perceived downside,” Surapaneni said. “Many of these tests are relatively cheap compared to the total cost of healthcare and indeed most of them cost no more to the patient than a stick of blood, but we really have to consider that there are costs. Preoperative testing costs billions of dollars in the United States healthcare system annually, and when you consider how strained the healthcare system is and how much of an onus there is on payers and the government to decrease costs, this really adds up. And secondly, we have to consider the possibility of testing cascades—which has been well-documented—in that a patient comes in having an abnormal lab value or test that actually had nothing to do with their intended surgery, and this leads to more and more tests which are expensive and potentially invasive. And finally, we have to consider that there’s established literature showing that even when an abnormality is found in a routine preoperative test, these abnormalities: 1) rarely impact the clinical course of the patient, and 2) rarely lead to actual substantive change in that patient’s care. And I think that we really have to consider these when we’re deciding whether or not we want to test our patients routinely.”

In addition to registering for the Aug. 1 workgroup, MVC has a third preoperative testing workgroup session scheduled for Oct. 26, 11 a.m. - 12 p.m. The Oct. session will be a forum for sharing current successes or initiatives underway across the collaborative. If your hospital has a current initiative underway on preoperative testing de-implementation or has a low average testing rate, MVC would love to learn from you. Please reach out to the MVC team if you’d be interested in sharing your site’s story on Oct. 26.

0
View Post
MVC’s SNF and HH Push Report Latest in Post-Discharge Insights

MVC’s SNF and HH Push Report Latest in Post-Discharge Insights

MVC released another new push report recently with the first iteration of a skilled nursing facility (SNF) and home health focused report. MVC members frequently identify post-discharge care and SNF utilization as focus areas for quality improvement; therefore, this report was developed to help hospitals benchmark their performance in this area and identify opportunities to improve care coordination. Critical access hospitals (CAHs) received a tailored version of the report to allow for metric comparisons to only other CAHs.

This report highlighted various SNF and home health utilization metrics using 30-day claims-based episodes for MVC’s medical conditions: acute myocardial infarction (AMI), atrial fibrillation, chronic obstructive pulmonary disease (COPD), congestive heart failure (CHF), endocarditis, pneumonia, sepsis, small bowel obstruction, and stroke. Patient episodes were included if they had an inpatient admission between 1/1/2021 and 6/30/2022 and had one of the following insurance plans: Blue Care Network (BCN) HMO Commercial or Medicare Advantage (MA), Blue Cross Blue Shield of Michigan (BCBSM) PPO Commercial or MA, or Medicare Fee-for-Service (FFS).

The first page of the report contained a SNF and home health profile table (Figure 1), which included nine metrics designed to give an overall look at post-discharge utilization patterns as well as information about a given hospital’s patient population. The first three metrics reflected all patients treated for medical conditions in this time period for the included payers and the metrics in gray were comprised only of patients that utilized SNF in the 30 days post-discharge from their episode's index hospitalization. Overall, MVC found that Medicare FFS patients utilized SNF and home health services more often than other payers. For CAHs, this table was not separated by payer.

Figure 1.

On the subsequent pages, 30-day overall SNF and home health utilization rates were provided in a caterpillar plot format to showcase variation across the collaborative (Figure 2). These rates varied between 5% and 25% for SNF utilization and between 10% and 40% for home health utilization.

Figure 2.

MVC also provided 30-day SNF and home health utilization rates broken out by condition to allow each hospital to benchmark rates across their site’s medical service lines and compared to the MVC average rate for each condition (Figure 3). Medical conditions were only included in this figure if a hospital had at least 11 cases between 1/1/2021 and 6/30/2022. On average across the collaborative, the highest 30-day post-discharge SNF utilization rates were observed in endocarditis (28%), sepsis (19.5%), and stroke (19.5%) patients.

Figure 3.

Hospitals also received a table identifying the most frequently utilized SNFs from a medical condition episode to help sites understand where their patients are going when receiving SNF care after discharge. A similar table was shown for home health providers.

The final page of the report included four caterpillar plots tailored to specific denominators. This included 30-day SNF and home health utilization rates for the cohort of patients discharged home. It also included readmission rates for patients who were discharged to SNF and readmission rates for patients discharged to home health. These plots were included to inform each hospital about patterns in their transitions of care and readmissions. There was significant variability in readmission rates following discharge to either a SNF or home health facility, with some hospitals averaging close to 5% readmission rates and some hospitals seeing an average of nearly 40% of patients readmitted during the 30-day post-discharge window (Figure 4).

Figure 4.

As part of its new Lunch & Learn series, MVC recently hosted a session focused on MVC data that included a walkthrough of its SNF/HH report and a deeper dive into those report metrics using MVC’s registry. Those who were unable to attend can watch a recording of the presentation here, which demonstrates how to replicate aspects of the push report on MVC’s registry in order to view additional episode spending and patient-level data.

If you have any questions or feedback about this report, please reach out to the MVC Coordinating Center.

0
View Post
MVC Uses New ED-Based Episode Data in Latest Push Report

MVC Uses New ED-Based Episode Data in Latest Push Report

The MVC Coordinating Center recently distributed its first-ever report based on new emergency department-based episodes (“ED-based episodes”), sharing versions with site coordinators and quality improvement staff at 102 participating MVC member hospitals across Michigan. Reports featured each hospital’s own attributed ED-based episode data for five high-volume ED conditions: chest pain, abdominal pain, chronic obstructive pulmonary disease (COPD), congestive heart failure (CHF), and cellulitis.

ED-based episodes are a new episode of care data structure developed this past year by MVC in collaboration with the Michigan Emergency Department Improvement Collaborative (MEDIC), a BCBSM-funded Collaborative Quality Initiative with the goal of improving care and patient outcomes in Michigan emergency departments. MVC and MEDIC team members worked closely to develop 30-day episodes of care initialized by a patient’s visit to the ED and including all claims-documented care received in the 30 days following a patient’s index ED visit. MEDIC program director Dr. Keith Kocher, MD, talks more about the collaboration as well as advice on leveraging this data from an emergency medicine perspective in the video below.

These ED-based episodes are built using medical claims data from Medicare Fee-for-Service, Blue Cross Blue Shield of Michigan PPO Commercial and Medicare Advantage plans, and Blue Care Network HMO Commercial and Medicare Advantage plans. MVC’s ED-based episodes of care include both adult and pediatric patients, providing new opportunities for quality improvement insights at Michigan hospitals. Though this report provides metrics for five specific index conditions, MVC currently offers data for 15 ED-based index conditions, including abdominal pain, asthma, atrial fibrillation, cellulitis, unspecified chest pain, COPD, CHF, deep venous thrombosis, diabetes mellitus (short- and long-term complications), gastrointestinal bleed, pneumonia, pulmonary embolism, pyelonephritis/urinary tract infections, and syncope.

For each of the five index conditions included in the recent reports, hospitals received information on risk-adjusted and price-standardized 30-day total episode payments, same-day inpatient admission rates over time, utilization of healthcare services across the patient’s 30-day episode of care, and each hospital’s most frequent reasons for inpatient readmissions. Patient claims data were included for adult patients aged 18 and older who had an ED visit at a given hospital between 1/1/21 and 8/31/22, were insured by one of the insurance plans mentioned above, and had a primary diagnosis on their index claim matching standardized definitions for the five included conditions.

Among general acute care hospitals receiving a report, the average risk-adjusted, price-standardized 30-day total episode payments (Figure 1) for the five reported conditions were highest for CHF ED-based episodes ($17,455) followed by COPD ED-based episodes ($11,001), and lowest for unspecified chest pain ($3,792). Within each condition, MVC 30-day total episode payments were consistently higher for episodes in which the patient had a same-day inpatient admission compared to episodes in which the patient did not have an inpatient stay begin on the date of their ED visit. With that information in mind, hospital members can also use their individualized reports to track their same-day inpatient admission rate by six-month intervals using trend graphs for each included ED-based condition (Figure 2).

Figure 1.

Figure 2.

A key goal for these ED-based episode reports was to provide insight into healthcare utilization following index ED visits. Therefore, reports included a dot plot (Figure 3) comparing their own hospital’s patient post-ED utilization to that of the appropriate general acute care hospital or Critical Access Hospital MVC comparison group. Dot plots provided information on what percent of episodes had a same-day inpatient admission, what percent did not have a same-day inpatient admission but did see the patient admitted in the 1 to 30 days following the index ED visit, and what percent of patients had two or more inpatient admissions (thus, at least one readmission) during the episode of care. Also provided are rates of subsequent ED visits, receipt of outpatient services, home health, and skilled nursing facility care.

Figure 3.

Please share your feedback with the MVC team if certain report measures were helpful or if you’d be interested in seeing future ED-based episode reporting for certain conditions and metrics. MVC is now also accepting custom report requests using its new ED-based data. Contact MVC to learn more.
0
View Post
MVC’s 2023 Cardiac Rehabilitation Reports Shared with Hospitals

MVC’s 2023 Cardiac Rehabilitation Reports Shared with Hospitals

Participation in cardiac rehabilitation (CR) programs is a crucial strategy for improving cardiac health outcomes. Participation reduces the risk of all-cause and cardiovascular-specific mortality, reduces readmissions, and enhances the patient’s quality of life. Despite the identifiable benefits, Michigan patients underutilize this high-value program, falling well below the 70% participation goal set by the Million Hearts Initiative. Therefore, the Michigan Value Collaborative (MVC) and several of its partners have identified CR as a high-value service for which they endeavor to drive improvement.

In support of this effort, MVC recently distributed the 2023 version of its CR reports to members with data on CR-eligible patients following discharge for heart attack (AMI), heart valve repair or replacement (TAVR or SAVR), coronary artery bypass procedure (CABG), percutaneous coronary intervention (PCI), and congestive heart failure (CHF). These reports were generated using MVC claims-based episodes of care with patient index admissions between 1/1/19-12/31/21 for multiple insurance plans, including Blue Care Network (BCN) HMO Commercial, BCN Medicare Advantage, Blue Cross Blue Shield of Michigan (BCBSM) PPO Commercial, BCBSM Medicare Advantage, and Medicare Fee-for-Service.

Hospitals received data on a specific procedure or condition if they had no fewer than 20 cases in the reporting period for that condition/procedure. The report pages include figures for a variety of CR metrics, including participation rates after discharge, quarterly trends in participation between 2019-2021, mean days to first CR visit among participating patients, and the mean number of visits completed among participating patients.
MVC generates these hospital-level reports as a product of the Michigan Cardiac Rehabilitation (MiCR) Network, a partnership between MVC, Blue Cross Blue Shield of Michigan Cardiovascular Consortium (BMC2), and the Michigan Society of Thoracic and Cardiovascular Surgeons Quality Collaborative (MSTCVS-QC). The MiCR Network strives to increase participation in CR for all eligible individuals in Michigan.

Given the current status of CR participation across the state, the MiCR Network is tracking progress toward two utilization goals: 1) for 40% of all eligible AMI, TAVR, SAVR, CABG, and PCI (referred to as the “Main 5”) patients to attend at least one CR session within 90 days of their hospital discharge, and 2) for 10% of all eligible CHF patients to attend a single CR session within one year of a CHF-related hospitalization.

In developing these reports, MVC found that the collaborative-wide average participation rate within 90 days of discharge for the "Main 5" procedures was approximately 36%, below the statewide goal of 40%. Similarly, MVC’s analysis found 3.2% of eligible CHF patients participated within 365 days of discharge, 6.8% below the statewide MiCR goal of 10%.

The report also offers patient population demographics intended to help hospitals identify disparities in participation. Research evidence suggests that white males are more likely to utilize CR than women or patients of color, likely due to several socioeconomic and cultural factors. Hospitals are encouraged to consider any gaps showcased in their demographic snapshot and consider the provision of additional, tailored strategies that increase referral and participation among those patients.

Other high-level findings from the report included varying averages in CR participation by the procedure type. CABG and SAVR, more clinically invasive procedures, had the highest utilization rates at 54.9% and 51.3% respectively, whereas patients being treated for the chronic condition of CHF were the least likely to attend (3.2%). There is also wide interhospital variation in utilization rates for each procedure. For example, the collaborative-wide CR utilization rate after PCI is 32%, but hospital rates range from just above 10% to nearly 60% (Figure 1).
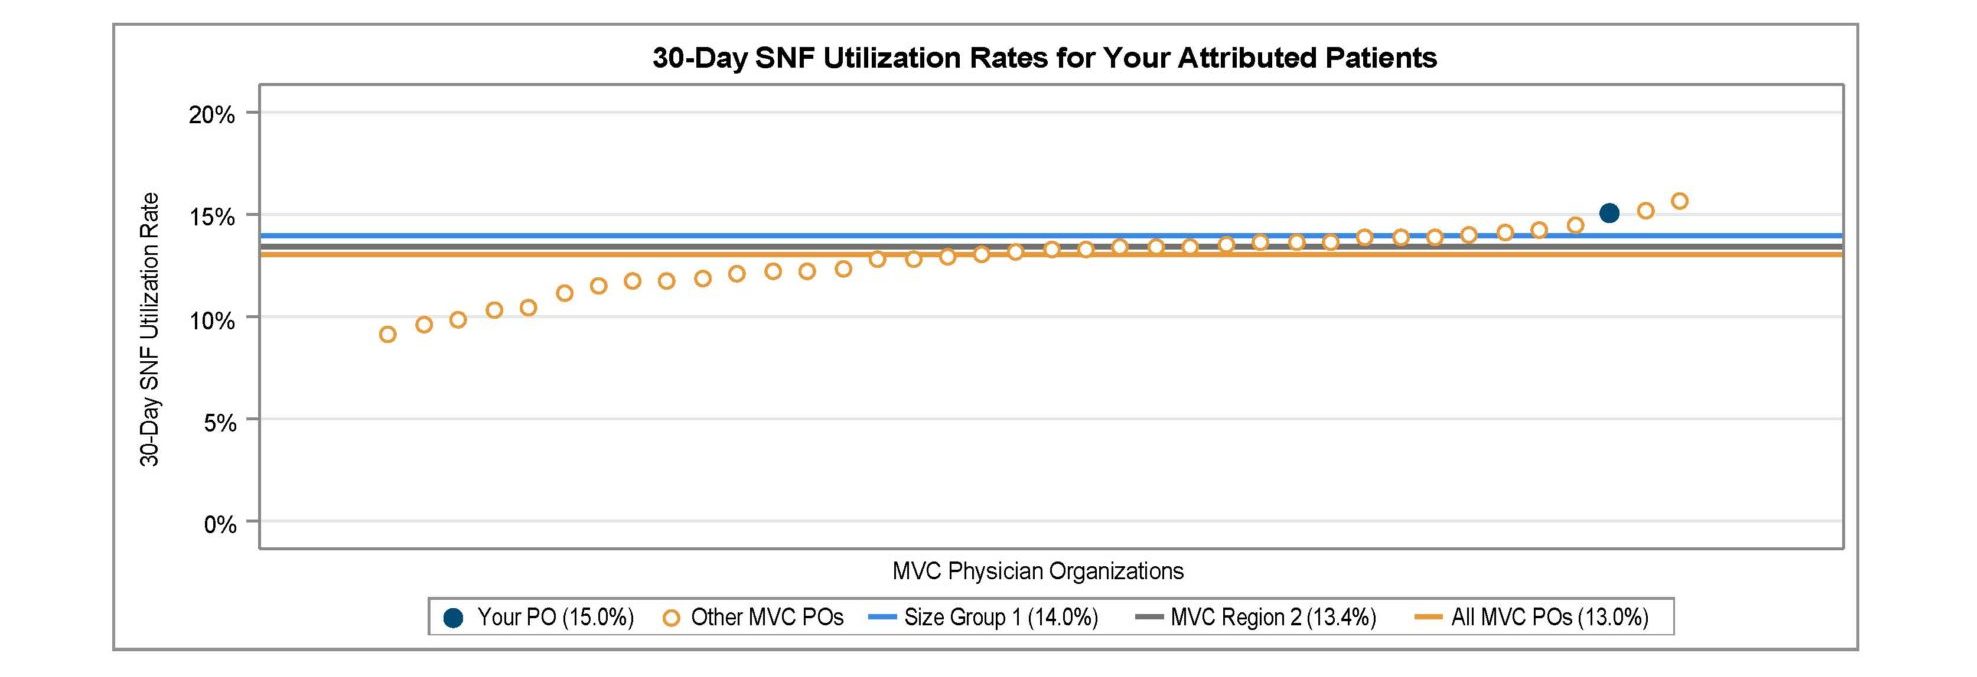
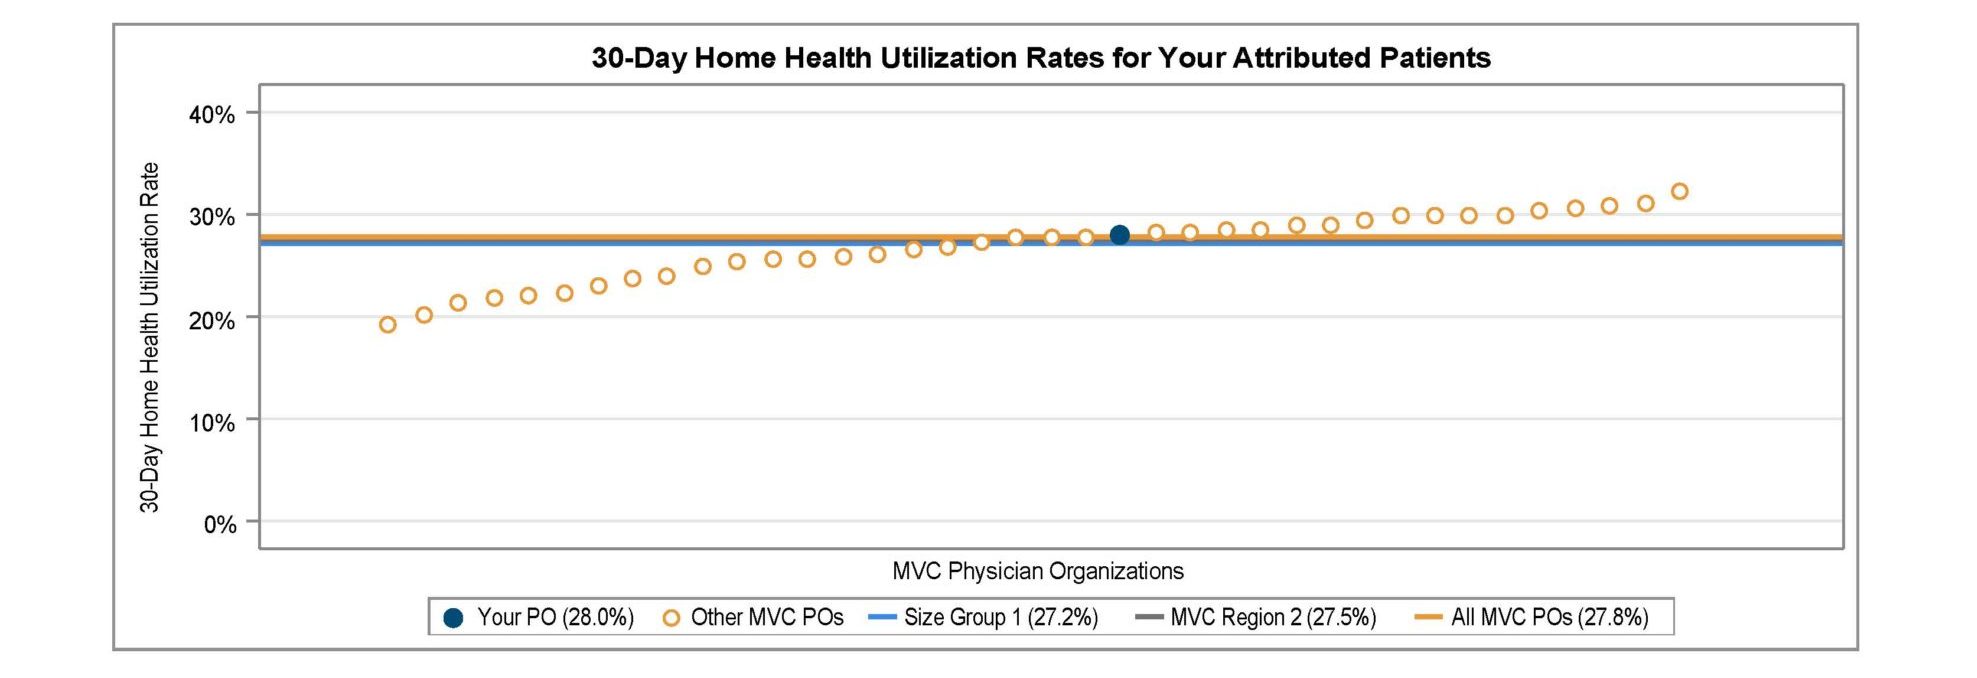
Figure 1.

This variation aligns with published research on hospital-level variation in CR referral, even after accounting for patient characteristics, insurance status, and clustering within operators and hospitals. It also demonstrates that quality improvement is possible, with multiple sites in the collaborative excelling.

Several of the Collaborative’s top-performing sites and experts worked together last year to develop the MiCR Best Practices Toolkit. It includes several evidence-based strategies for increasing enrollment and participation, with step-by-step guidance and resources. Among the various best practices, there are pages dedicated to automating inpatient referrals, early and flexible scheduling approaches, and strategies that help reduce participation barriers for patients (e.g., lack of transportation, lack of reimbursement for CR sessions, etc.).

MVC encourages those working in this space to save the date for the MiCR Fall Stakeholder Meeting in Ann Arbor on Friday, October 27, from 10 a.m. to 3 p.m. It is a valuable opportunity to connect with peers and experts who can offer support or resources. Please contact the MVC Coordinating Center if you are interested in attending and haven't received the event's Save the Date, or if you would like more details on this report and other upcoming CR events.