0
View Post
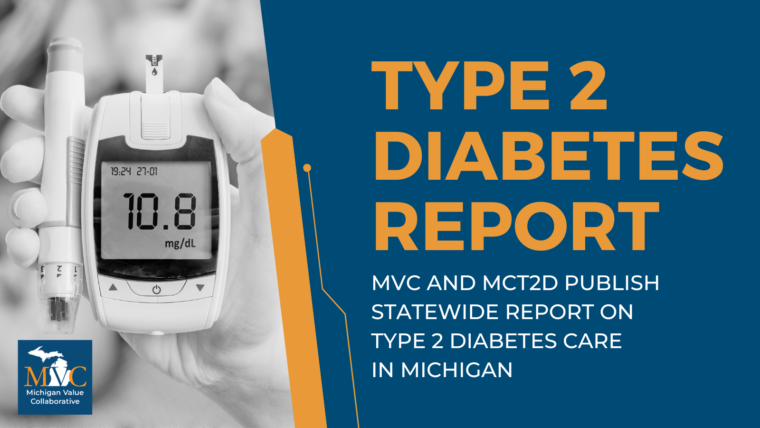
MVC, MCT2D Introduce New State-of-the-State Report on Type 2 Diabetes in Michigan

MVC, MCT2D Introduce New State-of-the-State Report on Type 2 Diabetes in Michigan

Chronic disease management was a key driver of healthcare utilization over the last decade and has been cited as the most expensive chronic disease in the U.S. In response, MVC recently partnered with the Michigan Collaborative for Type 2 Diabetes (MCT2D) to develop a statewide report on Type 2 Diabetes (T2D), a chronic illness that impacts over 1 million adults in Michigan. This new report was recently shared by both MVC and MCT2D at the Michigan Obesity Summit and will be distributed to MVC member hospitals later this week.

The report summarized demographics, healthcare utilization, and prescription patterns among those patients with T2D in Michigan insured by Blue Cross Blue Shield of Michigan (BCBSM), Blue Care Network (BCN), Medicare Fee-for-Service (FFS), and Michigan Medicaid between 2017 and 2023. To create this report, MVC first used its claims data to identify beneficiaries aged 18 and older with a qualifying T2D diagnosis in the past year. After identifying annual cohorts of beneficiaries with T2D for each year, 2017-2023, MVC assessed annual utilization of T2D prescription medications, emergency department (ED) visits, inpatient hospitalizations, and provider visits.

MVC assessed filled prescriptions among T2D beneficiaries with corresponding prescription coverage using its pharmacy claims. This was the first time MVC included prescription claims data in a member push report and the first time that prescription claims from all MVC payer sources were utilized in a single MVC analysis. Medicare beneficiaries were excluded from 2022 and 2023 prescription utilization rates because Medicare pharmacy claims were only available through 12/31/2021. Diabetes-related drug classes were identified in pharmacy claims based on National Drug Code (NDC) as well as standardized prescription names and classes.

Newer medications such as GLP-1 receptor agonists and SGLT2 inhibitors are frequently prescribed to improve glucose control, reduce mortality, slow kidney disease progression, and aid in weight loss. The American Diabetes Association now recommends the use of these medications for patients with cardiovascular disease, kidney disease, and obesity. In keeping with these guidelines, MVC’s analyses indicated a large increase in utilization of GLP-1 receptor agonists (3.1% to 18.6%) and SGLT2 inhibitors (2.3% to 14.2%) between 2017 and 2023 (Figure 1). In the same period, prescriptions decreased from 2017 to 2023 for insulins (20.9% to 16.5%) and sulfonylureas (17% to 10.9%).

Figure 1.

Demographic characteristics including age, sex, race (Figure 2), and insurance provider (payer) were described within the report for all beneficiaries with T2D across all payers 2017-2023 and compared to the characteristics of all beneficiaries reflected in MVC data during those years. Compared to all beneficiaries, those with T2D were older, with an average age of 66 years versus the average of 43 years among all beneficiaries. T2D beneficiaries were also more likely to be male (50% vs 43%), Black (20% vs 15%), and more often covered by non-commercial insurance plans (45% vs 28%).

Figure 2.

From 2017 to 2023, rates of diabetes-related ED visits and hospital admissions remained relatively infrequent among T2D beneficiaries. Around two percent of T2D beneficiaries visited an ED for a reason related to diabetes each year, and one percent were hospitalized in relation to diabetes. ED utilization unrelated to diabetes decreased from 37.4% in 2017 to 33.1% in 2023 among T2D beneficiaries (Figure 3). Hospital admissions unrelated to diabetes decreased from 21.3% to 16.4% (Figure 4).

Figure 3.

Figure 4.

In contrast, T2D beneficiaries saw primary care physicians, nephrologists, and endocrinologists more frequently between 2017 and 2023, with observed increases for all three provider types (Figure 5). Most notably, visit utilization with primary care providers increased from 18.3% to 32.9%. Nephrologist visit utilization increased from 1.2% to 2.2%, and endocrinologist visit utilization increased from 1.9% to 3.6%.

Figure 5.

This new report created in partnership with MCT2D provided a high-level overview of healthcare utilization among T2D beneficiaries within Michigan. Since the analyses utilized data derived from medical insurance claims, one key limitation was the exclusion of uninsured individuals as well as key indicators of T2D outcomes that are not accurately captured in claims data, such as HbA1C levels, blood pressure, continuous glucose monitor utilization, and retinopathy screening. Despite these gaps, the data revealed promising trends in diabetes care, including increased primary care visits, greater use of guideline-directed medications proven to show significant benefit, and reduced emergency department visits. MVC’s analyses also underscored areas for improvement, such as the need to address health equity gaps and continued promotion of guideline-directed medical therapy.

MVC will share copies of the completed report directly with members later this week, and a copy is also available on the MVC website [PDF]. If you are interested in pursuing a custom analysis for any of these measures or a different tailored custom analysis, please reach out to MVC.

0
View Post
MVC Service Day Highlights the Impact of Food Bank Partnerships on Healthcare Outcomes

MVC Service Day Highlights the Impact of Food Bank Partnerships on Healthcare Outcomes

MVC staff stepped out of their daily routines recently when they volunteered as a team at a local nonprofit organization. Eager to make this service opportunity as meaningful to their work as possible, MVC staff selected an organization with ties to health and well-being. Last month they were hosted by Food Gatherers, the food bank and food rescue program serving Michigan residents in Washtenaw County. MVC teammates worked together to sort rescued produce in the Food Gatherers warehouse, saving and packing 1,312 pounds of produce for the community.

Though MVC teammates were excited and impressed by that number, it pales in comparison to the amount of food processed by food banks like Food Gatherers, which last year distributed 7.3 million pounds of food — the equivalent of 6 million meals — through its network of partner programs. In order to collect and distribute all those meals, Food Gatherers maintains a working warehouse where an average of nine tons of food are processed each day, and a busy community kitchen prepares and serves hot meals seven days a week. Volunteers play a significant role in these operations.

Produce boxes and other foods that are processed by volunteers eventually find their way into the hands of over 170 community partners, such as food pantries or emergency groceries. In addition to distributing food, Food Gatherers also works to connect beneficiaries to SNAP and other federal food programs and provide innovative food distribution initiatives at area schools and clinics. A new area of focus is the cultivation of partnerships with healthcare providers to further identify and address food insecurity in the community.

Food Gatherers established its Health Care and Food Bank Partnership Initiative to create a connection between local healthcare institutions and Food Gatherers’ network of partner pantries. It was designed to increase access to food for community members in partnership with healthcare providers. Key activities of the initiative include establishing food insecurity screening and referral programs within primary care locations, training medical professionals such as residents and allied health professionals on the role of food security as a key social determinant of health, and drawing attention to the issue of hunger and healthy food access with healthcare providers.

This is a growing area of interest for food banks across the country since food insecurity is closely linked to poor health outcomes and increased risk of chronic disease. According to one study, in fact, the rate of Type 2 diabetes is 25% higher in adults who are food insecure. In addition, as many as one-third of patients with a chronic illness are unable to afford food, medications, or both. A recent publication using MVC data also found strong associations between chronic disease burden and financial outcomes.

Several components of the Food Gatherers Health Care and Food Bank Partnership Initiative were initially supported through a Michigan Medicine grant. Food Gatherers has worked with Michigan Medicine, Trinity Health St. Joseph Mercy Ann Arbor, and IHA as well as with community-based clinics such as the Hope Clinic, Packard Health, and the Corner Health Center. Though the grant ended in 2021, the larger concept of partnership between healthcare providers and community food banks is still an area of interest and opportunity.

"Food Gatherers has been working with our local health care partners to support and encourage the use of food insecurity screening in primary care settings,” said Markell Miller, MPH, Director of Community Food Programs at Food Gatherers. “When providers can identify food insecurity in a patient, they can help connect the individual to resources - specifically SNAP, or if it's an urgent need, a local food pantry. Hunger is a health issue, and when providers talk about food security, they reinforce the connection between nutrition and health, and also destigmatize the experience for individuals facing food insecurity. Our Hunger and Health Training program provides baseline information for physicians on food security as a social determinant of health, and how to support individuals facing food insecurity. We've focused on training medical residents going into careers in primary care, but there is an opportunity to train other providers to increase knowledge and comfort with food insecurity screening and referrals. We look forward to future opportunities to expand our partnership with health care providers, and also continue to seek sustainable funding solutions to support the network of healthy pantries that are available in our community."

Similar programs are also underway at other food banks across Michigan, such as Gleaners Community Food Bank of Southeastern Michigan. In 2015, Gleaners was one of three participating food banks in a two-year randomized controlled research study on the impact of food bank interventions on outcomes for patients with Type 2 diabetes. They have partnerships with the CHASS Center, Covenant Community Care, Henry Ford Health System, the Michigan Health Endowment Fund, the National Kidney Foundation of Michigan, and Trinity Health St. Joseph Mercy Livingston, and have thus far connected more than 500 patients with healthy food.

MVC recently invited Jessica Ramsay, MPH, Director of Wellness and Nutrition Education at Gleaners, to present at MVC’s upcoming chronic disease management workgroup on Thurs., April 20, from 2 - 3 p.m. The presentation will focus on partnerships between healthcare providers and community organizations, highlighting pilot programs and initiatives at Gleaners that improved both patient outcomes and healthcare utilization through reduced food insecurity. Registration for this workgroup presentation is open now.

To learn more about the food banks mentioned, please visit the websites of Food Gatherers and Gleaners Community Food Bank of Southeastern Michigan. Reach out to MVC if your hospital or PO has a similar partnership in place with a community-based organization – MVC would love to highlight this work.

To learn more about the ways in which food insecurity impacts health, check out the video below from Feeding America.

Illuminating Intersections: Hunger and Health (Feeding America)

0
View Post
Analysis Finds Strong Association Between Chronic Disease Burden and Financial Outcomes

Analysis Finds Strong Association Between Chronic Disease Burden and Financial Outcomes

The Commonwealth Fund recently reported that the U.S. continues to spend more on healthcare than other nations, and has the highest rate of people with multiple chronic conditions. Within this healthcare environment, many individuals are at risk of financial crises in part due to medical debt. MVC recently helped prepare a unique data set that linked its robust claims-based data with Experian’s commercial credit report data, resulting in an insightful analysis of the association between a patient’s chronic disease burden and their financial outcomes. The work was led by Nora Becker, M.D., Ph.D., and other colleagues from the U-M Institute for Healthcare Policy and Innovation, who published their analysis in JAMA Internal Medicine.

The financial burdens of illness can be due to the direct cost of medical care or the indirect effects of lost income due to illness. Many healthcare providers have first-hand anecdotes about patients who struggle to cover expenses necessary to manage their chronic condition, then avoid future healthcare services that lead to a worsening of their health or the development of additional chronic conditions. This negative feedback loop and the burden of medical debt are critical to understand so that healthcare leaders can adopt policies that improve financial outcomes for patients with chronic conditions.

Dr. Becker and her colleagues sought to understand the association between chronic disease diagnoses and adverse financial outcomes among commercially insured adults. Prior work in this area was limited, as researchers lacked data containing both clinical diagnoses and financial outcomes for the same individuals across a variety of chronic conditions. This time, however, MVC helped link patient data from its Blue Cross Blue Shield of Michigan (BCBSM) Preferred Provider Organization (PPO) claims to Experian credit data for the same patients’ financial histories. This data set was prepared for Dr. Becker and her colleagues, who performed the subsequent analysis and composed the resulting publication.

The 13 chronic conditions included in the analysis were selected for their prevalence, clinical importance, and association with financial challenges. These included cancer, congestive heart failure, chronic kidney disease, Alzheimer’s disease and other dementias, depression and anxiety, diabetes, hypertension, ischemic heart disease, liver disease, chronic obstructive pulmonary disease and asthma, serious mental illness, stroke, and substance use disorders.

The results of the analysis demonstrated a strong association between a patient’s chronic disease burden and adverse financial outcomes. For instance, among individuals with no chronic conditions versus those with 7 to 13 chronic conditions, the estimated probabilities of having medical debt in collections (7.7% vs 32%), nonmedical debt in collections (7.2% vs 24%), a low credit score (17% vs 47%) or recent bankruptcy (0.4% vs 1.7%) were all considerably higher for patients managing more chronic conditions (see Figure 1), with notable increases in rates of adverse financial outcomes between patients with no chronic conditions and those with 2 to 3 conditions or 4 to 6 conditions. Furthermore, among individuals with non-zero amounts of debt, the amount of debt increased as the number of diagnosed chronic conditions increased (see Figure 2). For instance, the adjusted dollar amount of medical debt increased by 60% from $784 for individuals with no chronic conditions to $1252 for individuals with 7 to 13 chronic conditions.

Figure 1. Predicted Probability of Credit Outcomes by Number of Chronic Conditions

Figure 2. Average Debt Among Individuals with Nonzero Debt by the Number of Chronic Conditions

In addition to finding an almost dose-dependent association between adverse financial outcomes and the presence of multiple chronic diseases, the analysis examined which conditions had the highest dollar amount of debt for the 10% of patients with medical debt in collections (see Figure 3). Congestive heart failure, stroke, substance use disorders, and serious mental illness racked up the most debt. Additionally, the probability of having medical debt in collections was substantially higher for patients managing serious mental illness or substance use disorders (see Figure 4).

Figure 3. Estimated Increase in Dollar Amount of Medical Debt in Collections by Type of Chronic Condition Among Individuals with Nonzero Medical Debt in Collections

Figure 4. Estimated Increase in the Probability of Having Medical Debt in Collections by Type of Chronic Condition

“We were expecting an association between adverse financial outcomes and chronic disease burden, but we were really struck by the magnitude and strength of the association that we found,” said Dr. Becker. “To see such a large increase in rates of adverse financial outcomes by chronic conditions really emphasizes that there is a crisis of financial instability among individuals with high chronic disease burden.”

Such significant variation across chronic conditions could be the result of several factors, such as some conditions requiring more costly treatments and high out-of-pocket expenses, and others making it more likely that patients miss work or cannot stay employed. The implications of such findings are impressive given the already high rate of patients with multiple chronic conditions—4 in 10 adults in the U.S. have more than one chronic condition—and the fact that poorer financial health is linked to more forgone medical care, worse physical and mental health, and greater mortality. Chronic conditions are already the leading causes of death and disability as well as the leading drivers of America’s $4.1 trillion in annual healthcare costs.

Dr. Becker and her colleagues were clear that their analysis did not determine causality—it is still unknown whether poor financial health leads to the development of chronic conditions or vice versa. Therefore, they advocated for the value of further analyses to determine underlying causes, which would inform how to approach improvements. The authors offered that if poor financial health causes additional chronic disease, then new social safety-net policies intended to reduce poverty rates may be beneficial. If chronic diseases are leading to poorer financial outcomes, then changes to the design of commercial insurance benefits could provide additional protections from medical expenses for costly chronic conditions.

“Additional work to determine the causal mechanisms of this association is crucial,” said Dr. Becker. “If we don’t figure out why this association exists, and who is most vulnerable, we can’t hope to design social policies to help protect patients from adverse financial outcomes.”

One of MVC’s core strategic priorities is intentional partnerships with fellow Collaborative Quality Initiatives (CQIs) and quality improvement collaborators. In the future, MVC hopes to do more with commercial credit report data given its unique uses and implications. It is the Coordinating Center’s hope that this work will help identify at-risk populations, understand how economic instability affects health outcomes, and generate insights that help working-age adults recover and return to work after major health events. The MVC team will continue exploring uses for this data in 2023 and engage its partner CQIs and collaborators to identify additional reporting opportunities for members.

As was recently highlighted in MVC’s 2022 Annual Report, MVC contributed to several other projects in the last 12 months similar to the analysis completed by Dr. Becker and her colleagues. MVC data and expertise also contributed to projects that resulted in new condition and report development, return on investment estimations for various healthcare initiatives, and additional insights on care delivery and patient outcomes. MVC will continue to identify partnerships and projects that leverage its rich data to achieve more sustainable, high-value healthcare in Michigan.

Publication Authors

Nora V. Becker, MD, PhD; John W. Scott, MD, MPH; Michelle H. Moniz, MD, MSc; Erin F. Carlton, MD, MSc; John Z. Ayanian, MD, MPP

Full Citation

Becker NV, Scott JW, Moniz MH, Carlton EF, Ayanian JZ. Association of Chronic Disease With Patient Financial Outcomes Among Commercially Insured Adults. JAMA Intern Med. 2022; 182(10): 1044–1051. doi:10.1001/jamainternmed.2022.3687.

0
View Post
MVC, MBSC Estimate Significant Diabetes Medication Savings Following Bariatric Surgery

MVC, MBSC Estimate Significant Diabetes Medication Savings Following Bariatric Surgery

Diabetes is commonly cited as the most expensive chronic disease in the U.S., accounting for over $37 billion in 2017. As many as 1 in 10 Americans have been diagnosed, 90-95% of whom have Type 2 diabetes. Management of Type 2 diabetes involves healthy eating, physical activity, and often taking medication prescribed by a doctor, such as insulin, other injectable medications, or oral diabetes medicines to help manage blood sugar. It is both clinically and economically significant, then, that the Michigan Value Collaborative (MVC) was recently part of an analysis that estimated over $76.5 million in insurance savings on prescription diabetes medications after patients underwent metabolic surgery.

MVC identified these savings in partnership with the Michigan Bariatric Surgery Collaborative (MBSC) last year and published their findings in a co-authored research letter in JAMA Surgery. This work was featured recently by the medical news site Medpage Today.

The partner project was initiated by MBSC in 2022 to help assess the impact of bariatric surgery on prescription fills for diabetes medications across the state of Michigan, driven largely by existing evidence in the literature that bariatric surgery resolved or improved Type 2 diabetes symptoms in a large proportion of patients (Varban et al., 2022). MBSC is a regional group of hospitals and surgeons that aim to innovate the science and practice of metabolic and bariatric surgery through comprehensive, lifelong, patient-centered obesity care.

Using its rich administrative claims data sources, the MVC team first analyzed pre-surgery and post-surgery receipt of diabetes medications, which was then used to estimate a high-level snapshot of the overall impact across Michigan. MVC's analysis included estimated cost savings to health insurance providers that could be attributed to a decrease in post-surgery diabetes medication prescription fills.

The analysis used bariatric surgery episodes for Roux-en-Y Gastric Bypass (RYGB) and sleeve gastrectomy hospitalizations. It was limited to bariatric surgery patients with a diagnosis of Type 2 diabetes who filled an outpatient diabetes medication prescription prior to their discharge. The analysis focused on episodes with index admissions between 2015 and 2021 for Blue Cross Blue Shield of Michigan (BCBSM) PPO Commercial and BCBSM Medicare Advantage plans for individuals who were continuously enrolled in a prescription sub-plan. This amounted to 760 patients with Type 2 diabetes undergoing gastric bypass (22%) or sleeve gastrectomy (78%) between 2015 to 2021.

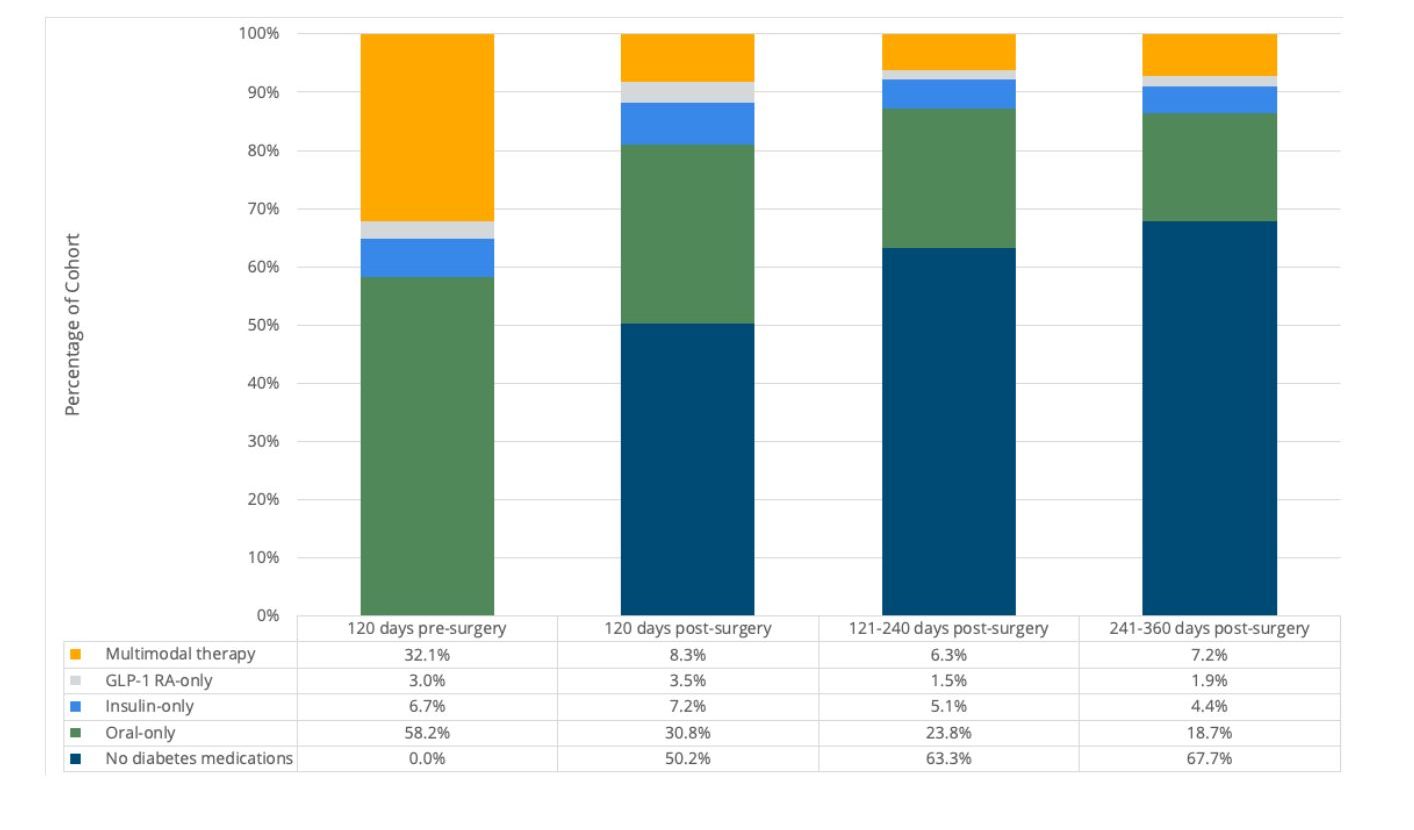
In the 120 days prior to surgery, MVC found that 88% of patients filled an outpatient oral diabetes medication prescription, 30% filled an insulin prescription, and 21% filled a GLP-1 receptor agonist prescription. From the 120 days pre-surgery to the 120 days post-surgery, there was a significant decrease in fills for any diabetes medication (p<.001). The most frequent change in medications between pre- and post-surgery was from oral diabetes medication to no diabetes medication. In the 1 to 120 days following surgery, half (50%) of patients filled no diabetes medication prescriptions, and in the 121 to 240 days following surgery, most patients (63%) filled no diabetes medication prescriptions (see Figure 1).

Figure 1.

This amounted to an average decrease in diabetes prescription payments made by the insurance provider of approximately $4,133 per patient in the first year following surgery. Given that 34% of bariatric surgery patients have diabetes and 54,454 bariatric surgeries were performed in Michigan between 2015 and 2021, MVC estimated that insurance providers in Michigan saved $76.5 million on diabetes medications in the 360 days following bariatric surgeries in 2015-2021. In addition, data suggest that savings would continue to increase in future years due to long-term diabetes remission and cost benefits from optimized diabetes management. These results provide evidence of significant statewide clinical outcome improvement and cost savings for Type 2 diabetes following bariatric surgery.

These findings and their implications were also highlighted recently during an MVC workgroup featuring Dr. Oliver Varban of MBSC as the guest speaker. See below for a complete recording of his insightful presentation about bariatric surgery, its impact on chronic disease management, and more.

MVC’s expertise and data frequently result in partner projects like this; MVC completed three other CQI impact assessments last year (Figure 2). These projects are an example of MVC’s interest in CQI collaboration, which is also demonstrated through new condition and report development, data analysis and metric consultation, and data matching exercises that pair clinical and claims-based data.

Figure 2.

To request a copy of any of MVC’s completed impact assessments from 2022 or prior, please contact the MVC Coordinating Center.

0
View Post
Healthy Weight Awareness Month Inspires Workgroup Collaboration

Healthy Weight Awareness Month Inspires Workgroup Collaboration

This January, healthcare organizations and advocacy groups across the country are promoting Healthy Weight Awareness Month, as well as innovations in weight loss procedures. In alignment with this national conversation, MVC recently hosted its first workgroup of 2023 with a guest presentation by Oliver Varban, MD, FACS, FASMBS, Associate Director at the Michigan Bariatric Surgery Collaborative (MBSC), about obesity in Michigan, the main challenges of treatment, and how MBSC uses data to improve surgical management outcomes. The aim of such workgroups is to impart relevant data, best practices, and success stories for the benefit of MVC members and partners working in that clinical area.

According to data from CDC, the prevalence of obesity increased from 30% to 42% over the past 20 years, with 41% of Americans currently considered clinically obese. Excess body weight is associated with many different conditions and comorbidities (e.g., certain types of cancer, heart disease, diabetes, and stroke) and is a risk factor for increased severity and fatality of various conditions, such as those who experienced more severe illness from COVID-19 infection. Clinical management interventions range from screening and lifestyle changes to medication and surgery.

Identification and treatment of obesity often begins by measuring a patient’s body mass index (BMI), an estimate of body fat based on height and weight. The CDC uses BMI to measure obesity, but this measure falls short in several ways. For one, the accuracy of the measurement is lower among men, the elderly, and those in the intermediate BMI ranges. In addition, racial groups experience differing levels of disease for a given BMI. On its own BMI is not an accurate predictor of health. There are also a number of complex connections to social determinants of health since patients residing in environments with more limited access to healthy food and physical activity often have higher BMIs.

MBSC has been working to support quality improvement in healthy weight management since 2005 and aims to innovate the science and practice of metabolic and bariatric surgery through comprehensive, lifelong, patient-centered obesity care. MBSC utilizes its extensive clinical registry data to generate tools that support clinicians and patients in decision-making, including several patient- and provider-facing tools that outline a patient’s likely risks, benefits, and costs for various treatment pathways.

Given obesity’s prevalence and association with other chronic conditions, improved outcomes for patients managing obesity have far-reaching implications. Therefore, MVC and MBSC partnered last year to measure the value of bariatric surgery in treating diabetes, one of the most common and costly chronic conditions. According to the American Diabetes Association, $1 in $7 healthcare dollars are spent treating diabetes and its complications, and patients diagnosed with diabetes face 2.3 times the average person's healthcare costs. The analysis performed by MVC and MBSC was largely driven by existing evidence in the literature that bariatric surgery resolved or improved Type 2 diabetes symptoms in a large proportion of patients (Varban et al., 2022). Using its rich administrative claims data sources, MVC helped analyze pre-surgery and post-surgery receipt of diabetes medications, which was used to estimate the overall impact across Michigan and its estimated cost savings due to a decrease in post-surgery diabetes medication prescription fills.

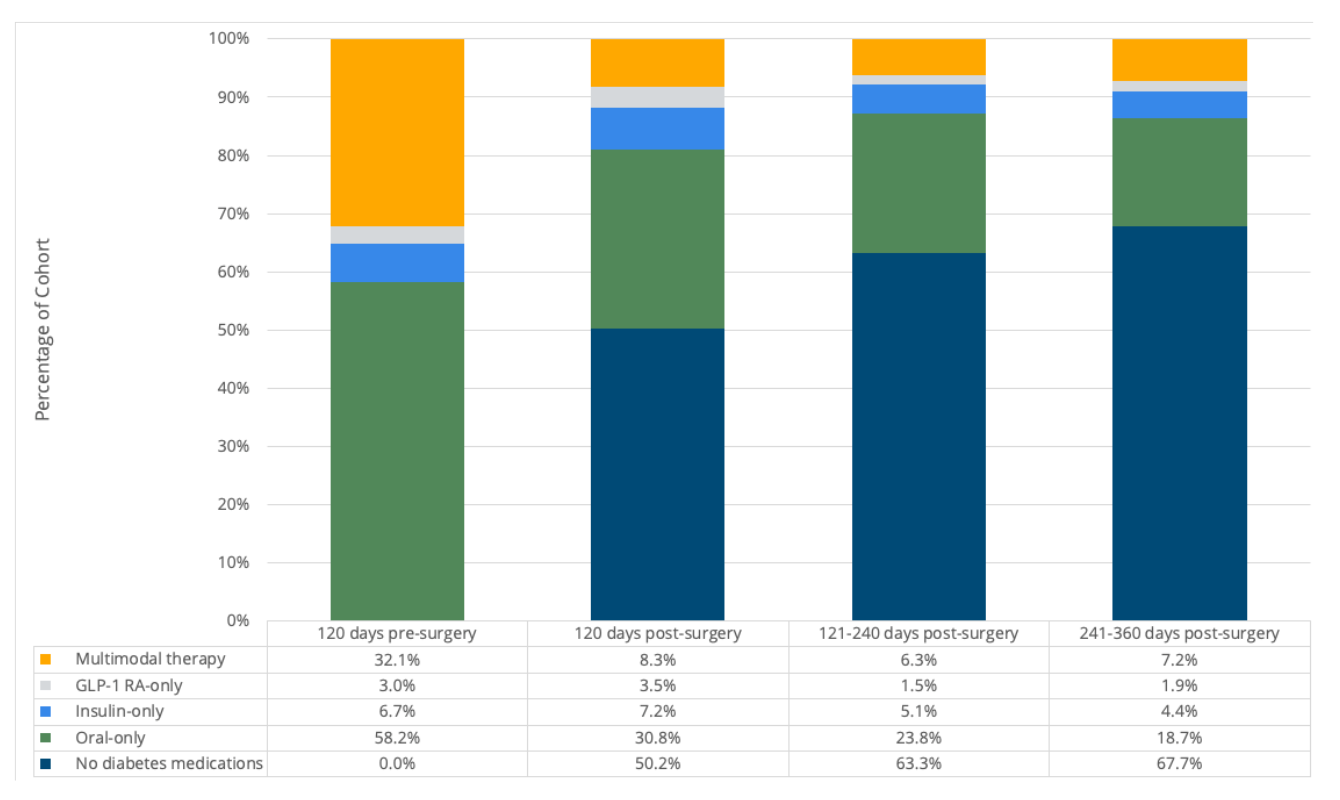
The most impressive finding of the analysis was a significant decrease in the percentage of bariatric surgery patients who filled any diabetes prescription post-surgery (Figure 1), with over 50% of patients who previously used diabetes prescriptions taking no medications within 120 days post-surgery. This amounted to an annual cost savings of about $4,133 per patient. Five years post-surgery, the continued estimated cost savings from reduced reliance on prescriptions ($20,665) surpassed the average price-standardized total episode cost of bariatric surgery ($14,832). These results provide evidence of statewide clinical outcome improvement and cost savings for Type 2 diabetes following bariatric surgery. A summary of this return-on-investment analysis was developed and publicized by MBSC and MVC in August 2022.

Figure 1.

This analysis was also evidence of the opportunities for cross-collaboration and information sharing in obesity care—between primary care providers, chronic disease management care teams, and bariatric surgeons; between collaborative quality initiatives with varying clinical, value-based, and socioeconomic focuses; and between providers, their patient, and their patient’s families. Obesity is a clinical diagnosis with extensive social complexities and implications for one’s physical and mental health. Improving support and care for those in seek of treatment requires intentional, innovative collaboration.

The complete recording of Dr. Varban’s recent MVC Health in Action workgroup presentation and the discussion that followed are available on MVC’s YouTube channel. Those with questions about any of the above-mentioned materials or analyses are welcome to contact the MVC Coordinating Center at Michigan-Value-Collaborative@med.umich.edu. MVC’s next workgroup takes place on Tues., Jan. 24, from 11 a.m. - 12 p.m., featuring a guest presentation by Karla Stoermer Grossman, MSA, BSN, RN, AE-C, Clinical Site Coordinator at the Inspiring Health Advances in Lung Care (INHALE) Collaborative Quality Initiative. Register to join us and hear about INHALE’s approach to improving outcomes for patients with asthma and chronic obstructive pulmonary disease.

0

MVC Launches New Push Report on ED and Post-Acute Care Use

The emergency department (ED) is a unique and critical component of the healthcare system in the U.S., treating acute injuries or illnesses and acting as a safety net for patients who are uninsured or low income. ED visits are also very expensive, and that spending is growing according to a recent retrospective study of ED trends. This week the Michigan Value Collaborative (MVC) is distributing its newest push report on ED and post-acute care (PAC) utilization to support members' efforts in this space.

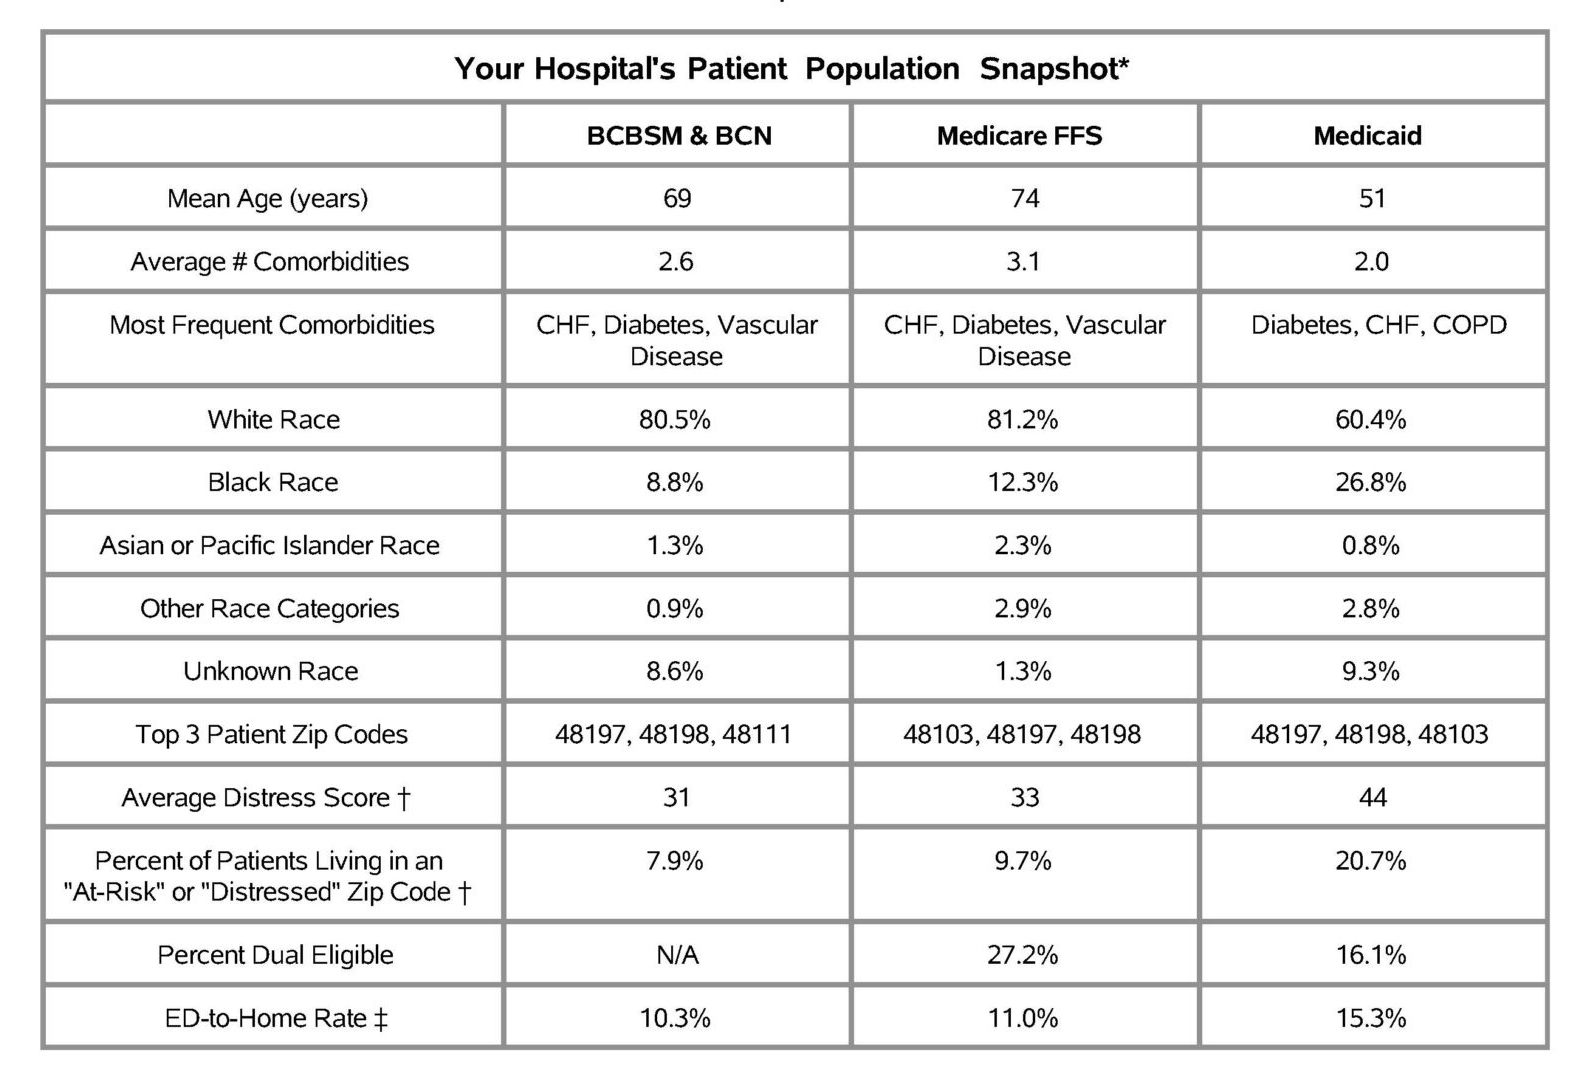
Since the ED serves as a safety net for patients experiencing barriers to healthcare access, the Coordinating Center report purposefully integrates measures tied to social determinants of health and health equity. Reports contain a patient population snapshot table showcasing several patient characteristics by payer (see Figure 1), including age, race, comorbidities, zip code, dual-eligibility status, and economic distress scores. Dual-eligible patients are those who qualify for both Medicaid and Medicare; these patients tend to have a higher prevalence rate for chronic conditions, disabilities, and other care needs that substantially increase healthcare utilization.

Figure 1.

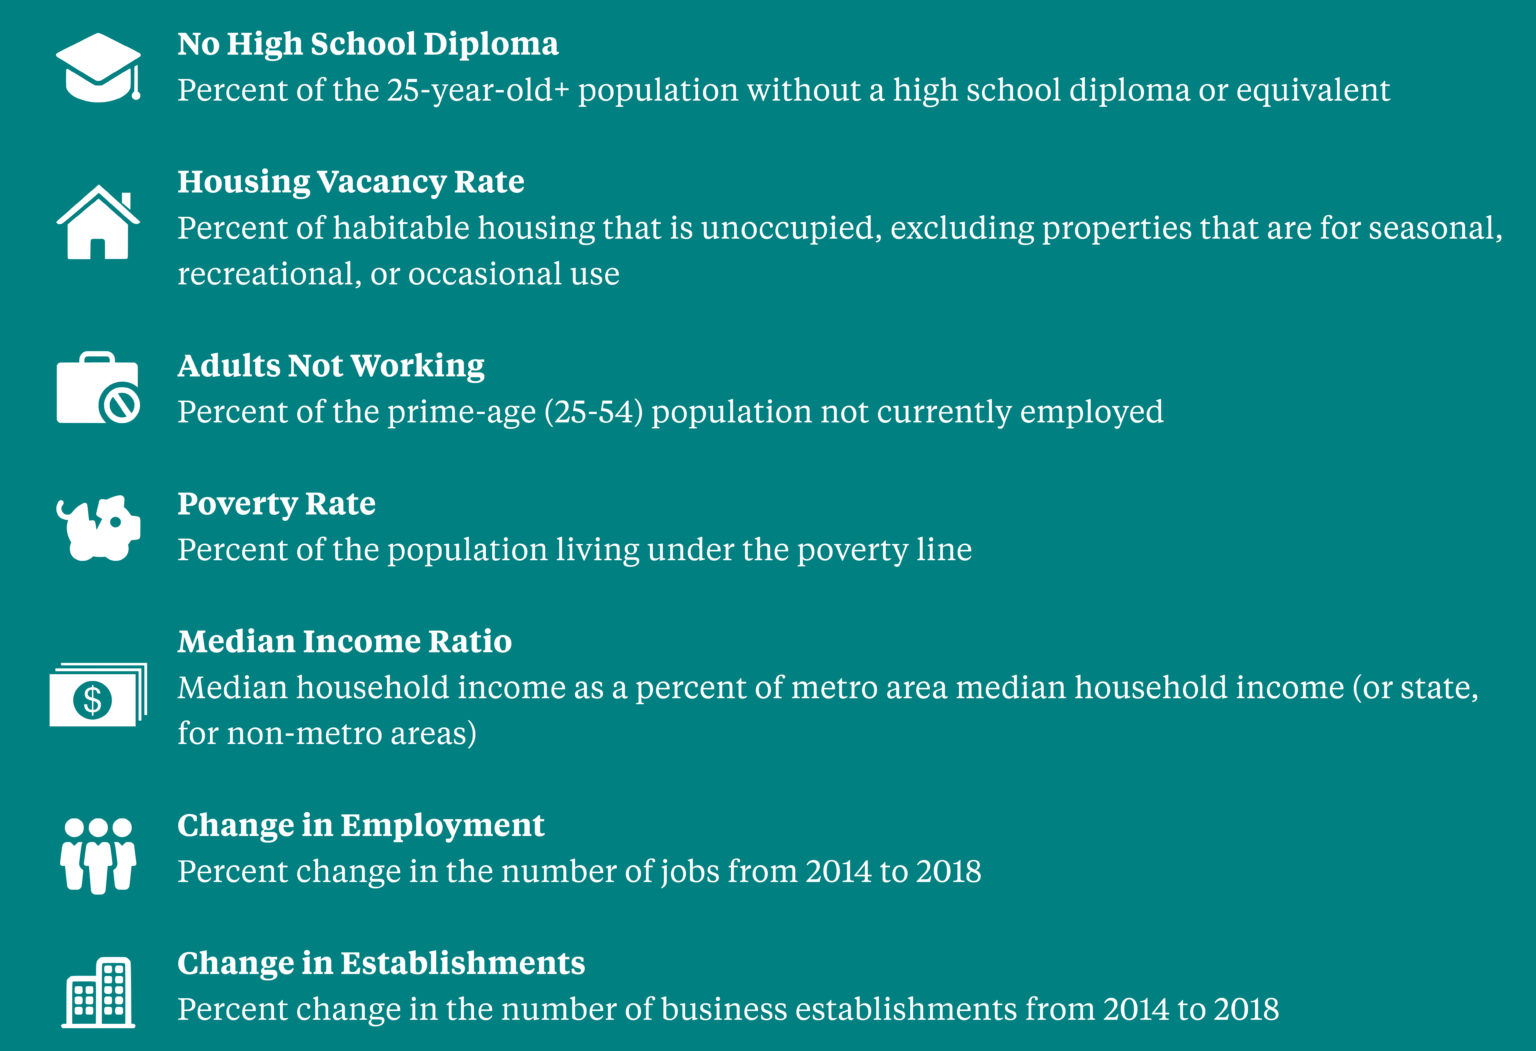
Economic distress scores range from 0-100 with a higher score indicating greater economic distress. These scores come from the Economic Innovation Group’s Distressed Communities Index (DCI), which is derived from the U.S. Census Bureau’s Business Patterns and American Community Survey. The DCI combines seven complementary economic indicators (see Figure 2) to provide a single, holistic, and comparative measure of economic well-being across communities in the U.S. In MVC’s report, there is a proportion of patients living in an “at-risk” or “distressed” zip code across all payers, as classified by the DCI. However, as the literature often indicates, the Medicaid population has the highest average distress score and a larger proportion of patients living in an “at-risk” or “distressed” zip code.

Figure 2.

The bulk of MVC’s latest report aims to provide its members with more granular insights into PAC utilization in the 30-day post-discharge period than is available on the MVC registry. Using index admissions for medical conditions from 1/1/18 through 12/31/20, the report focuses predominantly on ED utilization, which is categorized as either “ED to Home” or “ED to Readmission.” ED to Home represents ED visits that do not occur on the same day as readmission, and ED to Readmission refers to those visits occurring on the same day as readmission.

The report includes figures illustrating trends in 30-day ED to Home rates between 2018 and 2020, top reasons for ED visits at a given hospital, the number of ED to Home visits within 30 days post-discharge, the number of days until the first ED visit post-discharge, the ED to Home rate and the breakdown of total PAC spending for a hospital’s three highest-volume conditions, and the average ED facility payment. MVC included the following payers in this report: Blue Cross Blue Shield of Michigan (BCBSM) PPO Commercial, BCBSM Medicare Advantage (MA), Blue Care Network (BCN) HMO Commercial, BCN MA, Medicare Fee-for-Service, and Medicaid.

Overall, the MVC report confirms published findings that Medicaid patients utilize the ED at a higher rate than patients insured by other payers. The Coordinating Center also finds that ED use differs between types of providers. For acute care hospitals, for example, over half of ED visits occur on the same day as readmission, whereas these visits account for 40% at Critical Access Hospitals (CAHs).

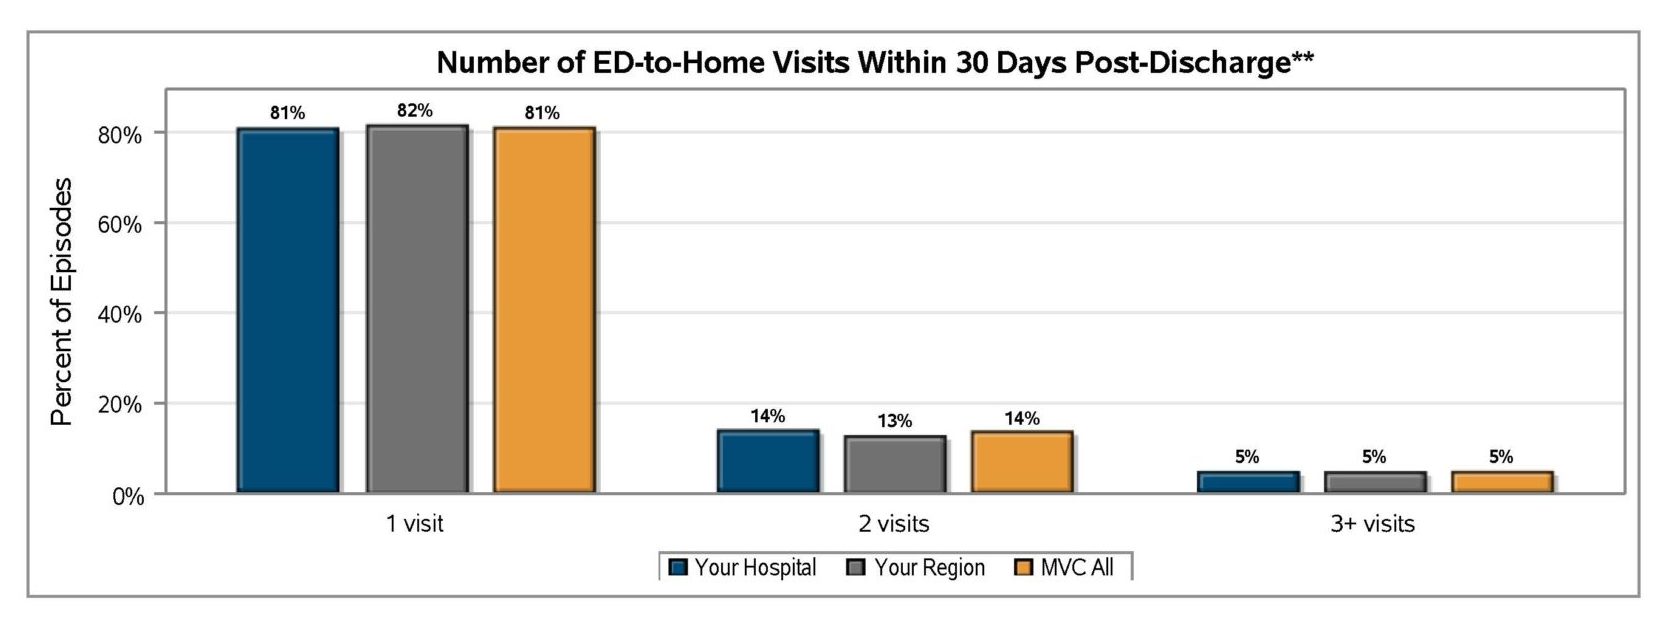
MVC also finds that ED to Home visits most often occur once in the 30 days following discharge for most of the collaborative (see Figure 3). There are some members, however, with three or more ED to Home visits within the 30-day post-discharge period.

Figure 3.

The Coordinating Center envisions this report being of particular importance to its CAH members, whose structures, services, and patient populations make the ED and PAC a top priority. As such, MVC prepared versions of this report for both CAHs and acute care hospitals using their respective comparison groups throughout. In other words, the CAH version of the report includes comparison points for all other CAHs in the collaborative. Acute care hospitals can see their traditional collaborative-wide and regional comparison data, not including hospitals with a CAH designation.

As members review and discuss the findings in their report(s), MVC encourages providers to utilize the Michigan Emergency Department Improvement Collaborative (MEDIC), which is dedicated to improving the quality of ED care across the state of Michigan. In addition, if members wish to discuss additional custom analyses on ED and PAC utilization, please contact the MVC Coordinating Center at michiganvaluecollaborative@gmail.com.

0
View Post
MVC’s Latest CDM Push Report Reframes Focus to Follow-Up Care

MVC’s Latest CDM Push Report Reframes Focus to Follow-Up Care

The Michigan Value Collaborative (MVC) distributed its chronic disease management (CDM) push report recently, which has been refreshed and reframed from its previous iterations. Originally termed the CDM congestive heart failure (CHF) report and the CDM chronic obstructive pulmonary disease (COPD) report, the new “CDM follow-up report” focuses more specifically on follow-up care after hospitalization for the two conditions.

The newest version aims to provide additional granularity into follow-up care at member hospitals by showcasing variability across different windows of time, across payers, and by type. MVC defines follow-up as episodes where a patient had an outpatient follow-up visit (in person or by telehealth) within 30 days or before a readmission, inpatient procedure, emergency department visit, skilled nursing facility admission, or visit for inpatient rehabilitation.

The report features a new patient population snapshot table that highlights demographic data. These tables (see Figure 1) provide each hospital with demographics for their CHF/COPD patient populations, including race, mean age, the average number of comorbidities, and the proportion of patients who are dual-eligible.

Figure 1.

MVC hospitals will see comparisons to their peers on 7-day, 14-day, and 30-day outpatient follow-up rates, as well as 30-day risk-adjusted total episode payments and 30-day outpatient follow-up rates stratified by payer. Members will also see their individual hospital’s breakdown of follow-up types at 30 days, and trends over six months for 3-, 7- and 14-day rates.

Each figure presented reflects index admissions from 1/1/18 – 12/31/20 for Blue Cross Blue Shield of Michigan (BCBSM) PPO Commercial, Blue Care Network (BCN) Commercial, BCBSM PPO Medicare Advantage, BCN Medicare Advantage, Medicare Fee-For-Service, and Medicaid. Hospitals received report pages for each condition if they met the threshold of at least 11 episodes in each year of data for that condition.

There was wide variation in follow-up rates across the collaborative, with member follow-up rates ranging from less than 40% after 30 days to approximately 80% (see Figure 2). In addition, 30-day follow-up rates were lowest within the Medicaid patient population with an MVC average of 58% (see Figure 3); the collaborative-wide averages for 30-day follow-up among BCBSM/BCN and Medicare patients were 76% and 73%, respectively. It was also the case that most patients (92% on average) received follow-up care in person as opposed to a remote or hybrid option (see Figure 4).

Figure 2.

Figure 3.

Figure 4.

The CDM follow-up report was distributed in partnership with the Integrated Michigan Patient-Centered Alliance in Care Transitions (I-MPACT) Collaborative Quality Initiative (CQI). I-MPACT is a unique patient-centered, data-driven collaborative that engages hospitals and provider organizations throughout Michigan in developing and implementing innovative approaches for improving care transitions. They work to improve the transition of patients between care settings with the goal of bettering outcomes and reducing readmissions.

In addition to partnering with I-MPACT to expand the report’s reach, MVC also partnered with a CQI to provide members with supplemental materials that may be relevant to their work with CHF/COPD patients. The Healthy Behavior Optimization for Michigan (HBOM) CQI provided tobacco cessation materials that were shared alongside the MVC report, including a Quit Smoking Resource Guide and Quit Smoking Medication Guide. HBOM aims to ensure that all smokers who are interested in quitting receive the support and resources they need to be successful. Read more about HBOM’s materials and efforts in MVC’s May CQI spotlight blog.

In addition to continuing to offer its CDM push report, the MVC Coordinating Center offers a bimonthly CDM workgroup. The next workgroup will take place on Tuesday, July 12 from 1-2 p.m., and will feature a presentation about the Sparrow Pain Management Center’s Care Management Program. Please register today to join the MVC Coordinating Center for this presentation and discussion.

If you have any suggestions on how these reports can be improved or the data made more actionable, the Coordinating Center would love to hear from you. MVC is also seeking feedback on how collaborative members are using this information in their quality improvement projects. Please reach out at michiganvaluecollaborative@gmail.com.

0

Special Consideration Needed for Older Patients Using Telecare

When most people think about healthcare, the images that come to mind include a trip to their local provider’s office, lab, or hospital for services such as physicals, blood tests, and procedures. However, medical professionals and their patients are increasingly transitioning to more remote services that leverage our advances in communication technologies, resulting in the burgeoning “tele” world of healthcare. But are these services reaching everyone?

Telemedicine, telehealth, and telecare are three examples of remote, interactive services that allow patients to receive healthcare from within their own homes. Although these terms are often used interchangeably, they in fact refer to different aspects of healthcare delivery. Telemedicine applies to physicians who use technology to support the delivery of medical, diagnostic, or treatment-related services. Telehealth is like telemedicine but applies to a broader collection of providers, such as nurses or pharmacists. Telecare (see Figure 1) is generally more consumer-oriented by providing the patient with technology to manage their own care safely from home, such as health apps or digital monitoring devices.

Figure 1. Telecare Slide from MVC Workgroup Presentation

The adoption of “tele” services saw incredible growth in 2020 in response to the pandemic. A report found that Medicare telehealth visits increased 63-fold recently, from 840,000 in 2019 to 52.7 million visits in 2020. However, now that adoption of these services (and the platforms needed to host them) are more commonplace, providers are asking whether it benefits their most vulnerable patients and who may be left behind.

These questions drove the discussion of the most recent MVC workgroup on chronic disease management. Over the course of the session, attendees were particularly interested in how telecare improves elderly care, and whether patients over the age of 65 could adequately access such services. For those older adults utilizing telecare, evidence from the ongoing COVID-19 pandemic identified convenience and affordability as telecare’s primary strengths. In addition, research evidence suggests that the two most effective telecare interventions in this population are automated vital sign monitoring and telephone follow-up by nurses.

Some of the challenges often cited for this population include lack of appropriate internet access or devices, limited digital literacy, medical conditions that may impede participation (i.e., hearing or vision impairments, dementia, etc.), and the need to regularly monitor vitals in very high-risk patients. Although the authors compiling these challenges specifically reference older adults, they could just as easily apply to people experiencing poverty, people with disabilities, and people with more limited language and literacy skills.

Some recommended strategies to address common challenges include tablet delivery services, “mobile medical assistants” who perform video set-up for the patient, assistance from an on-site caregiver, practice or “mock” video visits prior to the appointment date, partnerships with community health workers to support or train patients in their homes, and providing self-monitoring devices. Other simple considerations include the size of the text displayed on the page (use larger text to enhance readability), providing adequate instructions in advance and in multiple languages, and engaging experts in user experience design.

In addition to these considerations, some researchers suggest that, in general, the adoption of new technologies can be predicted in part by Everett Rogers’ Diffusion of Innovation Theory. One study incorporating this theory found that the chances of telecare adoption were highest for three types of older adults: those already receiving long-term or nursing care, those living alone, and those who have fixed daily telecare points of contact.

Increased integration of technology in healthcare is inevitable as advancements continue and we shift to a more digital world. Since the number of people in the U.S. who are age 65 or older will more than double over the next 40 years, it is imperative that older adults are not left behind when transitioning to such services. Rather than fear the challenges, researchers and practitioners are seeking ways to find solutions and help all patients benefit from healthcare access within their own homes.

The MVC Coordinating Center encourages its members to collaborative with one another to benefit from peers’ success stories and lessons learned. If your hospital or physician organization has developed an age-friendly telecare protocol, please consider sharing your story with the MVC Coordinating Center at michiganvaluecollaborative@gmail.com. To catch up on the recent MVC workgroup discussion about telecare, watch the chronic disease management workgroup recording here.

0

The Behavior Change Puzzle of Medication Non-Adherence

Non-adherence to a prescribed medication regime for chronic disease management is known to lead to poor health outcomes and higher healthcare costs. A number of studies have shown that adherence is usually around 50% or less, even when medications are provided free of charge. What seems to be less clear is how best to address poor adherence; one study points out that most of the current interventions meant to improve adherence rates are too complex or ineffective, and that the research in this field is rife with weaknesses and bias.

But as with most quality improvement initiatives, understanding the source of the problem is an important first step. In this case, identifying the reasons for non-adherence is an important starting point for reducing barriers and improving patient outcomes. Many factors may affect whether a person takes their medications, including the patient themselves, the disease being treated, the health system and team, and the type of therapy involved. One study’s survey of 10,000 patients found that the most cited barrier to taking one’s medications was simply forgetfulness (24%). This was followed by perceived side effects (20%), high drug costs (17%), and a perception that their prescribed medication will have very little effect on their disease (14%).

The same study illustrated the various patient, provider, and external factors that can play a role in medication adherence using the figure below (Figure 1). If any one of these factors were to present a challenge for the patient, then they are at risk of not taking their prescribed medications on time and any related medical issues.

Figure 1.

While some interventions such as pill box aids and electronic reminders have helped patients when forgetfulness is the issue, these do not address factors such as concerns about side effects and medication-related harm, or uncertainty about the importance of taking long-term prescribed medications. These issues have the potential to be addressed through shared decision-making and education from clinical experts such as pharmacists and nurses.

One review analyzed the impact that social determinants of health has on medication adherence. Disadvantageous circumstances in social and living conditions are associated with an increase in chronic disease, and it is believed that these same challenges impact a person’s ability to manage their health. When an individual is facing food insecurity, unemployment, and unstable living conditions, they are sometimes unable to address their health concerns emotionally or financially. The review found that medication adherence was negatively impacted by food insecurity and housing instability, although few studies identified other specific social determinants that influence non-adherence to medications beyond these two. In fact, education, income, and employment status did not significantly correlate with adherence to a medication regime.

The Michigan Value Collaborative (MVC) would like to hear how your institution is addressing medication non-adherence, especially in the chronic disease patient population. This will be an upcoming topic at a chronic disease management workgroup. Please contact MVC at michiganvaluecollaborative@gmail.com for information about attending.

0

Continuous Glucose Monitoring Has Potential in Inpatient Setting

One of the most prevalent comorbidities in the United States is diabetes; as many as 1 in 10 Americans are diagnosed with this condition, and 90-95% having potentially preventable Type 2 diabetes. It is well documented that unstable blood glucose levels can contribute to increases in morbidity, mortality, and healthcare costs.

In the inpatient setting, the current standard of care for monitoring and testing blood glucose levels in diabetic patients is point-of-care (POC) testing, which combines a specific testing schedule and approved devices to measure blood glucose levels. A recent study involving 110 adults with Type 2 diabetes looked at implementing real-time continuous glucose monitoring (RT-CGM) in order to better manage inpatient glycemic levels. The patients were on a non-intensive care unit (ICU) floor, and received either the standard of care or the RT-CGM with Dexcom G6 monitoring—where a tiny sensor wire is inserted just beneath a person’s skin using an automatic applicator. Data was transmitted from the bedside wirelessly, and monitored by hospital telemetry. The bedside nurses were notified of any abnormal glucose levels or trends and the patients were treated accordingly. The results indicated that patients in the RT-CGM group demonstrated lower mean glucose levels and less time in hyperglycemia.

Another study that evaluated the efficacy of RT-CGM discussed the effect that uncontrolled glycemic levels can have on clinical outcomes and healthcare costs. Currently, hospitals use POC glucose testing in order to monitor and treat hypoglycemia, and it is recommended that POC testing occur four to six times per day. However, this leaves many hours throughout the day where hypoglycemia can go undetected. RT-CGM using a glucose telemetry system (GTS) offers an alternative method to monitor these glucose values. A total of 82 patients participated in this study. Patients in the RT-CGM group experienced 60.4% fewer hypoglycemic events compared to the POC group. Figure 1 below illustrates the number of hypoglycemic events per patient for both the CGM/GTS and the POC.

Figure 1.

RT-CGM has yet to be implemented in inpatient settings for several reasons. The primary reason is the lack of U.S. Food and Drug Administration (FDA) approval. Additionally, institutional challenges may act as a significant barrier. For instance, staff need to be prepared for increased workload and educated on appropriate protocols and procedures. Technological support is required to ensure hardware compatibility and maintain a robust internet network with minimal interference in transmission of results and alerts. Additional factors within the hospital setting include certain medications, procedures, nutrition, acute illness, and any other condition that may affect glucose control. All of these challenges have the potential to impact CGM and its associated workload because of the effect they may have on the patients’ blood glucose levels. Although challenges remain to the implementation of RT-CGM in the inpatient setting, the benefits may outweigh the risks; thus, it is worth considering, especially given the successes in the outpatient arena.

The Michigan Value Collaborative hosts diabetes workgroups where topics such as continuous glucose monitoring are discussed by Collaborative members. If you are interested in attending the next MVC diabetes workgroup, please connect with the MVC Coordinating Center at: michiganvaluecollaborative@gmail.com.