MVC hospital members will soon receive their second preoperative testing push report of 2023, providing an opportunity to benchmark progress on reducing low-value testing rates within their facility. MVC first introduced its preoperative testing push reports in 2021 to support members in reducing this low-value practice. Ordering these tests before low-risk elective and outpatient procedures often provides no clinical benefits to patients but is ordered regularly at hospitals across Michigan.
Similar to the report distributed earlier this year, members will continue to see their rates across various tests for three elective and outpatient procedures: laparoscopic cholecystectomy, laparoscopic inguinal hernia repair, and lumpectomy. Claims were evaluated in the 30 days before the procedures for the following common tests: electrocardiogram (ECGs), echocardiogram, cardiac stress test, complete blood count, basic and comprehensive metabolic panel, coagulation studies, urinalysis, chest x-ray, and pulmonary function with index admissions from 1/1/2021 through 12/31/2022. This refreshed push report exclusively utilizes claims from the Blue Cross Blue Shield of Michigan (BCBSM) and Blue Care Network (BCN) plans. Members will receive reports if they have at least 11 index admissions in one of the three conditions and at least 20 admissions across all three conditions during the reporting period.
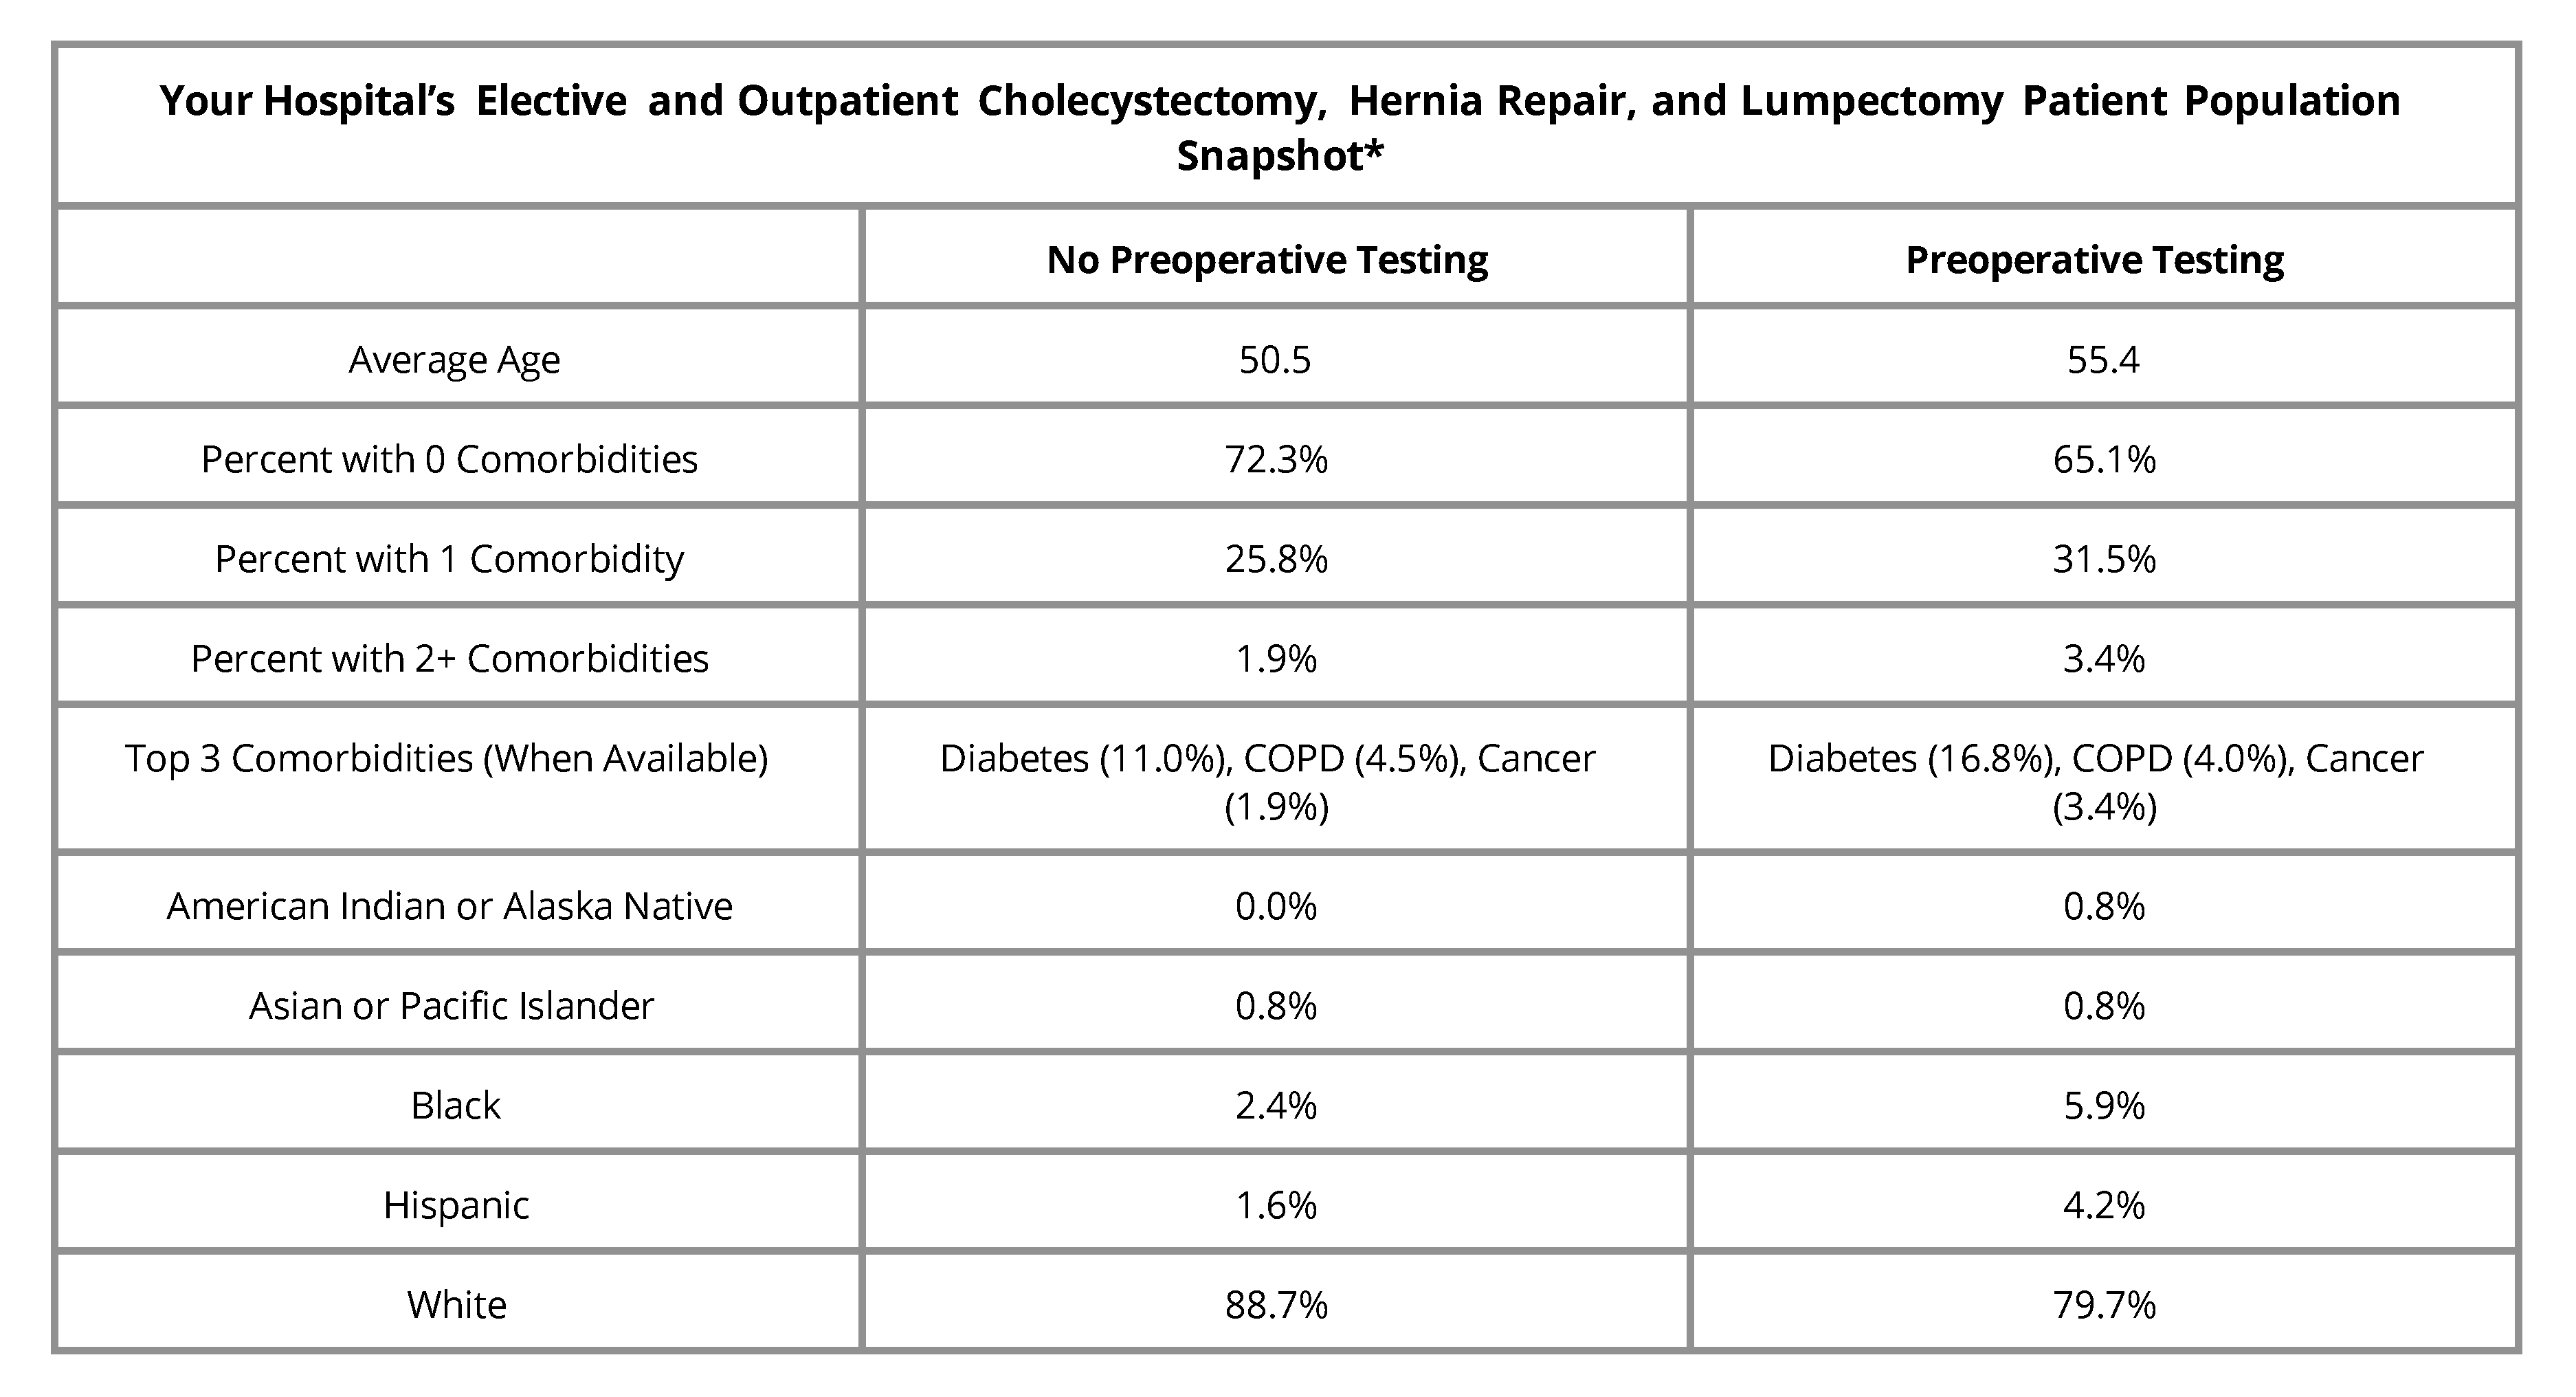
Like other MVC push reports, members will see a patient population snapshot table that identifies rates for preoperative testing and no preoperative testing in patients with varying demographic characteristics (Figure 1). Compared to the version received by hospitals this summer, the latest version of this report now also includes testing rates among patients who identified as Hispanic or American Indian/Alaska Native. On average, patients who had preoperative testing were older and had more than one comorbidity than patients who had no preoperative testing.
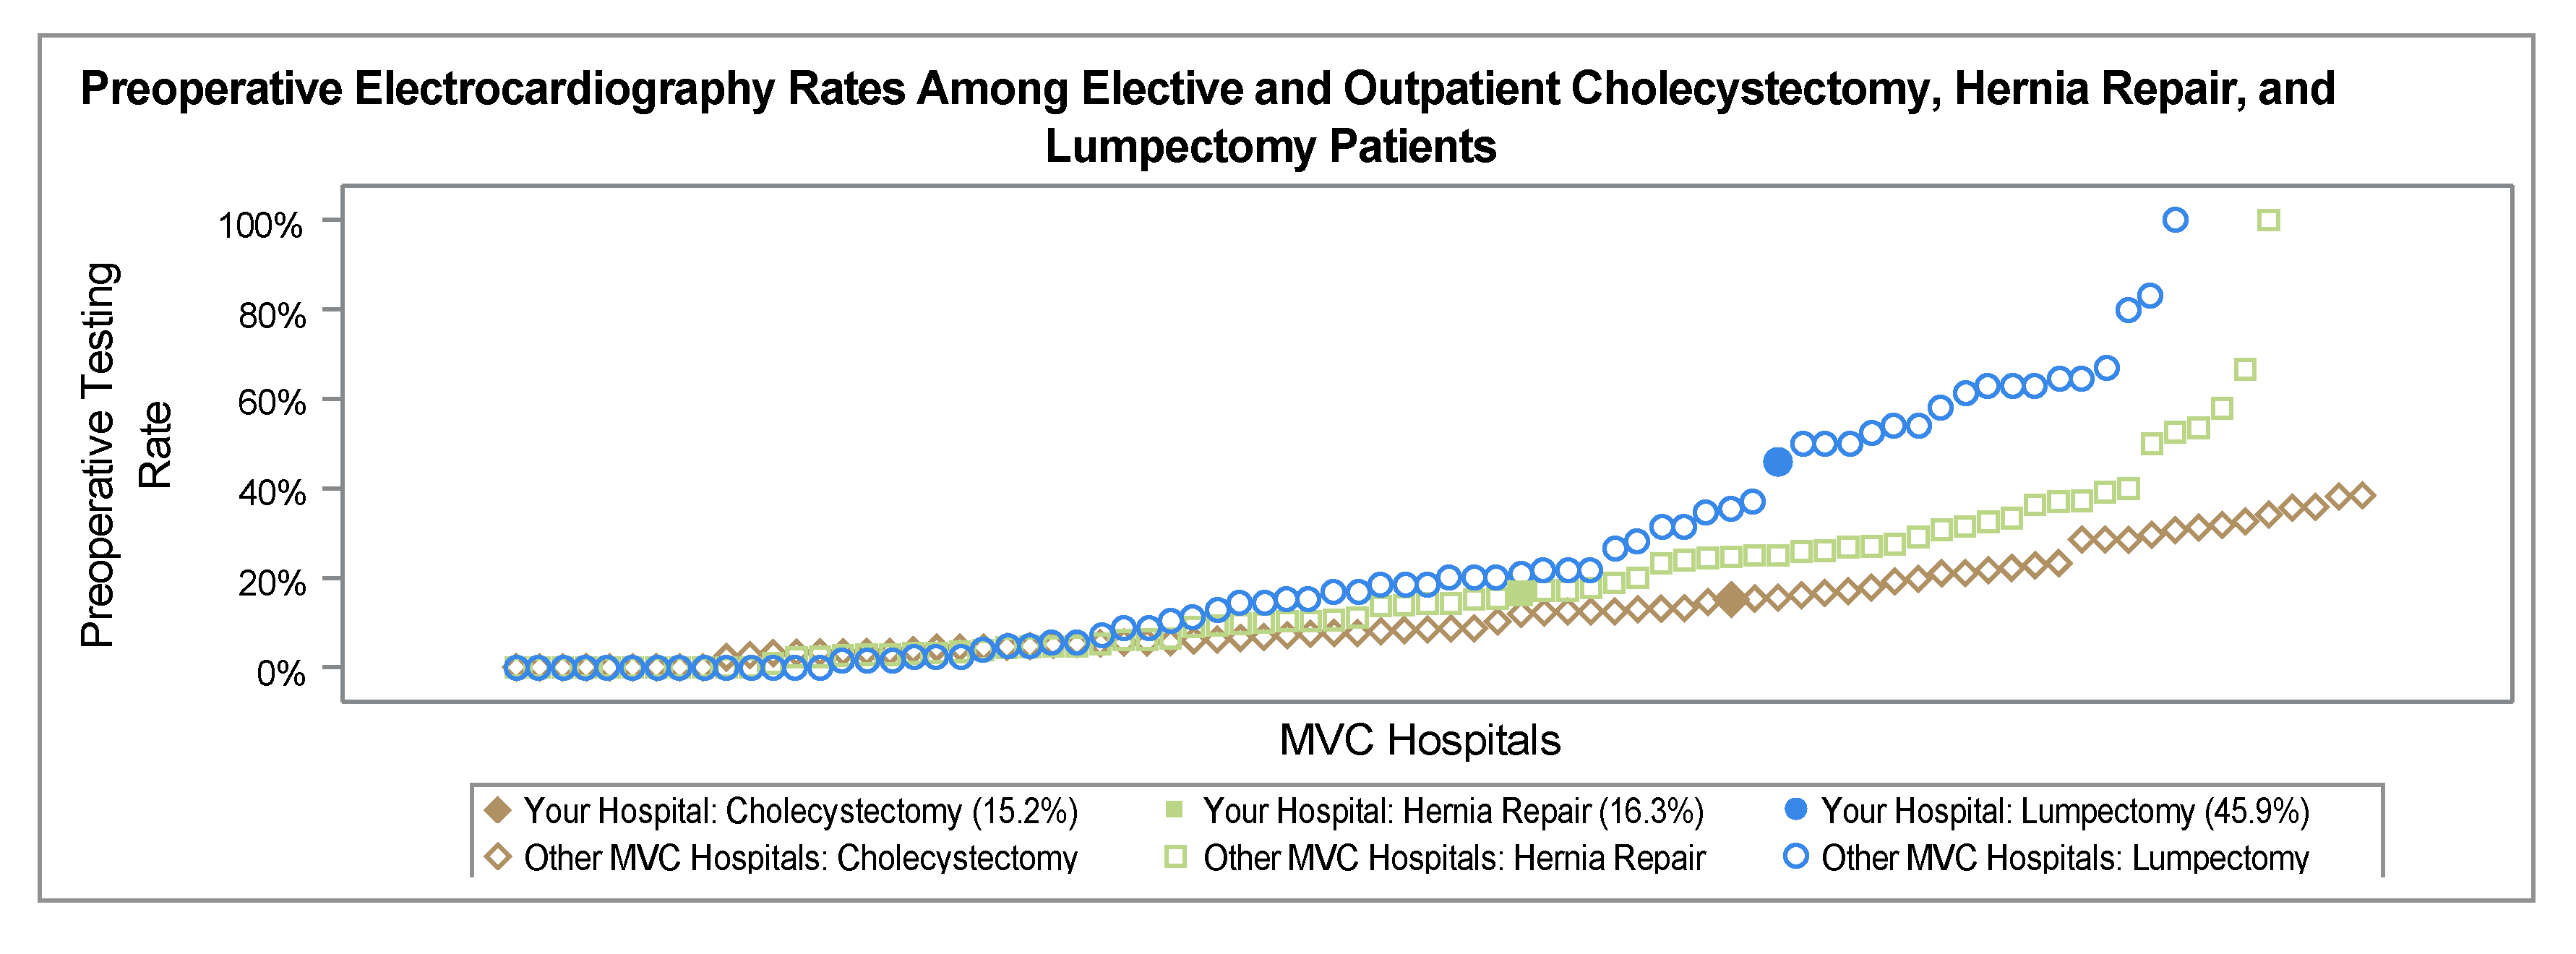
Members will see their average testing rate across all three procedures, as well as their rate for each specific procedure (Figure 2). A hospital’s combined rate can easily be compared with the average for that hospital’s geographic region within the state of Michigan as well as the collaborative-wide average. This figure showcases the wide variability across the collaborative in average testing rates across procedures—some in the collaborative have an average testing rate close to 10% and some nearly 100%.
The next figure in the report showcases overall preoperative testing rates by six-month intervals for 2021 and 2022. It includes data points for the MVC average and regional comparison groups (Figure 3), with evidence of very little change in overall testing rates over time when looking at all three procedures combined.
Although the overall rate across the collaborative has been steady, MVC has identified shifts in testing rates for individual members. To support members in tracking these changes, a caterpillar plot is also included that depicts the absolute change in any preoperative testing from 2021 to 2022 (Figure 4). Members can see the percentage change—positive or negative—in their annual testing rate from 2021 to 2022 for a specific procedure, as well as how their absolute change compares to the rest of the collaborative. This figure showcases that although the collaborative is not seeing much change in its overall rates for any testing over time, individual members might see greater variability over time for specific tests or procedures, especially in instances of low case counts. Overall, MVC observed slight reductions in the average collaborative-wide procedure-specific testing rates from 2021 to 2022 for all three surgical procedures, with the highest reduction observed among lumpectomy episodes (-6.2%).
Members will also be able to take deeper dives into their rates for specific tests (Figure 5) in the figures that make up the remaining pages of the report. Viewing one’s preoperative testing rates for each specific test can help members understand if any specific tests are driving their overall testing rate or are ordered more frequently than the majority of their peers.
MVC is eager to drive improvement in this area and encourages members to visit the Waive the Workup resource website developed in partnership with the Michigan Surgical Quality Collaborative (MSQC) and the Michigan Program on Value Enhancement (MPrOVE). If you are interested in a more customized report, please contact the MVC Coordinating Center at Michigan-Value-Collaborative@med.umich.edu.

