Off
View Post
Building Confidence in Claims Data: MVC’s Site Coordinator Education Program Continues to Grow

Building Confidence in Claims Data: MVC’s Site Coordinator Education Program Continues to Grow

Helping hospitals turn claims data into meaningful quality improvement (QI) action is central to Michigan Value Collaborative’s (MVC) mission. While MVC has long provided members with access to robust claims-based data and reporting resources, member feedback consistently identified a common challenge: many site coordinators and quality leaders wanted additional support in understanding how to interpret claims data and apply it to their organization’s improvement initiatives.

In response, the MVC Coordinating Center launched a series of site coordinator education modules. This structured learning experience was designed to strengthen claims data literacy while building participants’ confidence in using MVC resources to support local QI efforts. The program combines foundational education with practical application, peer collaboration, and individualized support to create a flexible learning experience that can be tailored to each participants’ needs.

After program registration began in January 2026, interest quickly exceeded expectations leading to the creation of three phased cohorts of quality leaders. To date, 40 site coordinators have enrolled in the program, representing 33 hospitals and 12 health systems, reflecting the growing demand for education focused on translating data into action.

A Four-Module Learning Experience

MVC’s site coordinator education program consists of four live, virtual modules that can be completed sequentially or independently depending on each participant’s experience and learning goals.

Module 1: Understanding MVC Fundamentals

The first module introduces participants to foundational knowledge about MVC including the collaborative’s mission, vision, data resources, P4P program, and engagement opportunities. Participants are additionally encouraged to develop a plan for how to meet yearly engagement goals based on preferred activities.

Module 2: Navigating MVC Data Resources

The second module reviews common claims data terminology and definitions, strengths and limitations of claims data, and explores how claims data can be used to supplement clinical data analyses to support QI efforts. Participants also learn to navigate the MVC registry, interpret push reports and identify meaningful performance measures.

Module 3: Applying MVC Resources to Quality Improvement

The third module examines opportunities to make connections between QI efforts and other aspects of MVC’s programming including fellow CQI collaborations and the MVC Component of the BCBSM P4P Program. This module aims to shift from understanding claims data to identifying applications of MVC resources to QI.

Module 4: Best Practice Sharing and Stakeholder Engagement

The fourth and final module focuses on translating the knowledge gained from the previous modules into the appropriate next steps for QI. Participants will have the opportunity to discuss best practices, challenges, and stakeholder communication strategies with fellow quality leaders engaged in similar areas of QI.

This curriculum is built around four complementary components that reinforce learning and encourage real-word application:

  • Foundational Learning: Live virtual sessions introduce key concepts, data resources, and other programmatic materials
  • Applied Case Studies: Independent exercises using hospital-specific reports help guide data interpretation and identify QI opportunities
  • Individual Coaching: One-on-one support from MVC Coordinating Center offers on-demand assistance with report interpretation and the development of customized reference tools
  • Peer Learning Forums: Integrated opportunities to connect with colleagues across Michigan to share experiences, discuss challenges, and exchange successful strategies

Together, these components create a learning environment that extends beyond traditional education by helping participants immediately apply knowledge to their own QI work.

As an example, following Module 2, participants are encouraged to complete a worksheet designed to apply concepts from the 1:1 session to their own organization’s data. Completed worksheets demonstrate strong engagement with the education framework, with participants identifying meaningful opportunities to improve quality of care in a variety of focus areas including readmissions, care transitions, cardiac rehabilitation utilization, and drivers of higher episode spending. Rather than jumping directly to solutions, participants thoughtfully used MVC claims data to generate hypotheses, identify additional clinical and operational information needed, and defined realistic next steps for QI.

A common theme across submissions is recognition that claims data can serve as a starting point for inquiry but must be combined with other data resources to drive QI strategies. Participants frequently identified the need to pair MVC data registry findings with health record data, chart reviews, frontline staff feedback, and internal quality dashboards to better understand underlying drivers. Participants also outlined practical next steps such as engaging multidisciplinary teams, validating findings locally, and integrating MVC data monitoring into existing QI initiatives. These outcomes demonstrate the program’s goal of helping site coordinators translate data insights into meaningful action.

Participant Feedback and Preliminary Outcomes

Evaluation is embedded throughout the education program to ensure the curriculum continues to meet participants’ needs. While the program is in its first year, initial feedback suggests it is already helping participants build confidence in using MVC resources. Following the completion of Module 1, site coordinators have reported an average confidence rating of 4.5 out of 5 in their ability to “describe MVC’s data resources and engagement opportunities.” These early results indicate that the program is successfully establishing a strong foundation for participants as they progress towards applying claims data to QI initiatives within their organizations.

Additionally, participants have highlighted the program’s impact on building both knowledge and confidence:

"Thank you so much for the time and education! I think this is exactly what I need as a new Quality Manager and Site Coordinator. Looking forward to the next module!"

"It was a great learning experience and I'm looking forward to learning more about how we can use this data for process improvement."

"This was a foundational review. I feel very confident with the foundational principles now. I look forward to becoming more comfortable with the claims data and using this data more confidently to improve our performance."

Looking Ahead

MVC’s education modules were designed to bridge the gap between data availability and practical application by combining several complimentary learning strategies. By equipping site coordinators with the knowledge and tools to not only interpret but also apply MVC data to QI efforts, the program aims to strengthen hospitals’ ability to identify improvement opportunities, support evidence-informed decision-making, and advance value-based care across Michigan.

As the program continues to expand, the MVC Coordinating Center is planning to scale up the program by training additional Coordinating Center team members to lead these sessions. Using participant feedback from post-module and post-program surveys, MVC will also continue to refine the curriculum to best meet the needs of site coordinators.

MVC looks forward to welcoming future cohorts of hospital quality leaders to the education program. If interested in joining the next cohort beginning in October 2026, please complete the registration form here.

Off
View Post
April Workgroup Features Preoperative Testing Multipayer Report Registry Demonstration

April Workgroup Features Preoperative Testing Multipayer Report Registry Demonstration

In April, the Michigan Value Collaborative (MVC) hosted a virtual preoperative testing workgroup featuring a presentation by the MVC Coordinating Center focused on utilizing MVC’s multi-payer preoperative testing registry reports. The MVC Coordinating Center hosts workgroup presentations once or twice per month, covering a variety of topics including post-discharge follow-up, sepsis, cardiac rehabilitation, rural health, preoperative testing, and health in action.

Preoperative Testing Workgroup – MVC Coordinating Center

The MVC registry includes many different reports for members to utilize when investigating various conditions, procedures, and outcomes. One of the more recent additions includes the preoperative testing reports which include claims data from multiple payers in one location. Reports that were highlighted in the preoperative testing workgroup included the preoperative testing table report, preoperative testing trends report, and preoperative testing utilization rankings report.

Each report offers members multiple filters to modify the data shown including episode start dates, payer selection, specific conditions (or the option to choose all), several common preoperative tests, such as blood tests, cardiac tests, chest x-ray, electrocardiography (EKG), pulmonary function tests, and urinalysis, and patient demographics (age, gender, race/ethnicity, comorbidities).

MVC Site Engagement Coordinator and workgroup presenter Emily Bair, MS, MPH, RDN, introduced the workgroup by sharing a preoperative testing utilization trend graph that included data on all MVC members and all available payers. The graph demonstrated that since the implementation of the preoperative testing value-based initiative in 2020, MVC members have seen a 6% decrease in unnecessary preoperative testing utilization for specific low-risk procedures. Based on available claims data, preop testing rates across the collaborative have declined from approximately 44% to 38% since 2022.

MVC’s preoperative testing measure definition includes the following:

  1. Numerator: episodes of care where preoperative testing (e.g., urinalysis, pulmonary function, chest x-ray, electrocardiography, certain blood tests, and certain cardiac tests) occurred in the 30 days prior to MVC-defined low-risk laparoscopic cholecystectomy, inguinal hernia repair, and lumpectomy procedures.
  2. Denominator: Elective and outpatient MVC-defined cholecystectomy, inguinal hernia repair and lumpectomy episodes with length of stay between 0 – 2 days.

The preoperative testing initiative, known as the RITE-Size initiative, has been an ongoing collaborative effort between MVC, the Michigan Surgical Quality Collaborative (MSQC), Anesthesiology Performance Improvement and Reporting Exchange (ASPIRE), and the Michigan Program on Value Enhancement (MPrOVE). MVC and MSQC data registries were updated with preoperative testing metrics to improve visibility for members, give access to diverse data, and offer unique customization tools for preoperative testing reports. The MVC engagement team has an ongoing effort to engage and educate members on all of the resources available to them through our registry and data reports. To learn more about attendee usage of MVC data, Bair polled participants to assess whether they had accessed the preoperative testing reports, and if so, whether they used the data in any quality improvement (QI) efforts at their site or system (Figures 1 and 2).

Figure 1. Poll: Have You Accessed MVC’s Multi-payer Reports?

Bar chart showing participant responses to accessing MVC's multi-payer reports, with three horizontal bars labeled "Yes," "No," and "Don't have access." The chart indicates 45% answered "No," 35% "Yes," and 15% "Don't have access," highlighting a majority have not accessed the reports.

Figure 2. Poll: Have You Used MVC’s Multi-payer Reports to Support QI?

Horizontal bar chart showing responses to using MVC's multi-payer reports for supporting QI, with three categories: "No" at about 38%, "Don't have access" at about 32%, and "Yes" at about 23%. Chart uses orange bars with percentage labels on the x-axis ranging from 0% to 45%, highlighting majority respondents either do not use or lack access to the reports.

The polling discussion revealed that while many attendees had registry access, 44% had not utilized these multi-payer reports for quality improvement work. Those that did utilize the reports (23%) shared that they use them for efforts such as system-level benchmarking across their hospitals.

Following the polling results, Bair shared unblinded data from Bronson Health System’s MVC multi-payer registry reports and MVC common conditions push report, covering how differing case counts can impact preoperative testing rate performance, especially when looking at conditions separately. Case volume is a common concern for smaller hospitals, such as critical access sites, when trying to extrapolate useful claims data. As larger health systems are acquiring smaller hospitals like critical access sites, though, they may need to shift how the data can and should be interpreted. Using yearly trending can increase the denominator for case data and give a more accurate visual representation of utilization or performance over time, whereas looking at data on a monthly or quarterly timeframe can show volatility due to case counts having high variability over short time ranges.

MVC welcomes workgroup presenters from across Michigan to share their expertise, success stories, initiatives, and solution-focused ideas with MVC members. Please reach out to us by email if you are interested in being a workgroup presenter or submit an online presentation proposal.

Off
View Post
January Workgroups Highlight Using Claims Data to Drive Sepsis QI and Reducing SSIs Through Multidisciplinary Collaboration

January Workgroups Highlight Using Claims Data to Drive Sepsis QI and Reducing SSIs Through Multidisciplinary Collaboration

In January, Michigan Value Collaborative (MVC) kicked off the 2026 workgroup calendar with a sepsis workgroup focused on helping members better understand how to use claims-based data to support sepsis quality improvement (QI) efforts. The session featured an overview of sepsis-related reporting available on the MVC registry followed by an example of how custom analytic reports can be used to dig deeper into areas of clinical interest. The second workgroup of the month, a health in action presentation, featured Corewell Health Farmington Hills Hospital’s multi-year QI initiative aimed at reducing surgical site infections (SSIs) in colorectal surgery. The MVC Coordinating Center hosts one to two workgroup presentations per month covering a variety of topics including post-discharge follow-up, sepsis, cardiac rehabilitation, rural health, preoperative testing, and health in action.

Sepsis Workgroup – MVC Coordinating Center

The workgroup opened with a presentation by MVC’s Site Engagement Coordinator Rachel Folk, MHA, who walked participants through the types of sepsis related data available in the MVC registry and how members can use these reports to support local QI initiatives. The presentation emphasized that MVC’s claims-based data registry allows members to examine sepsis episodes of care across multiple payers and care settings, providing a broader view of healthcare utilization and outcomes than many internal data sources alone.

Participants were introduced to several registry reports that are particularly relevant to sepsis analysis, including:

  • Episode Payments Report, which shows total, price-standardized payments for 30- or 90-day episodes and can be used as a proxy for assessments of utilization across inpatient, professional, post-acute, and readmission services.
  • Episode Utilization Rates Report, which breaks down where patients receive care during and after an episode, such as skilled nursing facilities, home health, inpatient rehabilitation, or emergency department visits.
  • Readmissions Report, which allows members to explore readmission rates for patients by time interval and whether patients return to the index hospital or are readmitted elsewhere.
  • Comorbidities Report, which highlights common coexisting conditions among patients and supports a deeper understanding of patient complexity.
  • Payment by Condition Report, which compares case volume and utilization across conditions and helps contextualize sepsis relative to other medical episodes.

The presentation also included a review of sepsis-related Pay for Performance (P4P) reports available in the MVC registry including a Value Metric Summary Report and Value Metric Trends Report, which allow users to assess their current performance, improvement and achievement baselines and trends over time (Figures 1 and 2). Folk explained how these reports can help teams visualize progress relative to peer hospitals and MVC-wide averages.

Figure 1. MVC Data Registry Value Metric Summary – Blinded Report

MVC Data Registry Value Metric Summary table – Blinded Report

Figure 2. MVC Data Registry Value Metric Trends – Blinded Report

MVC Data Registry Value Metric Trends line graph – Blinded Report

Throughout the presentation, Folk additionally highlighted key registry features such as filtering by hospital type, payer, episode length, patient demographics, and episode time frame. She also reviewed case suppression thresholds and reminded participants that MVC’s data are risk adjusted, allowing for fairer comparisons across hospitals with differing patient populations.

Using Claims Data to Support Improvement

A recurring theme of the discussion was the importance of approaching the registry with curiosity. Participants were encouraged to consider the “five W’s” when reviewing their data and to use the available benchmarking opportunities to compare their hospital’s performance against similar hospitals to help identify realistic opportunities for improvement.

Polling during the session revealed that many participants had limited or no prior experience with an MVC registry review. Registry reviews are a dedicated opportunity for MVC staff to walk members through their site-specific data, focusing on the reports and metrics most relevant to their individual goals. These reviews can help teams move beyond high-level trends to more actionable questions about variation, utilization, and outcomes.

If you’re interested in setting up a time to complete a registry review, please email MVC.

Applying Custom Analytics to Sepsis Care

The workgroup concluded with a second presentation by MVC Analyst Janet Zhang, MPH, highlighting how custom analytic reports can be used to explore specific questions not fully addressed by standard registry reports. Using a recent example focused on sepsis patients and the impact of palliative care, Zang demonstrated how tailored analyses can provide deeper insight into care patterns, outcomes, and opportunities for improvement.

MVC encourages members interested in deeper analyses via custom report to submit a request through the Coordinating Center [Link].

MVC Sepsis Workgroup: Jan. 13, 2026

Health in Action Workgroup – Corewell Health Farmington Hills Hospital

MVC’s second workgroup of January featured Jennifer Hengy, BSN, RN, Internal Quality Improvement Specialist, Dr. Eugene Laveroni, Chief of Surgery, and Leslie Smith, RPh, JD, BCPS, BCIDP, Clinical Pharmacist Specialist from Corewell Health Farmington Hills. Together they showcased how a multidisciplinary team used data, evidence-based guidelines, and workflow redesign to drive meaningful improvements in patients’ safety by reducing SSIs in colorectal surgery.

SSIs remain a significant source of patient harm and financial penalty for hospitals nationwide. Despite advances in sterile technique and surgical technology, data from the Centers for Disease Control and Prevention (CDC) continue to show SSIs occur at alarming rates. As Hengy explained, their local data mirrored this challenge with an SSI rate of 9.6% in colorectal surgeries in 2023. This signaled an urgent need for targeted improvement. For Farmington Hills, this started with building the right team.

Building a Team

The initial improvement committee included surgical leadership, quality improvement specialists, pharmacy, nursing education, and anesthesia, with additional stakeholders added as new insights emerged. This diverse group ensured that clinical expertise, frontline workers, and data review were all represented throughout the project. Another key principle of the initiative was fostering a non-punitive culture. Chart reviews and peer discussion focused on learning and system improvement rather than individual blame, helping to sustain engagement across disciplines.

The Discovery Phase: Identifying Key Gaps

The discovery phase proved to be the most challenging but ultimately the most impactful, Hengy shared. The team conducted detailed chart reviews of SSI cases to better understand contributing factors, examining elements including:

  • Use of clean closing gloves, gowns, and closing packs
  • Skin preparation and closure techniques
  • Antibiotic selection, timing, and infusion duration
  • Documentation of infections present at the time of surgery (or PATOS)

Early interventions focused on education about documentation, standardized closing packs, and surgical techniques. While these steps led to modest improvements, they did not produce the level of change the team was seeking so they turned to the experts in antibiotics.

Optimizing Antibiotic Selection and Timing

A deeper dive into perioperative antibiotic practices at Farmington Hills revealed variability in both the antibiotics chosen and their infusion timing. The team identified frequent use of second-line antibiotics in patients with reported penicillin allergies, as well as inconsistencies ensuring antibiotics were fully infused prior to surgical incision.

Smith, a clinical pharmacist specializing in antimicrobial stewardship and a member of Corewell Health Farmington Hills’ SSI workgroup explained that cefazolin remains the preferred first-line prophylactic antibiotic for colorectal surgery and can be safely administered to most patients with reported penicillin allergies. Pharmacy-led education highlighted Cefazolin’s uniquely low risk of cross-reactivity and proven lower SSI rates compared to non-beta-lactam alternatives. Education was delivered through multiple channels, including surgical quality meetings, residents and provider training, newsletters, and real-time feedback to reinforce adherence to standardized protocols.

In addition, the team redesigned workflows to address infusion timing. New processes ensured that antibiotics requiring longer infusion times were started earlier in the preoperative phase. The use of visual job aids, memory tools, and Omnicell alerts reinforced these changes at the point of care (Figures 3 and 4).

Figure 3. Timing of Preoperative Antibiotic Infusion Flyer

Timing of Preoperative Antibiotic Infusion Flyer

Figure 4. Recommended Antibiotic Re-Dosing Interval Guideline Table for Patients Currently Receiving Antibiotics

Recommended Antibiotic Re-Dosing Interval Guideline Table for Patients Currently Receiving Antibiotics

Outcomes and Impact

Following implementation of these antibiotic-focused interventions and revised workflows, Corewell Health Farmington Hills observed a substantial reduction in colorectal SSIs with an infection ratio (SIR) of 0% between February 2024 and August 2024. In conclusion, the presenters emphasized that while zero harm is an aspirational goal, the consistency of guideline adherence and the sustainability of improved practices represented their major successes.

MVC Health in Action Workgroup: Jan. 29, 2026

MVC welcomes workgroup presenters from across Michigan to share their expertise, success stories, initiatives, and solution-focused ideas with MVC members. Please reach out to us via email or by submitting a presentation proposal using this form if you are interested in sharing your work.

Off
View Post
Celebrating 2025 Successes and Setting the Stage for 2026

Celebrating 2025 Successes and Setting the Stage for 2026

On behalf of the MVC Coordinating Center, let me first start this end-of-year blog by thanking you all for your partnership and continued support throughout 2025. In case you blinked and its now December – don’t worry, you’re not alone! The last year has flown by with plenty of twists and turns along the way. Before we get caught up in the holidays and planning for 2026, we wanted to step back and celebrate the successes we achieved together over the last 12 months.

In writing my reflection piece last year, I highlighted that both our engagement participation and analytics utilization were far above previous years. While this gave us a hard act to follow, we are delighted to share that this trend continued upwards in 2025. Over the last year, we welcomed two new hospital members to the collaborative, delivered 23 virtual workgroups with an average attendance of 41, facilitated 24 different member presentations, completed 9 site visits, delivered 14 custom analytic requests, and supported 106 new users in gaining access to our online registry. On top of all of this, we held two collaborative wide meetings in Midland and Livonia, with 197 member representatives joining us to share stories, spotlight successes, and support one another in navigating all of the challenges which 2025 decided to bring.

These flagship numbers only tell one part of the story; the true value of each of the activities detailed above comes from the relationships and partnerships developed as a result of the time spent together. We hope you all have taken as much benefit from these collaborations as our group has during this time. Which brings me to another highlight…the MVC Coordinating Center. Let’s take a moment to celebrate the people who not only help make all of the above possible but that make this such a great place to work. Thank you to the entire MVC team for your hard work and commitment to supporting our members throughout 2025. I’m excited for what the next year will hold. Speaking of which, here’s a sneak peek of a few things that will be taking place in 2026.

Collaborative Wide Meetings, Networking Events, and Virtual Workgroups

MVC’s 2026 engagement events calendar is now live. Our spring collaborative wide meeting will take place on Friday, May 8 in Traverse City and we will be returning to Livonia for our fall meeting on Friday, October 9. These forums continue to be supported by virtual and in-person networking activities and dinners throughout the year, and dates for our regular suite of virtual workgroups can also be found on the 2026 calendar. Save the dates - we look forward to seeing you at each of these events!

MVC Site Visits

We visited a number of you in 2025, providing the opportunity to strengthen our understanding of member activities, priorities, and system-level practices. This effort will continue next year, and members can participate in these site visits in either a virtual or in-person capacity, with P4P engagement points on offer for taking part. If you are interested in getting on the calendar for 2026, please don’t hesitate to reach out.

MVC Site Engagement Coordinator Education Program

In response to member feedback, MVC will be launching a new Site Coordinator Education Program in 2026, designed to offer a flexible, individualized, rolling training curriculum to provide members with a stronger understanding of MVC data, share tools to help evaluate metric progress, and facilitate peer collaborations. This program is in high demand with capacity already met for the first round of registration. Additional opportunities to participate in this new education program will open throughout the calendar year – more communications to follow!

New MVC Component of the BCBSM P4P Program PY26/27 Registry Pages & Webinars

As with previous cycles, new P4P pages will be launched at the turn of the year to correspond with the changes implemented for PY26/27. These pages will look and feel similar to those currently available with a few important updates to reflect changes to our episode spending and value metric menu options and the introduction of MVC’s new Health Outcome Variation Measure. The latter reflects a new metric to the MVC Component, and to support members in navigating and utilizing these new registry pages, dedicated explainer webinars will be held in January.

MVC Push Reports and Custom Analytics

As highlighted above, MVC’s push reports and offer of custom analytics were well utilized by members in 2025, and to reflect member feedback, efforts will be spent strengthening this offering for member benefit in 2026. Remember, if you are interested in working with the Coordinating Center on a custom build, reach out to us by email. [LINK]

Thank you again for your continued partnership throughout the last year and we look forward to more successes in 2026. Have a great holiday and a happy new year when it rolls around.

Off
View Post
September Workgroups Highlight Sepsis ED Triage Process and MVC’s Common Conditions and Procedures Report & Registry Review

September Workgroups Highlight Sepsis ED Triage Process and MVC’s Common Conditions and Procedures Report & Registry Review

In September, MVC hosted two virtual workgroup presentations – the first, a sepsis workgroup focused on Henry Ford Health Macomb’s efforts to build a structured emergency department (ED) triage process specifically for patients diagnosed with sepsis. The second, a health in action workgroup focused on the recent MVC Common Conditions and Procedures Report and included an overview of how to combine this push report with MVC registry data. The MVC Coordinating Center hosts workgroup presentations twice per month covering a variety of topics including post-discharge follow-up, sepsis, cardiac rehab, rural health, preoperative testing and health in action.

Sepsis Workgroup September 9, 2025

As Brandie DeVos, RN, MSN, Sepsis Coordinator explained at the beginning of the presentation, sepsis continues to challenge hospitals due to its time sensitive nature. Delays in recognition or treatment can lead to worse outcomes. Henry Ford Macomb Hospital’s ED sepsis team – composed of Michigan Hospital Medicine Safety Consortium (HMS) coordinators, internal sepsis program, and ED leadership – was established to combat just this issue. Their mission, to build a structured ED triage process, with specific attention to patients suspected of sepsis who present with abnormal vital signs to ensure the rapid identification, prioritization, and early intervention in suspected sepsis cases (Figure 1).

Co-presenters, DeVos and Errin Couck, BSN, RN, HMS Sepsis Coordinator, emphasized that having a consistent, structured triage process has helped to ensure cases of sepsis are not missed in the chaos of the ED. They recognized that prior to the initiation of a triage process directed at identifying sepsis, patients were being placed throughout the ED regardless of the presence of symptoms, vital signs indicating organ dysfunction, or indications of systemic inflammatory response syndrome (SIRS) criteria.

Figure 1. Walk-In Triage Process for Sepsis

walk-in triage process for sepsis flow chart

However, the triage system does more than mechanically screen vitals; it incorporates clinical judgement and risk indicators to prioritize patients with abnormal temperatures, elevated heart rate, hypotension, or altered mental status (Figure 2). The optimized identification of at-risk patients increases adherence to evidence-based sepsis bundle elements such as early labs, cultures, antibiotics, and fluid resuscitation within the defined time windows, a crucial step to improving performance in quality metrics.

Figure 2. Code Sepsis Activation Process

Henry Ford McComb Hospital Code Sepsis Activation flow chart

However, in practice, the sepsis program requires the support of a multidisciplinary team. DeVos and Couck note the most common roadblocks to this initiative were staff push back, untrained RNs in the triage area, and RN fatigue. They encourage aligning all stakeholders early and sustaining communication channels. They also noted great success with positive encouragement (i.e., celebrating the small wins), requiring triage RNs to have at least one year of ED experience, and routine triage RN rotations (every four hours).

Since initiating the new triage process, the presenters noted the following positive outcomes:

  • A 36% increase in antibiotics given within three hours of arrival for septic shock patients
  • For emergency medical services (EMS) patients, vital signs are obtained, triage completed, and patients roomed appropriately in an average of 12 minutes
  • 90% of lobby patients have vital signs obtained within 5-10 minutes
  • Overall, less patient triage complaints

The presenters ended the presentation by discussing a challenge they have experienced when attempting to expand their sepsis ED triage process to other sites within their own system. Hospitals differ – in size, resources, patient volume, and staffing. DeVos and Couck encouraged participants to pilot, learn, and iteratively refine their workflows locally.

This workgroup session served as both a practical guide and a rallying call – a structured ED triage for suspected sepsis should not be optional. It’s a critical defense against delays that cost lives.

MVC Sepsis Workgroup Sept. 9, 2025

Health in Action Workgroup September 25, 2025

The September health in action workgroup featured a presentation by MVC’s Site Engagement Coordinator Emily Bair, MS, MPH, RDN, CSP. The presentation focused on the recent MVC Common Conditions and Procedures Report and included an overview of how to utilize the MVC registry to compliment analyses included in this push report.

The Common Conditions and Procedures Report was developed as a structured data tool aimed at providing individualized, comprehensive, high-impact trends in commonly seen chronic conditions and a selection of procedures across participating hospitals. The most recent version of this report was shared with members in July. Two previous versions of the report were shared in 2024 and 2023.

Similar to previous iterations of the report, the most recent Common Conditions report included 30-day inpatient or surgical episodes created from two years of index admissions between January 2023 – December 2024. Exclusions included patients who had an inpatient hospital transfer, died in the hospital during their index hospitalization, or were discharged to hospice. Payors included Blue Care Network HMO Commercial and Medicare Advantage, Blue Cross Blue Shield of Michigan PPO Commercial and Medicare Advantage, Medicare Fee-for-Service, and Michigan Medicaid.

Within each report each site has an individualized patient population overview table that displays the patient population for each common condition (Figure 3). This table illustrates the distribution pattern of the population within each common condition but is not necessarily indicative of the distribution of patient demographics for the outcome of interest. In addition to age, gender, and race/ethnicity categories, the table includes zip code level data based on the Economic Innovation Group’s Distressed Communities Index (DCI) 2015-19, dual-eligible status, and common comorbidities.

Figure 3. Common Conditions Patient Population Snapshot for Hospital A (Blinded Data)

Common Conditions Patient Population Snapshot for Hospital A (Blinded Data) table

The report then features a variety of analyses for each condition/ procedure with an emphasis on:

  1. Benchmarking: the report allows each hospital to see how it compares to peers on metrics like readmission rate, post-discharge care utilization, and episode cost
  2. Longitudinal trends: by presenting trends (6-month intervals) hospital leadership can detect historical problems or successes

Figure 4. Common Conditions Report Page for Atrial Fibrillation for Hospital A (Blinded Data)

Common Conditions Report Page for Atrial Fibrillation for Hospital A (Blinded Data): total of six charts and tables

The design of this workgroup is part of MVC’s broader efforts to support hospitals not just with data, but with actionable insights and engagement strategies. As Bair points out, data alone isn’t enough – it’s the interpretation and follow-through that drives real change. Bair followed her review of the Common Conditions report with a walk-through of relevant online data registry reports (Figure 5).

Figure 5. Summary of Relevant Reports on MVC Data Registry

table: Summary of Relevant Reports on MVC Data Registry

In an effort to continue to support hospitals to move from simply viewing data to implementing quality improvements, Bair outlined a few key MVC engagement strategies:

  1. Outreach and coaching: MVC offers one-on-one coaching to support members with data interpretation and connections to peers
  2. Custom analytic report development: MVC may facilitate the development of deeper data analyses
  3. Peer learning and collaboration: MVC aims to catalyze dialogue across sites, encouraging sharing cross-hospital learning
  4. Iterative feedback: MVC welcomes feedback from members to support the evolution of data tools

MVC Health in Action Workgroup Sept. 25, 2025

Interested in access to the MVC data registry?

Ways to request registry access. Email: michigan-value-collaborative@med.umich.edu

Once a registry request is received, the MVC team will confirm your request with your specified site’s MVC Site Coordinator (primary contact). Once confirmed, you will be sent an MVC website confidentiality agreement (WCA), and upon receiving the completed WCA, MVC will provide you with a username and directions to login via email.

If you are interested in pursuing a healthcare quality improvement project, MVC has data specialists available to help you navigate our data resources and create custom analytics reports to support your efforts. Please reach out to us by email if you would like to learn more about MVC data or engagement offerings!

Off
View Post
MVC Updates Registry with New Claims Across All Payers

MVC Updates Registry with New Claims Across All Payers

This week MVC updated its registry with new claims from its included payers. This most recent update included the addition of three new months of Blue Cross Blue Shield of Michigan (BCBSM) and Blue Care Network (BCN) claims, one new quarter of Medicaid claims, and one new quarter of Medicare Fee-for-Service (FFS) claims. Following these updates, the MVC registry now has the following data ranges for its data:

  • BCBSM PPO (Commercial and Medicare Advantage): 01/01/2015 – 03/31/2025 (index events through 12/31/2024)
  • BCN (Commercial and Medicare Advantage): 01/01/2015 – 03/31/2025 (index events through 12/31/2024)
  • Medicaid: 01/01/2015 – 03/31/2025 (index events through 12/31/2024)
  • Medicare FFS: 01/01/2015 – 09/30/2024 (index events through 06/30/2024)

Anytime MVC publishes new data on its registry, the newest claims for each payer are incorporated throughout the various reports and dashboards where that payer’s data is present, including the interactive multi-payer reports for cardiac rehabilitation utilization and preoperative testing.

Refreshed Multi-Payer Cardiac Rehabilitation Reports

The multi-payer cardiac rehabilitation utilization reports were added to the registry in the first half of 2024 and have replaced the static PDF hospital-level push reports MVC previously distributed biannually to its members as well as BMC2 and MSTCVS contacts. The regular release of new data on the registry, therefore, gives members opportunities throughout the year to check progress on cardiac rehabilitation metrics more regularly and find opportunities for improvement. For example, available 2024 data on cardiac rehabilitation enrollment for all eligible patients (excluding heart failure patients) with episode start dates between Jan. 1, 2024, and Dec. 31, 2024, indicates wide variability among hospitals; the statewide average utilization rate is 34%, with the majority of sites observing rates below the Million Hearts recommended 70% rate as well as below the Michigan Cardiac Rehab Network goal rate of 40% (Figure 1).

Figure 1. Statewide Rankings for Cardiac Rehab Utilization within 90 Days After Discharge from AMI, CABG, PCI, SAVR, and TAVR, 1/1/2024-12/31/2024*

Dot graph: Statewide Rankings for Cardiac Rehab Utilization within 90 Days After Discharge from AMI, CABG, PCI, SAVR, and TAVR, 1/1/2024-12/31/2024*

*Index events 1/1/24-12/31/24 for BCBSM Commercial and Medicare Advantage (MA), BCN Commercial and MA, and Medicaid; index events 1/1/24-6/30/24 for Medicare FFS

Similarly, there is significant variation between hospitals in their mean days to a patient’s first cardiac rehab appointment, with some hospital patients attending their first session 31 days after discharge and some waiting as long as 68 days. However, MVC has observed a steady yearly decrease over time in this metric, with a collaborative-wide average of 59 days in 2020 compared to 47 days in 2024.

These data along with metrics for mean number of visits and utilization rates for specific service lines and payers can be accessed via the multi-payer tab on the registry under the cardiac rehab heading.

Refreshed Multi-Payer Preoperative Testing Reports

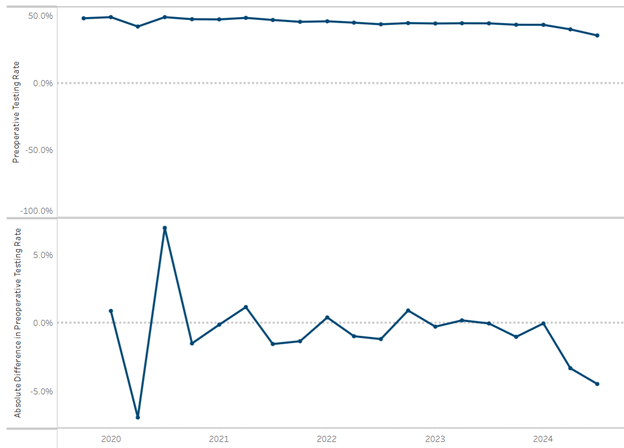
The multi-payer preoperative testing utilization reports were added to the registry at the end of 2024 and have also replaced static hospital-level push reports that were previously distributed as biannual PDF reports to members as well as MSQC contacts. Looking at all available 2024 claims across payers, there is evidence of a small decrease in the MVC All rate of preoperative testing prior to low-risk surgery beginning in late 2022 through 2024 (Figure 2). The average testing rate in 2020 was 46.8% and the average rate in 2024 was 39.9%. Members whose rates are 40% overall or higher are eligible to participate in the RIght-sizing Testing before Elective Surgery (RITE-Size) program, which offers participating sites consultation and coaching, templates, best practice guidance, and other resources to help coordinate decreases in unnecessary testing across their institutions. MVC is also able to supplement registry data with custom analytics by an MVC analyst to meet the needs of members. One such site recently utilized MVC’s custom analytics to identify differences in preoperative testing rates by physician NPI to support conversations about intra-hospital variation by provider and service line.

Figure 2. Statewide Rate of Preoperative Testing and Relative Difference in Preoperative Testing by Quarter, 01/01/2020-12/31/2024*

Line graph: Statewide Rate of Preoperative Testing and Relative Difference in Preoperative Testing by Quarter, 01/01/2020-12/31/2024*

*Index events 1/1/24-12/31/24 for BCBSM Commercial and Medicare Advantage, BCN Commercial and MA, and Medicaid; index events 1/1/24-6/30/24 for Medicare FFS

MVC’s registry contains an extensive collection of report views for multi-payer, P4P, and payer-specific metrics with select patient-level drilldown capabilities. If you are newer to the registry or would like a refresher on how best to leverage the information, reach out to the MVC Coordinating Center for information about a tailored registry training.

Off
View Post
April Workgroups Highlight Preoperative Testing and MVC’s Process Measures Report & Registry Review

April Workgroups Highlight Preoperative Testing and MVC’s Process Measures Report & Registry Review

In April, MVC hosted two virtual workgroup presentations – the first, a preoperative testing workgroup focused on the CQI collaboration with the Michigan Surgical Quality Collaborative (MSQC) to reduce preoperative testing rates for low-risk surgeries, supplemented by a brief overview of the RITE-Size Initiative and how MVC sites can benefit from participating. The second workgroup, health in action, focused on the recent MVC Process Measure Report and included an overview of how to utilize the MVC registry. The MVC Coordinating Center hosts workgroup presentations twice per month covering a variety of topics including post-discharge follow-up, sepsis, cardiac rehab, rural health, preoperative testing and health in action.

Preoperative Testing Workgroup April 8, 2025

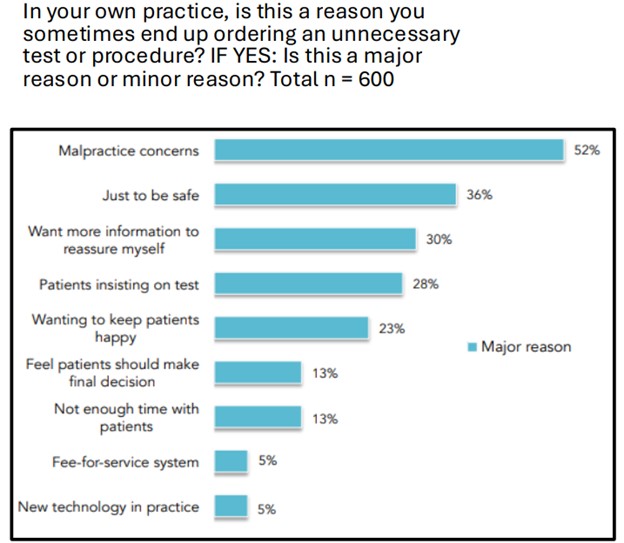
Jennifer Bennett, MBA, BSN, RN, Lead Quality and Patient Safety Coordinator for Henry Ford Health (HFH) Madison Heights – Warren, shared that in 2017 the estimated cost for unnecessary preoperative testing and treatment was $200 billion nationwide (Healthcare Finance News, 2017). Additionally, in 2014, PerryUndem and the Choosing Wisely Campaign completed a phone survey of over 600 different physicians (primary care and specialists) across the country. This survey inquired whether providers believed unnecessary tests and procedures in the healthcare system were a serious problem and who or what entity should be responsible for leading improvement efforts.

Results showed that the top reasons providers ordered the unnecessary tests were because of malpractice concerns, belief that it should be done “just to be safe,” patients insisting on having the test, or they were trying to keep patients happy (Figure 1). Providers also believed they were the best suited to address overuse of unnecessary tests and procedures in the healthcare system.

Figure 1. Reasons Why Physicians Order Unnecessary Tests Poll
horizontal bar chart: poll results of Reasons Why Physicians Order Unnecessary Tests

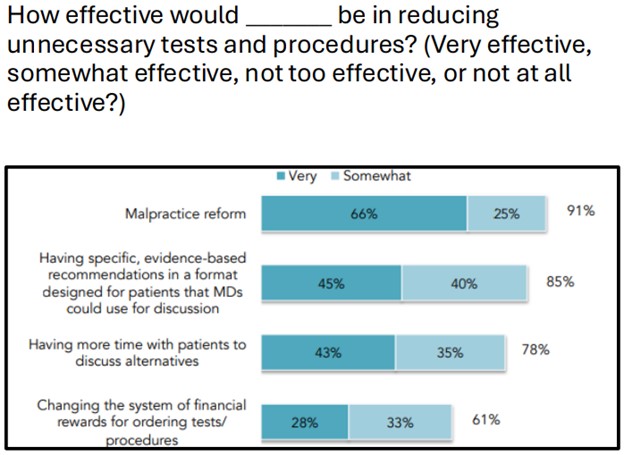
Physicians surveyed selected several solutions to try and address the issue including malpractice reform, having specific evidence-based recommendations in a format that would be easy to discuss with the patient, having more time to discuss alternatives with patients, and changing the system of financial rewards for preoperative testing metrics (Figure 2).

Figure 2. Possible Preoperative Testing Reduction Strategies Poll
horizontal bar chart: Possible Preoperative Testing Reduction Strategies Poll results

In collaboration with MSQC, Henry Ford Health Madison Heights-Warren launched a pilot program in 2023 to implement appropriate preoperative screening for low-risk surgeries, including breast lumpectomy – partial mastectomy, minor hernia, and laparoscopic cholecystectomy. Initial data used for setting a baseline understanding showed that preoperative testing rates for these procedures across the state had a wide range of 8% - 85%, and testing before low-risk surgeries was noted to be common for greater than 50% of patients undergoing at least one test.

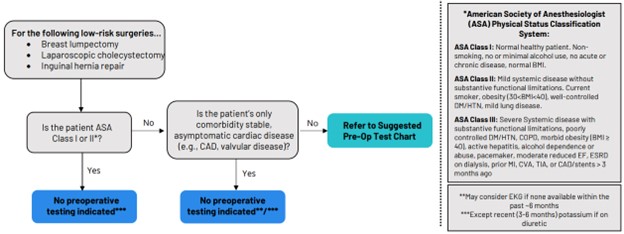
Using testing recommendations from several notable academic medical societies, Henry Ford and MSQC were able to build an outline of recommendations for blood work (labs), electrocardiogram (ECG) tests, cardiac stress tests, and chest x-rays. A decision tree was developed to aid providers in choosing a test that was appropriate for a patient prior to their procedure (Figure 3).

This decision tree took into consideration what American Society of Anesthesiologist (ASA) class the patient fell under. The ASA classes (ASA 1 – 5) are determined by physical status of the patient (Do they have comorbidities, age related issues, life expectancy if they don’t have the procedure, etc.?) The higher the ASA class level the more likely the patient will require additional testing due to chronic disease processes being present. Recommendations for preoperative testing on patients that are an ASA class 3 or above were combined into a guidance chart (Figure 4) to aid in test order decision making.
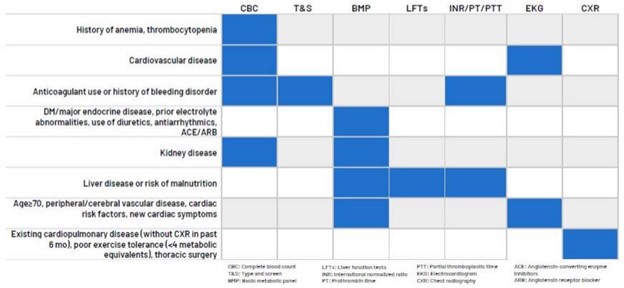
Figure 4. Suggested Preoperative Tests for Patients Undergoing Low-Risk Surgery Who are ASA 3 or Above*

Chart: Suggested Preoperative Tests for Patients Undergoing Low-Risk Surgery Who are ASA 3 or Above*

*This chart does not replace clinical judgment and is intended as guidance only.

Henry Ford Health Madison Heights-Warren reported several successes during their pilot program. These include:

  1. Engaging stakeholders: They successfully engaged various stakeholders—including patients, providers, office staff, CQIs, and IT—in meaningful conversations and collaborative problem-solving.
  2. Acknowledging work: The team emphasized the critical importance of the work being done and its alignment with the best interests of patients.
  3. Cost savings: They highlighted the potential for significant overall cost savings resulting from the program's implementation.
  4. Revising protocols: Protocols were revised to incorporate new best practices for preoperative testing, ensuring enhanced care quality.

Some of the barriers that arose included communication breakdowns, a lack of education or understanding, trying to engage and include providers that were contracted private practice and may not have the same electronic medical record (EMR) access, and not having a complete set of data due to claims data delays (Medicare/Medicaid).

Results

Prior to the pilot program launching (March 2022 - March 2023), HFH Madison Heights-Warren's preoperative testing rates were at 37.8% and after implementation (March 2023 – September 2024) their preoperative testing rate reduced to 31%. Their next steps include partnering with the RITE-Size initiative to develop future preoperative testing goals and re-engaging with stakeholders at other Henry Ford Health sites.

RITE-Size Initiative Overview

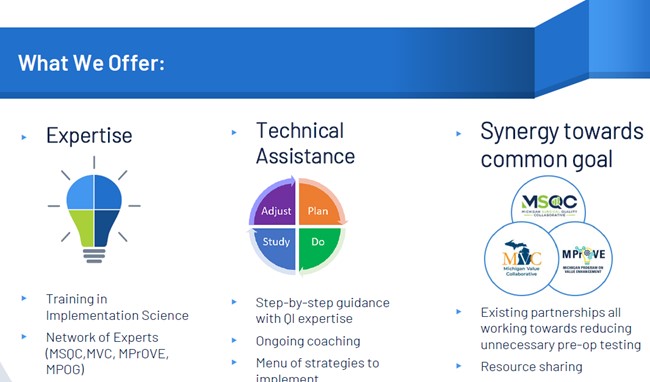
MVC Program Director Hari Nathan, MD, PhD, gave a brief overview of the RITE-Size initiative. The goal for right-sizing testing before elective surgery is to identify patient risk-level, match patient risk-level to pre-op testing, and perform a safe and successful low-risk surgery. This initiative is a grant funded collaborative partnership between Michigan Surgical Quality Collaborative (MSQC), Michigan Value Collaborative (MVC), and the Michigan Program on Value Enhancement (MPrOVE) (Figure 5). The plan is to learn from the clinical and claims data, consider clinician input, and to recommend high-value tests based on this information.

Figure 5. RITE-Size Member Offerings

If your site is interested in participating in the RITE-size preoperative testing program, please reach out by email to the MVC Coordinating Center.

Health in Action Workgroup April 24, 2025

The health in action workgroup featured a presentation by MVC’s Site Engagement Coordinator Emily Bair, MS, MPH, RDN, CSP. The presentation focused on the recent MVC Process Measure Report and included an overview of how to utilize the MVC registry.

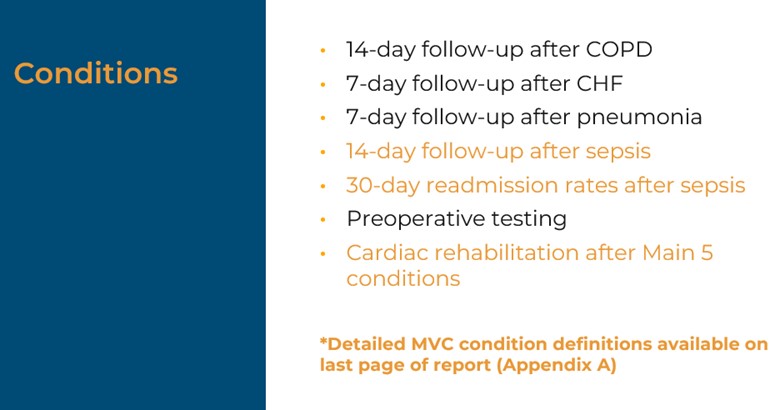
Traditionally, MVC push reports have focused on just one condition, surgery, or metric at a time. The process measures push report was developed to pull together information on multiple conditions to provide individualized, comprehensive, and actionable insights for MVC members (Figure 6). This report was provided to sites that are participating in the MVC portion of the BCBSM P4P program as well as non-P4P sites. This allows sites to evaluate their progress on all eligible measures, not just the metrics selected for the P4P program year.

Figure 6. MVC Conditions
MVC Conditions

This process measures report includes 90-day inpatient or surgical episodes created from index admissions between January 2022 – December 2023. Exclusions included patients who had an inpatient hospital transfer, died in the hospital during their index hospitalization, or were discharged to hospice. Payors included Blue Care Network HMO, commercial and Medicare Advantage, Blue Cross Blue Shield of Michigan PPO commercial, and Medicare Advantage, Medicare, and Michigan Medicaid.

Within the report each site has an individualized sociodemographic overview table that displays the patient population for each process measure cohort (Figure 7). This table illustrates the distribution pattern of the population within each process measure but is not necessarily indicative of the distribution of patient demographics for the outcome of interest. One detail to note is that the race/ethnicity denominator includes all patients but may not add up to 100% due to the exclusion of other race/ethnicity categories.

Figure 7. MVC Process Measure Report for Hospital A (blinded data)
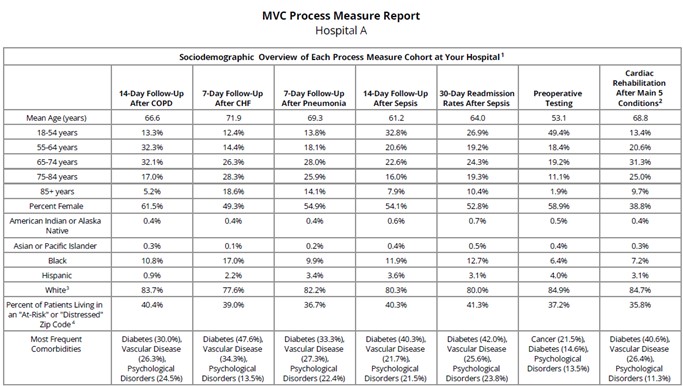
Table: MVC Process Measure Report for Hospital A (blinded data)

In addition to race/ethnicity categories, MVC is populating data on patient zip codes (categorized as prosperous, comfortable, mid-tier, at-risk, or distressed according to the Economic Innovation Group’s Distressed Communities Index (DCI) 2015-19. The DCI incorporates economic indicators such as education, employment, and income as well as patient age and gender. These are some of the first steps being taken to incorporate sociodemographic information into our analyses, deepening our understanding of the patient community's needs and awareness to support further health equity efforts.

Registry Review

How can we use the MVC registry to investigate certain metrics or patient demographics?

  1. Search for specific metrics such as preoperative testing rates at your site. Are they higher or lower than the MVC All average?
  2. Investigate certain procedures for which tests are being ordered more frequently than others
  3. Drill down to see if certain patient age categories are accumulating a higher testing rate than others

For example, when looking at the multi-payer preop testing reports, helpful filters to utilize would be the following:

  1. Episode start dates – selecting an exact date range
  2. Payers – choosing the appropriate payers for the date range you are looking at (noting that Medicare and Medicaid data may be 6 months to 1 year behind BCBSM)
  3. Procedures – choose the desired procedure(s) you want to investigate
  4. Tests – choose the desired tests you want to investigate in relation to the procedure
  5. Patient characteristics – choose what age(s), gender, race/ethnicity, and comorbidities you want to include/exclude

Interested in joining the MVC registry?
Once you send a registry request the MVC team will confirm your request with your specified site’s MVC Site Coordinator (primary contact). Once confirmed you will be sent the MVC website confidentiality agreement (WCA), and upon receiving the completed WCA, MVC will provide a username and directions to login in via email.

If you are interested in pursuing a healthcare improvement program, MVC has data specialists available to help navigate and create custom analytics reports. Please reach out to us by email if you would like to learn more about MVC data or engagement offerings!

Off
View Post
MVC Refreshes Registry Reports with New Data & Methods

MVC Refreshes Registry Reports with New Data & Methods

At the end of February, MVC updated its registry with new payer data. MVC adds new data to the registry monthly upon receipt of new claims from included payers. This most recent update included the addition of two new months of Blue Cross Blue Shield of Michigan (BCBSM) and Blue Care Network (BCN) claims, one new quarter of Medicaid claims, and one new quarter of Medicare claims. Following these updates, the MVC registry now has the following data ranges for its data:

  • BCBSM PPO (Commercial and Medicare Advantage): 01/01/2015 – 12/31/2024 (index events through 09/30/2024)
  • BCN (Commercial and Medicare Advantage): 01/01/2015 – 12/31/2024 (index events through 09/30/2024)
  • Medicaid: 01/01/2015 – 12/31/2024 (index events through 09/30/2024)
  • Medicare FFS: 01/01/2015 – 06/30/2024 (index events through 03/31/2024)

Anytime MVC publishes new data on its registry, the newest claims for each payer are incorporated throughout the various reports and dashboards where that payer’s data is present, including the interactive multi-payer reports for cardiac rehabilitation utilization and preoperative testing.

Refreshed Multi-Payer Cardiac Rehabilitation Reports

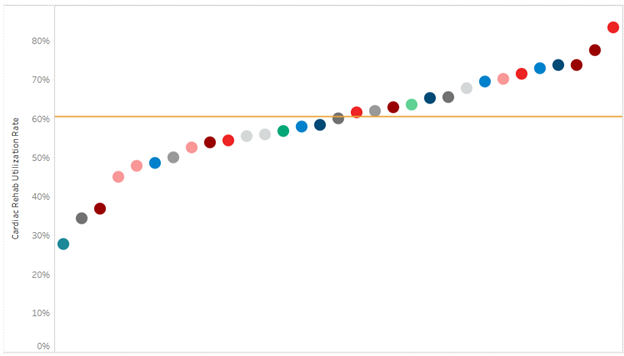
The multi-payer cardiac rehabilitation utilization reports were added to the registry in the first half of 2024 and have replaced the static PDF hospital-level push reports MVC previously distributed biannually. The regular release of new data on the registry, therefore, gives members opportunities throughout the year to check progress on cardiac rehabilitation metrics more regularly and find opportunities for improvement. For example, current data on cardiac rehabilitation enrollment for CABG patients with episode start dates between Jan. 1, 2024, and Sept. 30, 2024, indicates wide variability among hospitals, with many sites observing rates below the recommended 70%. Across the collaborative, enrollment in cardiac rehab after CABG procedures was as low as 28% at one MVC member hospital and as high as 83% at another with a statewide average of 61% (Figure 1). Similarly, cardiac rehab utilization is much lower on average among PCI patients over the same time period (32%), and there is wide inter-hospital variation with rates ranging between 6% and 86% (Figure 2).

Figure 1. Statewide Rankings for Cardiac Rehab Utilization within 90 Days After Discharge from CABG, 1/1/2024-9/30/2024

dot graph of Statewide Rankings for Cardiac Rehab Utilization within 90 Days After Discharge from CABG, 1/1/2024-9/30/2024

Figure 2. Statewide Rankings for Cardiac Rehab Utilization within 90 Days After Discharge from PCI, 1/1/2024-9/30/2024

dot graph of Statewide Rankings for Cardiac Rehab Utilization within 90 Days After Discharge from PCI, 1/1/2024-9/30/2024

This latest registry update also included a methodological change impacting cardiac rehabilitation reporting for attendance. These methodological improvements were meant to increase the accuracy of MVC’s reported mean number of visits attended within a selected time period. MVC noted that this change resulted in increases in the average number of completed cardiac rehabilitation visits overall, and especially among BCN and Medicaid beneficiaries. This increase in the average number of visits reflects the fact that MVC improved the capture of multiple cardiac rehabilitation visits over a longer time period billed on a single claim.

Refreshed Multi-Payer Preoperative Testing Reports

The multi-payer preoperative testing utilization reports were added to the registry at the end of 2024 and have also replaced static hospital-level push reports that were previously distributed as biannual PDF reports to members. Looking at all available 2024 claims across payers, there is evidence of a small decrease in the MVC All rate of preoperative testing prior to low-risk surgery beginning in late 2022 and continuing throughout 2023 and into 2024 (Figure 3). Those members who are working to reduce unnecessary preoperative testing are encouraged to check their updated data. MVC is also able to supplement registry data with custom analytics by an MVC analyst to meet the needs of members. One such site recently utilized MVC’s custom analytics to identify differences in preoperative testing rates by physician NPI to support conversations about intra-hospital variation by provider and service line.

Figure 3. Statewide Rate of Preoperative Testing and Relative Difference in Preoperative Testing by Quarter, 2020-2024

line graph of Statewide Rate of Preoperative Testing and Relative Difference in Preoperative Testing by Quarter, 2020-2024

MVC’s registry contains an extensive collection of multi-payer, P4P, and payer-specific views and metrics. If you are newer to the registry or would like a refresher on how best to leverage the information, reach out to the MVC Coordinating Center for information about a custom registry review.

Off
View Post
MVC Introduces Multi-Payer Preop Testing Registry Reports

MVC Introduces Multi-Payer Preop Testing Registry Reports

MVC recently added three new multi-payer reports to its online registry focused on preoperative testing use prior to low-risk surgery. MVC has been tracking measures of this low-value practice since 2021, and previously shared biannual static push reports with its members on their testing rates. Now, MVC registry users can access these metrics under the multi-payer reports tab on MVC’s online data registry [LINK].  

Similar to previous reporting, these new multi-payer reports provide interactive figures to assess a site’s opportunities to reduce unnecessary testing prior to three low-risk procedures: outpatient cholecystectomy, inguinal hernia repair, and lumpectomy. MVC hopes to add additional low-risk procedures in the future. For each of these procedures, preoperative testing is assessed in the 30 days prior to the surgery according to CPT codes identified in claims data. Each report reflects the most up-to-date available claims data from Blue Cross Blue Shield of Michigan (BCBSM) PPO Commercial, BCBSM PPO Medicare Advantage (MA), Blue Care Network (BCN) HMO Commercial, BCN MA, Medicare Fee-for-Service (FSS), and Medicaid insurance plans.  

Multi-Payer Report Filters 

Users can dynamically select the procedure(s), payer(s), and date range (i.e., the span of the episode start dates) to meet their data needs. Users may also filter by patient characteristics such as age and the presence of certain comorbidities that may place a patient in a higher risk category. Additional patient-level characteristics related to the episode of care that can be filtered include gender, race/ethnicity, and a diagnosis of chronic kidney disease (CKD) or venous thromboembolism during the index event or within 90 days. Up to five comparison groups can also be applied to each figure: the average across all MVC member hospitals, a cohort of hospitals located within the user’s MVC region, hospitals of the same type as the user (i.e., general acute care hospital or Critical Access Hospital), hospitals of the same trauma center level, and, if applicable, other rural hospitals in MVC's membership. A full listing of MVC member hospitals and their GACH, CAH, and rural hospital status can be referenced on the MVC website [LINK]. 

Preoperative Testing Table 

The first of the three new report pages includes a table summarizing the testing rates for each type of preoperative test, overall and by procedure. Rates are shown for a user’s selected hospital and the comparison group of their choosing. The filters as described above allow users to determine which episodes to include or exclude based on their needs. 

Preoperative Testing Trends 

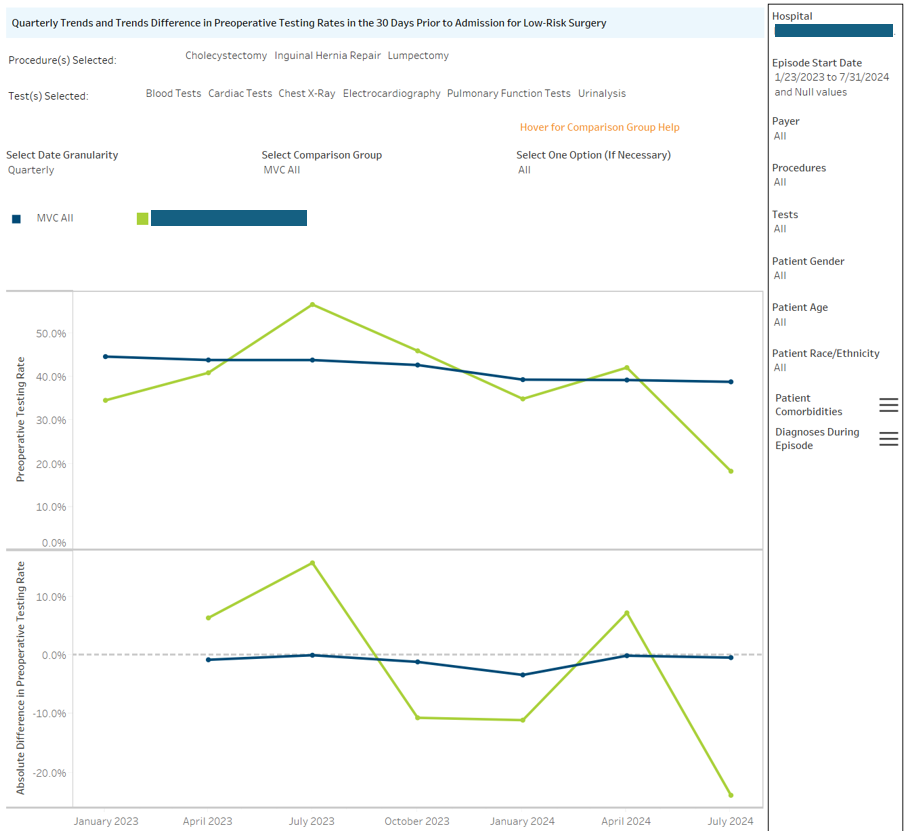
The next report shows the preoperative testing rates for the user’s hospital(s) over time alongside a comparison group of their choosing, as well as a trend graph demonstrating the magnitude of a site’s rate changes over time (Figure 1). The trend figures provide data points for a time interval of the user’s choosing, either monthly, quarterly, or annually, along with any additional filters as described. If these trend graphs appear to have missing data points, there is likely suppression occurring due to insufficient eligible episodes for that time period. In those instances, MVC recommends modifying the time interval to include more episodes. For all multi-payer reports, MVC suppresses data points with denominators of less than 11, and also suppresses denominators of rates that can be used to back-calculate to a numerator of less than 11. 

Figure 1. Quarterly Trends and Trends Difference in Preoperative Testing Rates in the 30-Days Prior to Admission for Low-Risk Surgery

Preoperative Testing Utilization Rankings 

Lastly, the third and final report provides a visual representation of hospital preoperative testing rates for the user’s site(s) alongside all other peer hospitals from a selected comparison group, such as MVC All, hospital type, or hospital region. This style of figure can be used to help benchmark a site’s performance by showcasing how their utilization compares within a larger group. Since both this report and the trend graphs are interactive, users can hover their cursor over a specific data point to view additional details such as the exact testing rate and the number of episodes included in that rate's denominator.

Accessing the Registry Reports 

All report pages can be exported into a variety of file types, such as PDFs or JPGs, for ease of sharing or adding to other materials. All MVC registry users will have access to these reports to view the data for their site(s). If you do not have registry access and are interested in using the registry to view these reports, you may complete MVC’s user access request form [LINK].  

MVC hosted its first webinar to demonstrate the functionality and features of these new multi-payer preoperative testing reports on Jan. 21 and will host a second webinar on Tues., Jan. 28 from 12-1 p.m. Please RSVP if you are interested in attending this second webinar [LINK].  

If you have any additional questions or feedback about the new registry reports, please contact the Coordinating Center by email [LINK]. 

Off
View Post
MVC Introduces New Multi-Payer Cardiac Rehab Registry Reports

MVC Introduces New Multi-Payer Cardiac Rehab Registry Reports

The MVC Coordinating Center added four new multi-payer reports to its online registry in April. These new reports evaluate cardiac rehabilitation utilization and encompass all metrics previously provided annually in MVC’s hospital-level cardiac rehab push report for acute myocardial infarction (AMI), percutaneous coronary intervention (PCI), heart valve repair or replacement (SAVR or TAVR), coronary artery bypass graft (CABG), and congestive heart failure (CHF). Each report reflects the most up-to-date available claims data from Blue Cross Blue Shield of Michigan (BCBSM) PPO Commercial, BCBSM PPO Medicare Advantage (MA), Blue Care Network (BCN) HMO Commercial, BCN MA, Medicare Fee-for-Service, and Medicaid insurance plans. Users may select any combination of cardiac conditions and insurance plans to assess in each report.

In addition to allowing dynamic selection of cardiac conditions and payers, the reports allow for customization of report date range (the span of episode start dates), episode length (the time period following each index event), and index place of service (e.g., inpatient, outpatient, emergency department). Users may also filter by patient characteristics including gender, age, and comorbidities (diagnoses prior to the index event). Other patient-level characteristics related to the reflected episode can also be filtered, including whether the patient was transferred during their index event, was diagnosed with COVID-19 during the index event or within 30 days post-discharge, and by certain diagnoses during the index event or within 90 days. Up to four comparison groups are offered for each figure: the collaborative-wide measure, MVC All; the measure among other hospitals in the region, Hospital Region; the measure among only hospitals of the same type, Acute Care/Critical Access Cohort; and the measure among other rural hospitals (if applicable), MHA Rural Hospital Cohort.

Cardiac Rehab Utilization Rates

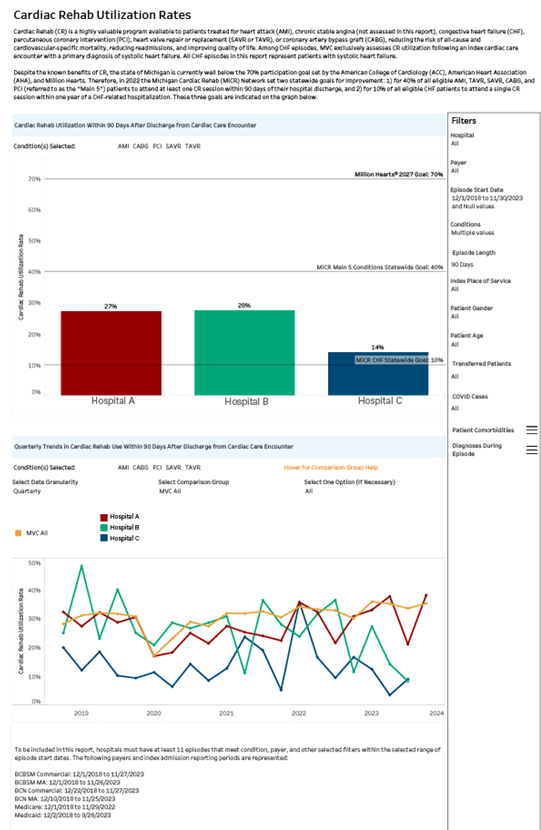
The first of the four new report provides data on cardiac rehab utilization rates (Figure 1). This report includes a description of cardiac rehab benefits followed by two figures reflecting utilization rates among episodes of the desired condition and payer combinations after all selected filters have been applied. The first figure shows the overall rate of cardiac rehab compared to utilization goals set by the Michigan Cardiac Rehab network (MiCR) and Million Hearts®. The second figure shows utilization trends over time at the user’s hospital(s) and a selected comparison group. This full report and all other reports can be downloaded as a ready-to-print PDF or image file.

Figure 1. Cardiac Rehab Utilization Rates Report

Cardiac Rehab Utilization Rankings

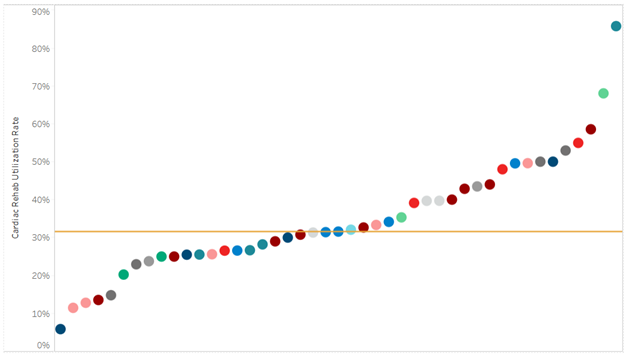
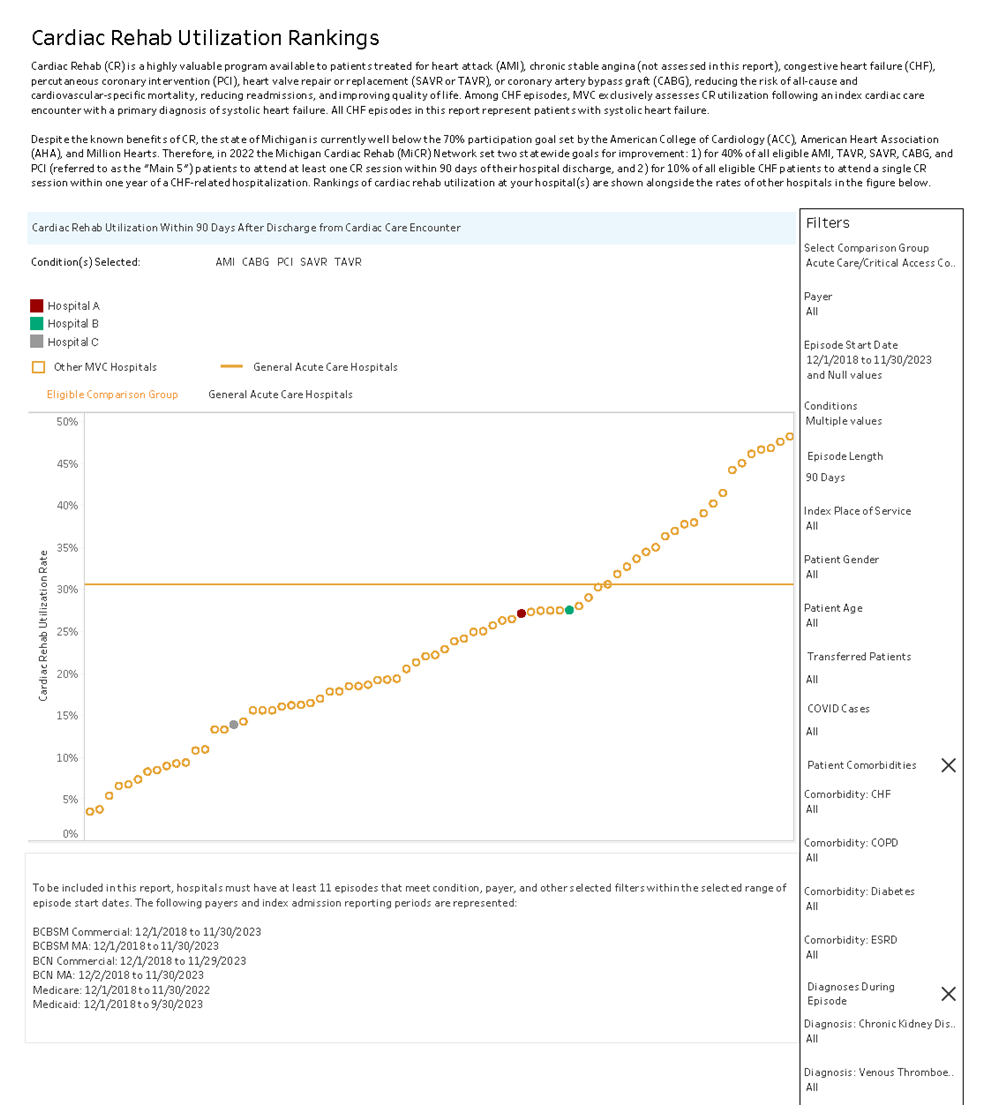
The next report provides data on cardiac rehab utilization rankings, showcasing the ranked order of hospital-level utilization rates for a selected comparison group. For example, in Figure 2 there are data points for cardiac rehab utilization rates during AMI, CABG, PCI, SAVR, and TAVR episodes originating at MVC Hospitals A, B, and C between December 1, 2018, and November 30, 2023 compared to all other MVC general acute care hospitals. The average rate across all comparison hospitals is about 31%, and each point outlined in orange represents the rate at an individual comparison hospital. Again, this report and all others may be downloaded in a ready-to-share format.

Figure 2. Cardiac Rehab Utilization Rankings Report

The remaining new cardiac rehab registry reports provide visual hospital rankings in the same format as the utilization rankings report, but for two other measures: 1) mean days to first cardiac rehab visit, which ranks the average number of days from index discharge to patients’ first cardiac rehab visit (up to 365 days); and 2), mean number of cardiac rehab visits, which ranks the average number of cardiac rehab visits completed within a selected episode length. These reports offer the same dynamic filters and output capabilities.

All MVC registry users will have access to these reports to view the data for their site(s). If you do not have registry access and are interested in using the registry to view these data, you should complete MVC’s user access request form. If you have any questions or feedback about the new registry reports, please contact the Coordinating Center.