Off
View Post
MVC Coordinating Center: Serving the Community Through Service Days

MVC Coordinating Center: Serving the Community Through Service Days

Over the years, the MVC Coordinating Center has spent time creating a set of fundamental principles that we strive to underpin our everyday culture. Our core values of collaboration, respect, curiosity, and courage continue to prove extremely valuable in helping guide our ongoing activity and shape how we work and interact with MVC members and other stakeholders. One such way in which the MVC team has put these core values into action over the last twelve months is through our regular volunteering efforts with the local community. In the last year, the MVC team has spent time partnering with the Ronald McDonald House, MHealthy, and Ann Arbor Parks and Recreation to build connections, strengthen relationships, and extend impact beyond our four walls.

The Ronald McDonald House in Ann Arbor (RMHCAA) is a special place that provides a supportive home away from home for families of children receiving treatment. Since opening three decades ago, RMHCAA has welcomed over 26,000 families, offering comfortable living spaces in close proximity to the hospital so that family members can take care of themselves knowing their child is just minutes away. As part of this support, families are not only provided with a place to stay but are also cared for in many other ways, including the provision of hot meals. These dinners provide families with a break from the hospital and time away to connect with others going through similar experiences.

Towards the end of last year, the MVC team were fortunate to spend some time supporting this great endeavor. Representatives from MVC participated in the program’s “Chef for a Day” initiative, planning, shopping, and delivering a home-cooked meal for the families. This volunteering experience was extremely meaningful and reminded us of what remains at the center of MVC’s daily work – ensuring patients and caregivers in Michigan receive the right care and feel supported throughout their care journey. We’ll be back volunteering with RMHCAA towards the end of this year and if you too are interested in sharing your time or donating, you can find out more here.

Photograph of MVC Coordinating Center team volunteering at RMHCAA wearing blue aprons standing behind a kitchen counter filled with multiple meal prep containers of food.

MVC Coordinating Center team volunteering at RMHCAA

Fast forward to summer (if only…) and our next volunteering event took us to supporting MHealthy’s “Project Healthy Schools” (PHS) program. PHS is a school-based health promotion program designed to prevent childhood obesity and improve the present and future health of youth. For two decades, PHS has used interactive lessons and wellness activities to help middle school students and staff increase physical activity, eat healthier, and truly understand how nutrition and exercise can influence lifelong health.

In April of this year, the MVC team spent time supporting the organization’s “Maize and Blue Health U” event at the Big House. This gave us the chance to prove we are all still athletes at heart, partnering with University of Michigan student athletes to deliver engaging and fun physical activity exercises to over 330 students from four different middle schools. We might have been sore the next morning but as a team, we found great value in extending our commitment to sustainable, high-value healthcare beyond the clinical setting and into the student community.
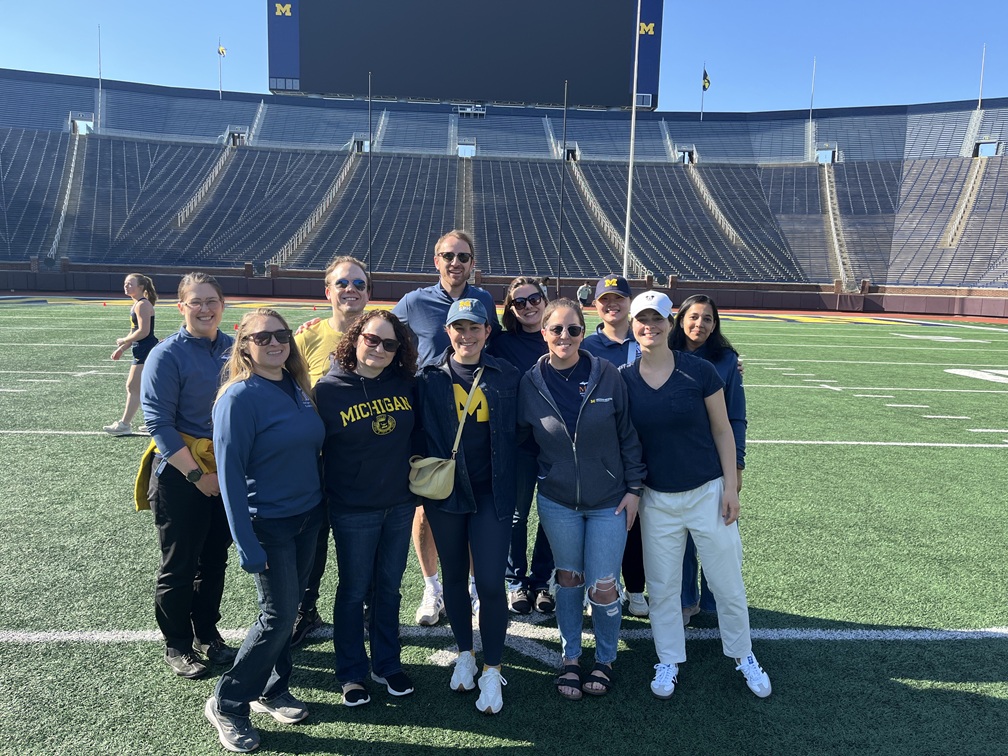
Photograph of MVC Coordinating Center team on the football field of University of Michigan "Big House"

MVC Coordinating Center team volunteering for MHealthy’s “Project Healthy Schools” (PHS) “Maize and Blue Health U” event at the Big House

Our most recent volunteering activity with Ann Arbor Parks and Recreation took us to Leslie Park for a park cleanup day. Our local parks and built environment play a key role in creating accessible spaces for people to play, exercise, connect, and quite simply, spend time outdoors. This, in turn, impacts directly on physical health and mental wellbeing. Spending time as a team to support park cleanup is a simple and effective way of investing in the health of those in our community. After a good few hours picking weeds, the park’s play structure was ready for action again, providing a fun space for kids (and their adults) to get outside and be active.
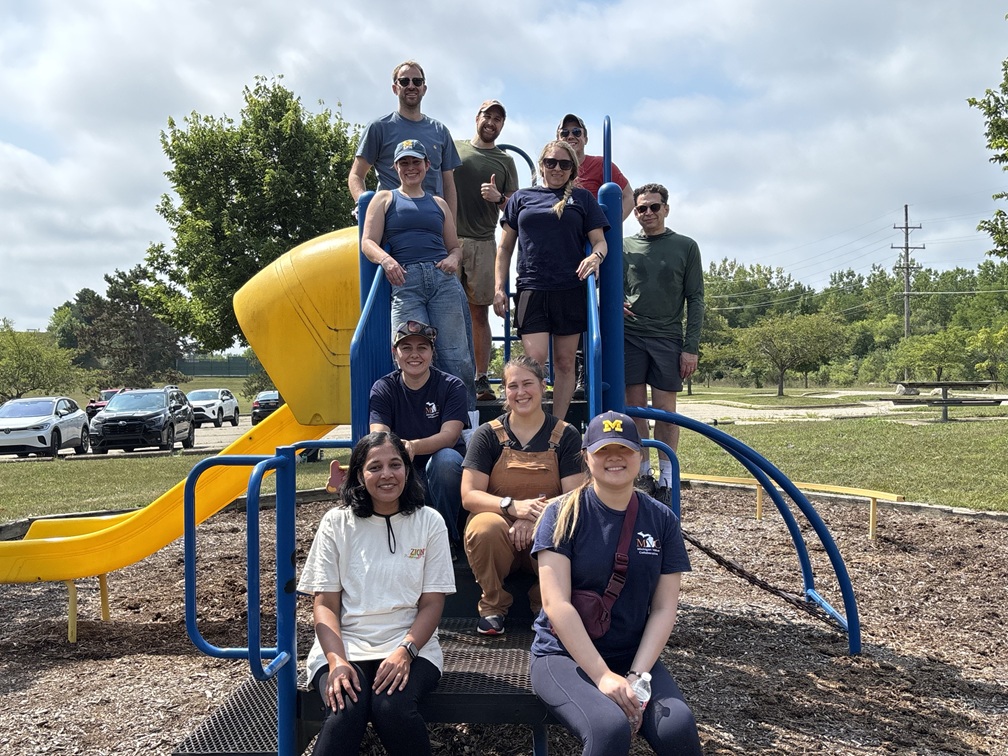
Photograph of MVC Coordinating Center team volunteering with Ann Arbor Parks and Recreation at Leslie Park posing on and around playground equipment.

To learn more about the organizations mentioned, please visit the websites of Ronald McDonald House Ann Arbor, Project Healthy Schools, and Ann Arbor Parks and Recreation. If your team has a similar partnership in place with a local community-based organization then please let us know – we would be happy to highlight this work on your behalf. Similarly, if you are interested in partnering with the MVC team on an upcoming volunteering activity, we would love to explore a potential collaboration.
Off
View Post
Introducing MVC Systems VBI: Measuring Value Across Healthcare Systems

Introducing MVC Systems VBI: Measuring Value Across Healthcare Systems

MVC's Value-Based Initiatives (VBIs), formerly known as Value Coalition Campaigns, are designed to focus collaborative improvement efforts around a specific value-based care opportunity in Michigan. These initiatives bring together MVC's suite of offerings around a defined area where coordinated action can help reduce unwarranted variation, improve outcomes, and increase value for patients and providers. Applications of this framework to date focused on reducing inpatient post-acute care after joint replacement, improving cardiac rehabilitation utilization, and improving appropriateness of preoperative testing before low-risk surgery.

MVC now plans to pursue a new, additional VBI encompassing more aspects of healthcare quality that focuses on measuring system performance. VBIs historically intended to translate data into actionable opportunities for improvement at the hospital level — helping MVC members understand where variation exists, learn from one another, and identify strategies that can be applied across organizations and care settings. MVC’s new systems VBI represents an evolution of this approach: applying the same value-based improvement framework to opportunities that extend beyond individual hospitals and span entire healthcare systems.

Why Focus on Healthcare Systems?

Healthcare in Michigan increasingly happens across systems rather than within a single hospital. Today, 89% of MVC's hospital members belong to a larger healthcare system. This creates an important opportunity for value-based improvement, because many of the factors that influence quality and outcomes at an individual hospital extend beyond its walls. Therefore, MVC has identified the opportunity to use its claims data and engagement opportunities to help drive quality improvement not just at the hospital level, but within and across the systems they belong to.

Building on Existing Momentum

The systems VBI builds on several years of MVC's work to help members understand performance beyond the individual hospital. MVC has gradually expanded its ability to provide system-level data, engagement, and benchmarking, creating a foundation for more formal system-level improvement efforts:

  • MVC has offered registry access tailored to system-level quality leads for several years
  • Since 2020, MVC produced system-level push reports on a range of topics.
  • In 2024, MVC added system-level site visits to the engagement menu for the MVC Component of the BCBSM P4P program.
  • Starting in 2026, site coordinators for individual hospitals can benchmark key performance metrics across their system on MVC's registry.
  • MVC’s 2026 spring collaborative-wide meeting and June networking event featured system-level themes.

Together, these efforts have created a foundation for MVC to move from providing system-level insight to actively focusing collaborative improvement efforts at the system level through a formal VBI.

A Vision for System-Level Value Improvement

The systems VBI work has initially been focused on measurement as a starting point for focused improvement — identifying opportunities where health systems can leverage their size, infrastructure, and ability to coordinate care to improve value across multiple hospitals. As with MVC's other VBIs, the initiative will pair data and benchmarking with peer learning, collaboration, and opportunities for members to identify and share effective strategies.

MVC is approaching development of its measures and other resources through a robust human-centered design process, built around co-development with stakeholders at many levels of the healthcare system. This includes direct presentations to advisory committees, as well as targeted design activities embedded within MVC's existing engagement offerings, such as the breakout session at its spring 2026 collaborative-wide meeting and a June in-person networking session dedicated to this work.

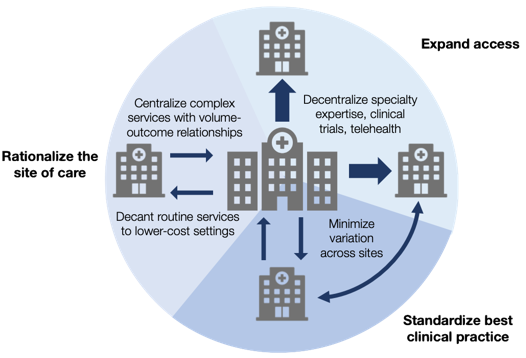
While the framework is still evolving (Figure 1), MVC's early metric prototypes are organized around three ways health systems can uniquely influence value across their sites:

Standardize best clinical practice — minimizing unwarranted variation across sites when the evidence points clearly to what works.

Expand access — decentralizing specialty expertise, clinical trials, and telehealth so patients do not have to travel to get the right care.

Rationalize the site of care — centralizing complex services with well-established volume-outcome relationships, while shifting routine services to lower-cost sites and delivery models.

Figure 1: MVC’s Early Metric Prototype Framework

Diagram illustrating a healthcare strategy focused on rationalizing site of care, expanding access, and standardizing best clinical practice using hospital icons and directional arrows. Key actions include centralizing complex services, decentralizing specialty expertise, minimizing variation across sites, and decanting routine services to lower-cost settings, with labels highlighting each approach.

Dr. Hari Nathan, MD, PhD, Medical Director of MVC, explained the significance of this work:

"The vast majority of hospitals in Michigan belong to a larger health system. While we have historically focused on hospital-level quality improvement, health systems have an opportunity and a responsibility to ensure consistently high quality across their sites…The new MVC Systems VBI is a first step towards providing actionable insights to health systems that wish to understand and improve quality across their hospitals."

Looking Ahead

This initiative marks the beginning of a multi-year effort. MVC intends for it to be shaped by the systems it is meant to serve while continuing to provide traditional service offerings and support for all sites. Opportunities to weigh in will be shared through upcoming presentations, breakout sessions, and networking events. MVC will continue to share updates on this VBI as work progresses.

0
View Post
MVC July Workgroups Highlight Sepsis Discharge Planning in CAHs and MVC’s Follow-Up Push Report

MVC July Workgroups Highlight Sepsis Discharge Planning in CAHs and MVC’s Follow-Up Push Report

In July, the Michigan Value Collaborative (MVC) hosted two virtual workgroup presentations. The first, a rural health workgroup focused on MyMichigan Health’s system-wide sepsis discharge planning follow-up initiative implementation at critical access hospital (CAH) sites. The second, a post-discharge follow-up workgroup, provided a walk-through of MVC’s recent Follow-Up push report including recommendations on practical applications of the report to identify opportunities for improvement. The MVC Coordinating Center hosts workgroup presentations once or twice per month, covering a variety of topics including cardiac rehab, post-discharge follow-up, sepsis, rural health, preoperative testing, and health in action.

Rural Health Workgroup: MyMichigan

During MVC’s first workgroup of July, Stephanie Pins-Schallip, MSA, CPHQ, Director of Value Based Care for MyMichigan Health System, shared how their health system developed and implemented a standardized post-discharge follow-up process for patients hospitalized for sepsis. Recognizing the lasting physical and cognitive effects many sepsis patients experience after discharge, Pins-Schallip explained how this initiative was designed to target care transitions, reinforce discharge education, and connect patients with appropriate follow-up care across all MyMichigan Health hospitals. Pins-Schallip also explained how this initiative aimed to drive at both MVC and Michigan Hospital Medicine Safety Consortium (HMS) goals and found ways to benefit sites within the system not engaged with these CQI incentive programs.

Rather than developing separate workflows at each hospital, MyMichigan Health pursued a standardized, system-wide approach. This allowed hospitals of varying sizes, including rural and critical access facilities, to implement consistent practices while also leveraging shared resources. The first step of the initiative was identifying a reliable phone number to provide on discharge paperwork that would connect patients to “on call” Hospitalist providers. By utilizing the health system’s existing 24/7 Transfer Center phone number and nurses already staffing this communication center hub, this minimized the need for additional personnel while also providing patients with a reliable point of contact after leaving the hospital.

Figure 1. Process for 24/7 Transfer Center Calls

A text-based process list outlining steps for patient follow-up after sepsis diagnosis, including discharge, post-discharge questions, 24/7 bed placement call, messaging to hospitalist, and hospitalist follow-up. The list is presented with a MyMichigan Health University of Michigan Health footer in blue and yellow colors.

Pins-Schallip reviewed a selection of sepsis patient calls to the Transfer Center noting that the volume of calls since initiation of the program have been fewer than five. However, the time between a patient calling and resolution of their question is estimated to be on average less than one hour. To date, patient concerns primarily revolve around antibiotic prescription questions.

Throughout implementation, Pins-Schallip noted that the team emphasized collaboration across departments, including hospitalists, nursing, care management, information technology, and executive leadership. Strong physician engagement and support from MyMichigan’s chief medical officer were instrumental in successfully implementing standardized workflows across the health system. With a relatively recent “go live” for this program of July 2026, Pins-Schallip explained that regular feedback gathered from frontline staff and patient data will allow the team to continue to refine the process over time and adapt workflows based on operational experiences.

During the discussion portion of the workgroup, participants enquired about adapting the workflow for other patient populations, implementation at smaller or independent hospitals, and strategies for gaining physician buy-in. Pins-Schallip encouraged organizations to begin with existing resources whenever possible, noting that many hospitals already have personnel or infrastructure that can be leveraged for post-discharge outreach. The importance of executive sponsorship and continuous evaluation were also identified as key strategies to ensure new workflows remain sustainable and effective.

MVC Rural Health Workgroup: July 14, 2026

Post-Discharge Follow-Up Workgroup: MVC Coordinating Center

The second workgroup in July featured a walkthrough of MVC’s new Follow-Up push report, presented by Janet Zhang, MPH, MVC Data Analyst, and Rachel Folk, MHA, MVC Site Engagement Coordinator. Developed to support hospitals interested in further understanding opportunities for improvement, the report provides hospital- and system-level insights into post-discharge follow-up patterns for patients hospitalized with congestive heart failure (CHF), chronic obstructive pulmonary disease (COPD), pneumonia, and sepsis. The report evaluates patterns of follow-up completed within three, seven, and 14-days after discharge using claims data from Blue Cross Blue Shield of Michigan and the Centers for Medicare & Medicaid Services.

Figure 2. MVC Follow-Up Push Report Details

Report details slide presents data parameters for a 30-day inpatient episode analysis covering four MVC conditions: CHF, COPD, Pneumonia, and Sepsis, with payer data date ranges for BCBSM PPO, MA, BCN HMO, BCN HMO MA, Medicare FFS, and Medicaid. Outcome measures include follow-up rates at 3, 7, and 14 days post-index, excluding visits after readmission, inpatient procedures, emergency visits, skilled nursing admissions, or inpatient rehabilitation..

To begin, Zhang reviewed the design of the report outlining how hospitals can use the system-level report to identify variation in follow-up performance across hospitals within the same system. At the system level this report can help leaders recognize opportunities to share successful practices across sites. At the hospital level, the report provides additional context through patient demographic information, non-medical drivers of health, and analyses stratified by payer and follow-up status. Together, these visualizations help members identify where opportunities to optimize follow-up may exist and prioritize improvement efforts.

Next, using a blinded sample report, Folk demonstrated how members can translate their own report findings into actionable quality improvement opportunities. Using the sample blinded report as a template, the remainder of the presentation guided participants through the next steps to finding actionable insights including the identification of areas of opportunity. In this particular report, Folk identified the following areas of opportunity:

  1. Sepsis has the lowest overall follow-up rates at three, seven and 14-days after discharge.
  2. All conditions show lower rates of seven and 14-day follow-up for Medicaid FFS and Dual Eligible payers.
  3. COPD and sepsis patients that attend follow-up within 14-days after discharge have lower 30-day risk-adjusted, price-standardized total episode payments.

As a next step, Folk walked participants through samples of related goal setting and suggested action items for two priority metrics: COPD 7-day follow-up and sepsis 14-day follow-up.

Between COPD and sepsis, the evidence-based action items reviewed included:

  • Schedule follow-up appointments before discharge
  • Confirm medication and follow-up provider access prior to discharge
  • Referral placement for smoking cessation and rehab as indicated
  • Document and review medical care action plans
  • Connect high-risk patients to care management follow-up
  • Flag patients discharged to home without home health as high priority

As part of an interactive discussion, participants were asked to vote on the follow-up intervention they’d most likely implement to drive further discussion.

Figure 3. Screenshot of Follow-Up Intervention Interactive Discussion

Diagram of five color-coded sticky notes outlining steps to improve post-discharge patient care, including scheduling follow-ups, outreach workflows, discharge planning barriers, clinic coordination, and data analysis. Each note features check marks and symbols in various colors, highlighting high interest and key focus areas for high-risk patients and priority conditions.

Throughout the discussion, participants shared experiences and challenges related to improving post-discharge follow-up within their organizations. While several members identified building structured outreach workflows for high-risk patients and scheduling follow-up appointments before discharge as high-priority areas, others discussed practical barriers to these interventions including coordinating care with independent primary care practices, transportation challenges, and difficulty reaching patients by telephone after discharge. Participants also exchanged ideas such as utilizing nurses on light duty to conduct follow-up calls, incorporating virtual and remote monitoring for rural populations, and partnering with home health agencies to reinforce patient education.

The discussion also highlighted opportunities to maximize the value of MVC reports by combining claims data-based insights with internal quality dashboards and other collaborative initiatives. Members expressed continued interest in additional education on integrating MVC reports with other quality improvement efforts and using benchmarking data to communicate opportunities and progress with organizational leadership.

MVC Post-Discharge Follow-Up Workgroup: July 23, 2026

For MVC members seeking additional support related to claims data, please reach out to us by email. MVC welcomes workgroup presenters from across Michigan to share their expertise, success stories, initiatives, and solution-focused ideas with MVC members. If you are interested in being a workgroup presenter please submit a presentation proposal here.

Off
View Post
Building Confidence in Claims Data: MVC’s Site Coordinator Education Program Continues to Grow

Building Confidence in Claims Data: MVC’s Site Coordinator Education Program Continues to Grow

Helping hospitals turn claims data into meaningful quality improvement (QI) action is central to Michigan Value Collaborative’s (MVC) mission. While MVC has long provided members with access to robust claims-based data and reporting resources, member feedback consistently identified a common challenge: many site coordinators and quality leaders wanted additional support in understanding how to interpret claims data and apply it to their organization’s improvement initiatives.

In response, the MVC Coordinating Center launched a series of site coordinator education modules. This structured learning experience was designed to strengthen claims data literacy while building participants’ confidence in using MVC resources to support local QI efforts. The program combines foundational education with practical application, peer collaboration, and individualized support to create a flexible learning experience that can be tailored to each participants’ needs.

After program registration began in January 2026, interest quickly exceeded expectations leading to the creation of three phased cohorts of quality leaders. To date, 40 site coordinators have enrolled in the program, representing 33 hospitals and 12 health systems, reflecting the growing demand for education focused on translating data into action.

A Four-Module Learning Experience

MVC’s site coordinator education program consists of four live, virtual modules that can be completed sequentially or independently depending on each participant’s experience and learning goals.

Module 1: Understanding MVC Fundamentals

The first module introduces participants to foundational knowledge about MVC including the collaborative’s mission, vision, data resources, P4P program, and engagement opportunities. Participants are additionally encouraged to develop a plan for how to meet yearly engagement goals based on preferred activities.

Module 2: Navigating MVC Data Resources

The second module reviews common claims data terminology and definitions, strengths and limitations of claims data, and explores how claims data can be used to supplement clinical data analyses to support QI efforts. Participants also learn to navigate the MVC registry, interpret push reports and identify meaningful performance measures.

Module 3: Applying MVC Resources to Quality Improvement

The third module examines opportunities to make connections between QI efforts and other aspects of MVC’s programming including fellow CQI collaborations and the MVC Component of the BCBSM P4P Program. This module aims to shift from understanding claims data to identifying applications of MVC resources to QI.

Module 4: Best Practice Sharing and Stakeholder Engagement

The fourth and final module focuses on translating the knowledge gained from the previous modules into the appropriate next steps for QI. Participants will have the opportunity to discuss best practices, challenges, and stakeholder communication strategies with fellow quality leaders engaged in similar areas of QI.

This curriculum is built around four complementary components that reinforce learning and encourage real-word application:

  • Foundational Learning: Live virtual sessions introduce key concepts, data resources, and other programmatic materials
  • Applied Case Studies: Independent exercises using hospital-specific reports help guide data interpretation and identify QI opportunities
  • Individual Coaching: One-on-one support from MVC Coordinating Center offers on-demand assistance with report interpretation and the development of customized reference tools
  • Peer Learning Forums: Integrated opportunities to connect with colleagues across Michigan to share experiences, discuss challenges, and exchange successful strategies

Together, these components create a learning environment that extends beyond traditional education by helping participants immediately apply knowledge to their own QI work.

As an example, following Module 2, participants are encouraged to complete a worksheet designed to apply concepts from the 1:1 session to their own organization’s data. Completed worksheets demonstrate strong engagement with the education framework, with participants identifying meaningful opportunities to improve quality of care in a variety of focus areas including readmissions, care transitions, cardiac rehabilitation utilization, and drivers of higher episode spending. Rather than jumping directly to solutions, participants thoughtfully used MVC claims data to generate hypotheses, identify additional clinical and operational information needed, and defined realistic next steps for QI.

A common theme across submissions is recognition that claims data can serve as a starting point for inquiry but must be combined with other data resources to drive QI strategies. Participants frequently identified the need to pair MVC data registry findings with health record data, chart reviews, frontline staff feedback, and internal quality dashboards to better understand underlying drivers. Participants also outlined practical next steps such as engaging multidisciplinary teams, validating findings locally, and integrating MVC data monitoring into existing QI initiatives. These outcomes demonstrate the program’s goal of helping site coordinators translate data insights into meaningful action.

Participant Feedback and Preliminary Outcomes

Evaluation is embedded throughout the education program to ensure the curriculum continues to meet participants’ needs. While the program is in its first year, initial feedback suggests it is already helping participants build confidence in using MVC resources. Following the completion of Module 1, site coordinators have reported an average confidence rating of 4.5 out of 5 in their ability to “describe MVC’s data resources and engagement opportunities.” These early results indicate that the program is successfully establishing a strong foundation for participants as they progress towards applying claims data to QI initiatives within their organizations.

Additionally, participants have highlighted the program’s impact on building both knowledge and confidence:

"Thank you so much for the time and education! I think this is exactly what I need as a new Quality Manager and Site Coordinator. Looking forward to the next module!"

"It was a great learning experience and I'm looking forward to learning more about how we can use this data for process improvement."

"This was a foundational review. I feel very confident with the foundational principles now. I look forward to becoming more comfortable with the claims data and using this data more confidently to improve our performance."

Looking Ahead

MVC’s education modules were designed to bridge the gap between data availability and practical application by combining several complimentary learning strategies. By equipping site coordinators with the knowledge and tools to not only interpret but also apply MVC data to QI efforts, the program aims to strengthen hospitals’ ability to identify improvement opportunities, support evidence-informed decision-making, and advance value-based care across Michigan.

As the program continues to expand, the MVC Coordinating Center is planning to scale up the program by training additional Coordinating Center team members to lead these sessions. Using participant feedback from post-module and post-program surveys, MVC will also continue to refine the curriculum to best meet the needs of site coordinators.

MVC looks forward to welcoming future cohorts of hospital quality leaders to the education program. If interested in joining the next cohort beginning in October 2026, please complete the registration form here.

Off
View Post
MVC Finalizes Summary Evaluation of PY 24-25 P4P Cycle

MVC Finalizes Summary Evaluation of PY 24-25 P4P Cycle

This year, the Michigan Value Collaborative (MVC) completed scoring and evaluation for Program Year (PY) 2025 of the MVC Component of the Blue Cross Blue Shield of Michigan (BCBSM) Pay-for-Performance (P4P) Program. This concluded a two-year program cycle encompassing the program methodologies and conditions utilized in PYs 2024 and 2025. MVC recently completed an evaluation of these two program years, which focused on hospital performance on average 30-day risk-adjusted, price-standardized total episode payments for the included conditions as well as utilization rates for the included value metrics across both program years.

The PY 2024-2025 program cycle utilized episode claims from 2021 through 2024. PY 2024 scoring compared performance year data from 2023 against baseline year data from 2021. PY 2025 scoring compared performance year data from 2024 against baseline year data from 2022.

Hospitals chose one episode spending condition from six available options for the PY 2024-2025 program cycle, including chronic obstructive pulmonary disease (COPD), colectomy (non-cancer), congestive heart failure (CHF), coronary artery bypass graft (CABG), joint replacement (hip and knee), and pneumonia. Among these six P4P conditions, joint replacement was the most selected condition (31), and pneumonia was the least frequently selected (6). Colectomy was not selected by any hospital.

Trends in average price-standardized episode payments showed a consistent decrease over the years for joint replacement. Both COPD and CABG showed relatively consistent trend in payments and had the highest payments in 2022 as seen in Figure 1. Both PYs saw an average decrease in payments in both CABG and joint replacement. Joint replacement was the largest contributor to the cost savings in this cycle with a decrease of $3 million dollars in PY 2024 and $1.9 million dollars in PY 2025.

Figure 1. Average Price-Standardized Episode Payment Trends for P4P Conditions (2020-2024)

Line chart showing 30-day total episode payments from 2020 to 2024 for five conditions: CABG, Pneumonia, CHF, COPD, and Joint. CABG payments remain highest around $50,000 with slight fluctuations, while other conditions show gradual increases between $14,000 and $18,000.

MVC further assessed the components contributing to total episode spending, and determined all conditions except COPD showed a decrease in spending in at least one episode component (i.e., index payment, professional services, post-discharge care, readmissions) across both PYs (Figures 2-3). Joint replacement showed decreased spending across all components in PY 2025 and across all components except readmissions in PY 2024. Similarly, all conditions demonstrated a reduction in spending for at least one post-discharge component in both PYs. Home health spending decreased across all conditions while inpatient rehabilitation spending increased for most conditions in both PYs. Emergency department spending also decreased for most conditions across both PYs.

Figure 2. Change in Average Price-Standardized Episode Components, PY 2024

Bar chart comparing 30-day episode component payments across five P4P conditions: CABG, CHF, COPD, Joint Replacement, and Pneumonia. Each condition's total payment is broken down into four color-coded components—Index (dark blue), Professional (orange), Post-Discharge (bright blue), and Readmissions (gray)—highlighting negative payment for CABG and Joint Replacement and positive payments for other conditions.

Figure 3. Change in Average Price-Standardized Episode Components, PY 2025

Bar chart comparing 30-day episode component payments across five P4P conditions: CABG, CHF, COPD, Joint Replacement, and Pneumonia. Payment components include Index (dark blue), Professional (orange), Post-Discharge (bright blue), and Readmissions (gray), showing negative total payments for CABG and Joint Replacement, and highest positive payment for Pneumonia.

In addition to selecting an episode spending condition, hospitals also selected one of seven available value metrics for the PY 2024-2025 program cycle. This included 7-day follow-up after CHF, 7-day follow-up after pneumonia, 14-day follow-up after COPD, 30-day inpatient readmissions after sepsis, 90-day cardiac rehab after CABG, 90-day cardiac rehab after PCI, and preoperative testing before low-risk surgeries (i.e., inguinal hernia repair, cholecystectomy, and lumpectomy). The 7-day follow-up after CHF metric (23) was the most frequently selected value metric followed by 90-day cardiac rehab after PCI (17). In contrast, 90-day cardiac rehab after CABG and 30-day inpatient readmissions after sepsis were the least frequently selected (5) value metrics.

Among the high-value metrics, hospitals that selected 14-day follow-up after COPD and 90-day cardiac rehab after PCI increased their utilization rate by 1.4% and 3.1%, respectively, from 2021 to 2023 (Table 1). In PY 2025, the utilization of 90-day cardiac rehab after CABG increased by 3.6% in 2024 compared to 2022 (Table 2). Among the low-value metrics, sepsis readmission rates decreased by 0.5% in PY 2024 and 7.0% in PY 2025. Preoperative testing rates decreased by 5% from 2022 to 2024 in PY 2025.

Table 1. Average Utilization Changes for P4P Value Metrics in PY 2024

Table displaying P4P value metrics with average utilization percentages for 2021 and 2023, alongside utilization change rates. Metrics include follow-up rates after CHF, pneumonia, COPD, cardiac rehab after CABG and PCI, inpatient readmissions after sepsis, and preoperative testing, with notable increases in 14-day COPD follow-up (1.4%) and 90-day cardiac rehab after PCI (3.1%).

Table 2. Average Utilization Changes for P4P Value Metrics in PY 2025

Table comparing average utilization rates for various healthcare metrics in 2022 and 2024, highlighting percentage changes. Metrics include follow-up periods after conditions like CHF, pneumonia, COPD, cardiac rehab after CABG and PCI, inpatient readmissions after sepsis, and preoperative testing, with notable increases in 90-day cardiac rehab after CABG and decreases in inpatient readmissions and preoperative testing.

Overall, the average total points earned remained relatively stable between PY 2024 (6.6) and PY 2025 (6.7), as shown in Figure 4. Average episode spending points decreased from 2.4 to 2.2, while average value metric points increased from 2.4 to 2.6, and average engagement points increased from 1.7 to 1.8 from PY 24 to PY 25.

Figure 4. Average Points Earned by Scoring Components in PYs 2024-2025

Bar chart comparing scores for PY 24 and PY 25 across four categories: Episode Spending Points, Value Metrics, Engagement Points, and Final Score. PY 25 slightly outperforms PY 24 in Value Metrics, Engagement Points, and Final Score, with both years scoring similarly in Episode Spending Points.

The distribution of total points earned by participating hospitals in PY 2024 and PY 2025 are shown in Figures 5 and 6, respectively. Approximately 15% of hospitals scored the maximum score of 10 points in PY 2024 and this proportion decreased to 10% in PY 2025.

Figure 5. Distribution of Hospital Total Points Scored for PY 2024

Scatter plot showing PY24 final scores of MVC hospitals participating in PY24-25 program, with scores ranging from 0 to 10. Data points are marked in blue, with mean score 6.6 in orange and median score 6.1 in gray, highlighting most hospitals scoring at or above median and mean.

Figure 6. Distribution of Hospital Total Points Scored for PY 2025

Scatter plot showing final PY 25 scores for MVC hospitals participating in PY 24-25 program, with scores ranging from 2 to 10. Plot includes orange line for mean score (6.7), gray line for median score (6.0), and dark blue dots representing individual hospital scores, highlighting most hospitals scoring at or above median.

Additional details are contained in the full report. Please contact the Coordinating Center for more details on the report or for any questions regarding the PY 2024-2025 cycle.

Off
View Post
Share Your Success Story at MVC’s Fall 2026 Collaborative-Wide Meeting

Share Your Success Story at MVC’s Fall 2026 Collaborative-Wide Meeting

The Michigan Value Collaborative (MVC) is now accepting presentation proposals for its fall 2026 collaborative-wide meeting, taking place Fri., Oct. 9, at the VistaTech Center in Livonia, Michigan.

Each collaborative-wide meeting provides an opportunity for members to learn directly from one another by sharing innovative approaches, practical lessons learned, and successful quality improvement strategies. MVC is seeking presentations that highlight quality improvement initiatives informed by MVC offerings, such as push reports, custom reports, registry data, or insights gained through participation in MVC events and peer learning opportunities.

Potential presentation topics include how your organization used MVC offerings to:

  • Benchmark performance against peer hospitals
  • Establish quality improvement goals and target metrics
  • Build leadership support for improvement initiatives
  • Identify variation in care across hospitals or communities
  • Measure the progress or impact of interventions
  • Inform the development of new workflows, programs, or best practices

We also welcome proposals showcasing other ways your organization has leveraged data to support quality improvement planning, implementation, or evaluation.

Partners may submit MVC's online presentation proposal form by Tues., July 28, to share their proposed topic. After proposals are reviewed, the MVC Coordinating Center will contact selected presenters to discuss their topic and provide guidance throughout the presentation development process.

As an added benefit, hospitals participating in the MVC Component of the BCBSM Pay-for-Performance (P4P) Program may earn 0.5 engagement points toward Program Year 2026 for presenting at an MVC event.

We hope you'll consider sharing your team's work and helping inspire improvement efforts across the MVC collaborative.

Presentation proposal deadline: Tues., July 28

Please reach out to the MVC Coordinating Center with any questions.

Off
View Post
MVC In-Person Networking Event: Continuing the Conversation – A Networking Dinner on System-Level Quality Metrics

MVC In-Person Networking Event: Continuing the Conversation – A Networking Dinner on System-Level Quality Metrics

On June 17, the Michigan Value Collaborative (MVC) welcomed 18 quality leaders representing 16 hospitals across six health systems for an evening of networking and collaborative discussion focused on the future of system-level quality improvement. The event built upon conversations from MVC’s spring collaborative-wide meeting, where participants identified opportunities and goals for measuring quality improvement within and across multi-hospital systems.

The in-person networking dinner provided an opportunity to further engage participants in hands-on activities designed to gather feedback, encourage peer learning, and refine ideas for future MVC reporting and metric design.

Choosing the Right Visualization

The evening began with an interactive exercise focused on data visualization. Participants were greeted by three mock-ups of system-level metric visualizations and prompted to vote on the metric they believed would be most useful to support quality improvement.

Photograph of a silent auction setup with informational signs displayed on a black tablecloth in a well-lit room with wooden floors and brick walls. Signs include a "SYSTEM-LEVEL METRIC" poster with blue and yellow design elements and bar charts showing data trends, while an MVC team member stands in the background near a window.

Pictured above is MVC Project Manager Emily Woltmann, PhD, MSW, standing alongside a display table at MVC’s June 2026 networking dinner

The group overwhelmingly preferred a visualization displaying consistency among hospitals within a health system for a given metric (Figure 1). Discussions with participants revealed that this approach would allow system leaders to quickly identify opportunities for shared learning, recognize high-performing hospitals, and prioritize improvement efforts where variation exists. This reinforced the importance placed on balancing meaningful information with a metric that supports action, as shared during the preceding spring collaborative-wide meeting breakout activity.

Figure 1. System-Level Metric Visualization Mock-Ups

A set of three infographic panels presenting different healthcare measurement ideas: system consistency, access, and site of care rationalization. Each panel includes bar charts with labeled axes and brief explanatory text highlighting variation between hospitals, excess travel distance, and minimum procedure thresholds for complex surgery.

Speed Networking Sparks Perspective

Following dinner, attendees participated in a “speed dating” style networking activity designed to generate diverse perspectives on system-level quality improvement reporting. Each participant received a customized deck of discussion prompt cards covering topics such as preferred benchmarking approaches, desired report features, future quality priorities, and characteristics of an ideal system-level metric (Figure 2).

Figure 2. Sample of Speed Networking Prompt Cards 1-3

Three discussion cards with blue borders and headings labeled "Discussion Card" contain questions and prompts for partner conversations. Each card includes fill-in-the-blank spaces for partner names, multiple-choice or open-ended questions about system comparisons, metric layers, and improvement goals, with checkboxes and lines for written responses.

Every five minutes participants paired with a new colleague, selected a new discussion card, and explored one of the prompts with their partner before rotating again. By the end of the activity, each attendee had connected with six different peers, allowing them to hear perspectives from hospitals and health systems across Michigan while also expanding their professional network.

Photograph of a group of people dining and networking in a restaurant with wooden floors and large windows providing natural light. The setting features dark blue walls, black chairs, and tables with food and drinks, capturing a casual social gathering atmosphere.

Pictured above is a group of healthcare quality leaders at MVC’s June 2026 networking dinner.

The prompt cards encouraged participants to think creatively about questions such as:

  • Should system-level reports compare hospitals with: other hospitals in a multi-hospital system, systems to other systems, or statewide benchmarks?
  • What stratifications would provide the greatest insight into performance variation?
  • What quality outcomes should become the next system-wide priority?
  • What information would make a system-level report most actionable?

These one-on-one conversations generated thoughtful discussion around identifying meaningful measures, balancing accountability with collaboration, and designing reports that support improvement across diverse organizations.

Wrap Up: Identifying Common Themes

The evening concluded with a facilitated group discussion where participants were encouraged to think about recurring themes from their conversations with peers.

Throughout the event, attendees emphasized the value of reports that are easy to interpret, highlight meaningful variation within multi-hospital systems, and provide actionable information. Participants also discussed the importance of thoughtful benchmarking, meaningful risk adjustment, and opportunities to drill down into data to better understand differences in performance. One common theme noted was the continued importance of understanding the variation and impact of non-medical drivers of health.

Perhaps equally valuable was the opportunity this event offered to strengthen relationships among quality leaders from across the state. By encouraging diverse conversations throughout the evening, participants exchanged ideas and made connections with peers they may not have otherwise met, creating new networks that extend across health systems.

One attendee shared:

“It was really nice and planned well. The activity was well thought out and engaging. I think I talked to almost everyone and there was movement. I didn’t know or realize that we could attend these sessions in other regions, and I was happy to connect with other hospitals in attendance…I felt it was worth the drive and time. I appreciate [MVC] planning and hosting it.”

The ideas generated during this networking event will help inform future system-level reporting and metric development within the MVC Coordinating Center. MVC looks forward to hosting additional networking events in the future to further increase collaboration and connection among its members. The next networking opportunity will be offered as an in-person dinner on Oct. 8, the evening before MVC’s fall collaborative-wide meeting. Registration is forthcoming.

Off
View Post
MVC June Workgroups Highlight Cardiac Rehab Telehealth & Using AI for Physician Feedback and QI in the ED

MVC June Workgroups Highlight Cardiac Rehab Telehealth & Using AI for Physician Feedback and QI in the ED

In June, the Michigan Value Collaborative (MVC) hosted two virtual workgroup presentations. The first was a cardiac rehabilitation (CR) workgroup that doubled as a Michigan Cardiac Rehab network (MiCR) telehealth forum focused on virtual group CR programming with a live action demonstration. The second workgroup, health in action, focused on how artificial intelligence (AI) can be utilized to improve follow-up care for patients. The MVC Coordinating Center hosts workgroup presentations once or twice per month, covering a variety of topics including CR, post-discharge follow-up, sepsis, rural health, preoperative testing, and health in action.

Cardiac Rehab – MiCR Telehealth Forum

MVC and the Blue Cross Blue Shield of Michigan Cardiovascular Consortium (BMC2) co-lead MiCR, an initiative to improve CR utilization across Michigan. In April, MiCR launched a new virtual forum series to help programs implement and sustain telehealth services under recently extended Medicare reimbursement policies. MVC’s June workgroup hosted the second MiCR telehealth forum in the series, this time featuring a demonstration of group virtual CR by Henry Ford Health’s Steven Keteyian, PhD, Director of Cardiac Rehabilitation & Preventive Cardiology, and Robert Berry, MS, ACSM-CEP FAACVPR, Clinical Coordinator for Cardiac Rehabilitation. The demonstration was followed by a discussion led by MiCR’s Co-Directors, Jessica Golbus, MD, MS, and Mike Thompson, PhD, MPH.

Telehealth Group Example

The workgroup began with a live mock CR telehealth session led by Berry and Keteyian. Three actors representing patients (played by MVC’s Jessie Souva, MSN, RN, C-ONQS; Emily Woltmann, PhD, MSW; and Rachel Folk, MHA) were guided through a simulated telehealth group CR session.

After presenter introductions, Berry began the group CR class greeting the patient actors, who each represented a specific patient profile and common cardiac condition (Figure 1).

Figure 1. Patient Profiles for Cardiac Rehabilitation Mock Session

Illustration featuring three female characters representing patients with heart conditions, each accompanied by brief medical histories and personal details. Key information includes ages, specific diagnoses like myocardial infarction, coronary artery bypass surgery, and chronic heart failure, along with lifestyle notes and emotional states, presented with distinct colors and icons for clarity.

To begin the session, Berry checked in with each patient on the Zoom session to document the type of exercise or equipment they would be using. As Figure 2 shows, the group session looked similar to a Zoom meeting with all patients exercising simultaneously from locations they established with their instructor in advance. Each patient confirmed their exercise modality, weight, and heart rate as they engaged in their chosen activity. Throughout the exercise process, patients were asked questions about how the exercise was feeling and whether it was causing any pain or discomfort. If a patient was having symptoms, Berry would follow up with more specific questions to help pinpoint the problem area and would give advice for either modifying the exercise, utilizing intentional breathing techniques, or taking a break.

Figure 2. Screenshot of Mock Telehealth CR Session

Screen capture showing what a virtual cardiac rehabilitation group session looks like. Shows three female participants and one clinical professional.

The patients had an opportunity to ask Berry follow-up questions before the end of the session such as:

  1. How will I know when it’s safe to push harder?
  2. Should I continue with CR exercises if my energy level is low today?
  3. When/how do I share my tracked vitals and symptoms with my providers?
  4. How do I get in touch with you between sessions?
  5. Can I still participate in virtual sessions if I’m at my home in Florida?

Following the live demonstration, Golbus and Thompson led participants in a question-and-answer discussion that further clarified how virtual and telehealth CR programs can work. Keteyian and Berry shared that patients must be at their home address for certain payers (Medicare/Medicaid), but patients with other insurance such as Blue Cross Blue Shield of Michigan (BCBSM) can be at any location within the state of Michigan.

Some attendees wondered about confidentiality considerations during the group session. Henry Ford Health said their programming has not required participants to sign an additional Health Information Portability Insurance Portability and Accountability Act (HIPAA) release form; however, they do remind patients to be aware of what information they share in the presence of others during the group session. For people who may be uncomfortable sharing personal information such as weight, different wording can be used. For example, “has your weight changed since your last visit?”

For patients who are unsure about participating in a virtual setting, Keteyian pointed out that they often have the patient come into the facility for the first session to participate as if they were at home in a virtual environment. This often alleviates any concerns about fully participating in a telehealth setting in the future. For those patients who do not have exercise equipment at home, Berry shared that patients can usually find some form of exercise equipment to borrow from a family member, church, or neighbor, or will choose to walk during their session.

A poll of participants showed the current state of CR programming for sites represented at the forum (Figure 3-4), with most sites indicating an interest in exploring both group and individual telehealth CR.

Figure 3. Polling Question: What format of virtual CR is your site considering?

Polling bar chart showing frequency of four formats of virtual cardiac rehab being utilized: Both, Group, Individual, and Neither. Both has highest value near 19, followed by Neither at 13, Group at 8, and Individual at 7, with vertical axis ranging from 0 to 20.

Figure 4. Polling Question: What best describes your site's status on starting a virtual CR program?

Pie chart displays stages of virtual cardiac rehabilitation (CR) implementation among organizations. Largest segment (21) represents organizations considering virtual CR, followed by 12 having conversations with staff or leadership, and smaller segments of 3 each for program development and piloting or delivering virtual CR, with color-coded legend for clarity.

According to the polls, most workgroup participants are still considering CR program development and starting to have conversations with staff and leadership. The MiCR team encouraged participants to take these poll questions back to their teams and leadership to inspire discussion on developing a hybrid or telehealth CR program.

MiCR Telehealth Virtual Forum: June 9, 2026

Health in Action Workgroup – Michigan Medicine

MVC was joined by the University of Michigan’s Alexander Janke, MD, MHS, MSc, Assistant Professor of Emergency Medicine, and Florian Schmitzberger, MD, MS, Clinical Assistant Professor of Emergency Medicine, for the health in action workgroup. Their presentation focused on how AI can be used for clinical feedback and quality improvement workflows in various healthcare settings.

Janke shared that emergency clinicians often make high-stakes clinical decisions when treating patients but then have limited feedback on how their patients do as they move through their care pathway. The rapid patient traffic through the emergency department (ED) continuously pulls these providers into new patient cases, preventing them from having the time to manually review past patient charts. A feedback loop project was intended to help address practice variation, missed learning opportunities, and potential quality blind spots. In preparation for the launch of the project, Michigan Medicine sought approval from the institutional review board (IRB), utilized a large language model (LLM) that is HIPAA compliant, and completed a health information technology services review. They also gathered clinical intelligence committee input, Epic database integration support, and input from the division of clinical informatics.

Methods

Previous approaches to reviewing patient progress included manual chart reviews (time consuming), self-imposed reminders via Epic’s in-basket messaging system, or by hearing about a patient’s follow-up by word-of-mouth. With the introduction of AI as a feedback tool, clinicians would have access to LLMs that can read charts faster than a human reviewer, create tailored summaries for the emergency medicine context, and provide another means for learning by supporting clinicians within their limited time. The AI feedback process follows this flow:

  1. Flag the case – A clinician marks a patient of interest during the shift via a health education research (HER)-integrated workflow
  2. Wait – A specified time later—three to 14 days—the platform queries downstream documentation
  3. AI summary – The University of Michigan generative pre-trained transformer (GPT) Toolkit (HIPAA-compliant LLM) generates a tailored clinical summary with a structured prompt
  4. Deliver – An email arrives in the clinician’s institutional inbox and includes a patient identifier for recall, an emergency medicine-focused summary, and answers to any free-text questions
  5. Reflect – The clinician reviews, learns from the outcome, and adjusts future practice enabling the adaptive learning cycle

The process begins with the provider flagging a patient case they would like educational feedback on in the future. Flagging a case is done in the “Disposition View” of the clinician decision tree in Epic (Figure 5). After the waiting period of the patient progressing through levels of care and finally discharging from the hospital, the HIPAA compliant UM GPT will send the provider a summary directly to their institutional email.

Figure 5. Disposition View in Epic MyChart

Screenshot of a medical software interface showing a disposition view with color-coded task categories and a follow-up order section. Tasks include work/school/sport excuses and patient portal letters in green and blue boxes, with a follow-up question form on the right allowing email summary timing selection and additional patient questions.

To validate that the AI summary was providing impactful and meaningful patient information, Schmitzberger and Janke developed a structured validation procedure for 200 AI-generated case summaries measuring for accuracy, conciseness, helpfulness, and completeness. The initial scoring showed that the AI summaries were quite accurate and helpful (Figure 6). This early positive feedback has prompted continued work on developing the use of this program in other areas of the institution.

Figure 6. Structured Validation of 200 AI-Generated Case Summaries

A table displays four performance metrics for validation of 200 AI-generated case summaries with scores out of 5: Accuracy (4.79), Conciseness (4.86), Helpfulness (4.60), and Completeness (4.28). Each metric is labeled in red text below the blue numerical scores.

Results

Currently the program includes 170+ unique users including faculty, residents, and physician assistants, who are averaging approximately 40 – 70 requests each week, and 30+ power users (a clinical or other staff member who maximizes Epic electronic health record (EHR) efficiency using advanced tools and navigation).

The top three case follow up themes for requested summaries included diagnosis/etiology (~40%), disposition/course/ICU (~17%), and test/imaging results (~10%). With strong approval in the emergency department and endorsement from other committees, the goal is to expand this feedback program to multiple areas within the institution.

Next Steps & Discussion

Janke presented two pathways in which they would like to proceed with expanding the AI feedback program. The first would be horizontal scaling across the institution, including integration into the graduate medical education program for internal medicine/hospitalist care. Second, they would like to apply their approach to a quality measure from the Michigan Emergency Department Improvement Collaborative (MEDIC).

The presenters addressed participant questions about sharing learnings between providers, patient record privacy, and potential applications in other areas like pediatric care and fall prevention, with participants suggesting connections with the Michigan Hospital Medicine Safety Consortium (HMS) metrics and exploring CEUs as incentives for provider participation.

MVC Health in Action Workgroup: June 25, 2026

MVC welcomes workgroup presenters from across Michigan to share their expertise, success stories, initiatives, and solution-focused ideas with MVC members. Please reach out to us by email if you are interested in being a workgroup presenter or submit a presentation proposal here.

Off
View Post
MVC Thanks Presenters from the First Half of 2026

MVC Thanks Presenters from the First Half of 2026

The MVC Coordinating Center wishes to express its heartfelt appreciation for the 39 generous healthcare professionals who stepped forward to present during MVC’s first and second quarter virtual workgroups, spring collaborative-wide meeting, and Michigan Cardiac Rehabilitation network (MiCR) virtual forums on telehealth rehabilitation. The MVC Coordinating Center would not be able to deliver the variety of high-quality educational opportunities without the contribution of these dedicated volunteer presenters. We know that MVC’s members and partners have many demands on their time from within their own organizations and beyond. Nonetheless, these 39 guest speakers shared their data, innovative approaches, best practices, and insights to support our shared goals of peer learning and high-value care delivery for Michigan patients. We appreciate you contributing in this important way. You DO make a difference!

Join us in giving these folks a well-deserved round of applause:

Cardiac Rehab Workgroup

  • Robert Berry, MS, ACSM-CEP, FAACVPR, Clinical Coordinator Cardiac Rehabilitation, Henry Ford Health Henry Ford Hospital
  • Zach Johnson, BS, ACSM-CEP, Lead Exercise Physiologist for Cardiac and Pulmonary Rehab Programs, Corewell Health
  • Steven Keteyian, PhD, Bioscientific Clinical Staff, Division of Cardiovascular Medicine, Henry Ford Health Henry Ford Hospital
  • Laura Meiste, RN, BSN, Manager of Cardiac and Pulmonary Rehab, Holland Hospital
  • Greg Scharf, BS, CEP, CCRP, Cardiopulmonary Rehab System Manager, MyMichigan Health
  • Mike Thompson, PhD, FAHA Associate Professor of Cardiac Surgery, Michigan Medicine
  • Tyelor Wymer, CEP, BS, Cardiology Supervisor, University of Michigan Health-Sparrow

Health in Action Workgroup

  • Jennifer Hengy, BSN, RN, Internal Quality Improvement Specialist Sr., Corewell Health Farmington Hills
  • Alexander Janke, MD, MHS, MSc, Assistant Professor of Emergency Medicine, University of Michigan
  • Eugene Laveroni, MD, Chief of Surgery, Corewell Health Farmington Hills
  • Florian Schmitzberger, MD, MS, Clinical Assistant Professor of Emergency Medicine, University of Michigan
  • Leslie Smith, RPh, JD, BCPS, BCIDP, Clinical Pharmacist Specialist, Corewell Health Farmington Hills

Post-Discharge Follow-Up Workgroup

  • Steven Frazier, BA, RN, ACM-RN, Director of Quality and Patient Safety Post-Acute, MyMichigan Health System
  • John Hagan, DO, Medical Director - Care Coordinating Center, MyMichigan Health System

Rural Health Workgroup

  • Heather Baumeister, BSN, RN, CRHCP, Director of Healthcare Practices, McKenzie Health System

Sepsis Workgroup

  • Tami Garcia, MSN, RN, Sepsis Process Lead, Michigan Medicine
  • Carly Redstone, MSN, RN, Sepsis Coordinator, Michigan Medicine

Spring Collaborative-Wide Meeting Panelists

  • Alex Callaway, MBA, CPHQ, CPPS, Regional Quality Director, Munson Health System
  • Emily Nerreter, MBA, CPC, CRC, Pay for Performance & Registries Manager, Henry Ford Health System
  • Stephanie Pins-Schallip, MSA, CPHQ, Director of Value Analysis & Enhancement, MyMichigan Health

Spring Collaborative-Wide Meeting Breakout Session Speakers

  • Belinda Dokic, CPhT, BA, MBA, Post-Acute Care Manager, Trinity Health Alliance of Michigan
  • Cindy Ingersoll, RN, BSN, CCM, Post-Acute Care Manager, Trinity Health Alliance of Michigan
  • Adrien Ross, MSN, RN, CPHQ, Lead, Quality Improvement Specialist, Corewell Health
  • Heidi Steinhebel, RN, BSN, CCM, Senior Associate Director of Care Management, Trinity Health IHA Medical Group
  • Caitlin Valley, MHA, MPH, CHES, Director of Quality and Population Health, Trinity Health IHA Medical Group
  • Larrea Young, MDes, Multimedia Design Project Manager, Healthy Behavior Optimization for Michigan

Spring Collaborative-Wide Meeting Poster Presenters

  • Jennifer Bennett, MBA, BSN, RN, Lead Quality and Patient Safety Coordinator, Henry Ford Health Madison Heights-Warren Hospital
  • Sara Hagerman, BSN, RN, Community Hospital Quality Lead, University of Michigan Health – Sparrow Carson
  • Ginger Johnson, OTR, Manager Post-Acute Care, Populance, Henry Ford Health System
  • Mike Johnson, Primary Care Practice Administrator, Munson Healthcare East Region
  • Liz Monk, System Director of Patient Care Manager, Munson Healthcare
  • Gloria Rey, PA-C, MPH, Director Post-Acute Care, Populance, Henry Ford Health System
  • Audra Stoker, PMP, Manager Post-Acute Care Network Development, Populance, Henry Ford Health System

Virtual Networking Event

  • Richard Wylde, MSc, Deputy Director of Improvement at Leeds and York Partnership NHS Foundation Trust

MiCR Virtual Forums on Telehealth Cardiac Rehabilitation

  • Robert Berry, MS, ACSM-CEP FAACVPR, Clinical Coordinator of Cardiac Rehabilitation, Henry Ford Health
  • Samantha Fink, BS, Administrative Manager, Domino’s Farms Cardiology, Michigan Medicine
  • Steven J. Keteyian, PhD, Bioscientific Clinical Staff, Division of Cardiovascular Medicine, Henry Ford Hospital
  • Diane Perry, MS, ACSM-CCEP, CHWC, Certified Clinical Exercise Physiologist, Michigan Medicine
  • Kat Steenson, MS, Clinical Exercise Physiologist, Henry Ford Health
Graphic design featuring silhouettes of eight business people standing above bold text reading "THANK YOU" on a blue bokeh background. Two circular shapes contain Michigan Value Collaborative logo on left and text "From all of us at MVC" on right, expressing gratitude from the organization.

The MVC members and partners who attend MVC events appreciated these presenters, too. Here are just a few of the many glowing survey responses MVC received about presenters and their content in the first half of 2026.

Screenshot of five positive testimonial quotes about MVC workgroups and collaborative-wide meetings, displayed in white text with orange quotation mark icons on a blue background. Quotes highlight benefits such as insightful content, flexible conversation, valuable information sharing, and practical application for sepsis process development in emergency department triage.

As a reminder, past workgroups and virtual networking event recordings can be viewed on MVC’s YouTube channel, and presentation slides and materials from MVC’s spring collaborative-wide meeting can be viewed here.

Do you have valuable information to share?

Whether you are new to presenting or a seasoned pro, the MVC Coordinating Center is here to support you every step of the way. From exploring topic ideas to preparing information and managing event logistics, our team makes the experience of presenting easy and comfortable. The P4P points you can earn as a presenter are a great benefit to your organization, too. For more information about presenting, contact the MVC Coordinating Center or submit a proposal here.

Off
View Post
CQI Spotlight: Michigan Radiation Oncology Quality Consortium

CQI Spotlight: Michigan Radiation Oncology Quality Consortium

Cancer treatment is complex, and for many patients, radiation therapy is a critical part of their care journey. Yet the delivery of radiation therapy—how much is given, how often, and with what level of precision—can vary widely across providers, with meaningful implications for outcomes, side effects, and overall patient experience.

The Michigan Radiation Oncology Quality Consortium (MROQC) was founded in 2011 in partnership with Blue Cross Blue Shield of Michigan (BCBSM) to better understand and reduce variation in radiation therapy practices across Michigan - specifically related to the use of advanced technologies such as 3D conformal radiation therapy (3D-CRT) and intensity-modulated radiation therapy (IMRT) in breast and lung cancer treatment. The BCBSM-funded CQIs play a crucial role in driving healthcare quality improvement in Michigan. MVC is excited to continue highlighting the innovative contributions of individual CQIs like MROQC and the ways in which MVC’s data support high-value care initiatives across the portfolio.

At the time of MROQC’s founding, there was growing interest in understanding how these technologies were being used across institutions and ensuring that newer, more complex approaches were being applied appropriately and consistently. By bringing radiation oncology providers together in a statewide collaborative, MROQC created a platform to compare treatment patterns, share best practices, and evaluate how different approaches affected patient outcomes. Over time, the work of MROQC expanded beyond treatment utilization to focus on broader quality improvement and value-based care initiatives. Today, the consortium supports multiple disease-site quality initiatives, collects patient-reported outcomes, and collaborates with clinicians and health system partners to improve the safety, effectiveness, and patient-centeredness of radiation therapy across Michigan.

Services and Benefits to MROQC Members

One of the most unique aspects of MROQC is its strong culture of collaboration across institutions that would traditionally be competitors. Radiation oncologists, medical physicists, nurses, dosimetrists, radiation therapists, abstractors, and administrators from across Michigan work together to analyze data, identify opportunities for improvement, and implement changes that benefit patients statewide. It is through this collaborative infrastructure that MROQC supports radiation oncology providers, hospitals, and care teams across Michigan.

Members benefit from:

  • Participation in statewide quality improvement initiatives across multiple disease sites
  • Access to real-time performance dashboards and benchmarking data
  • Collaborative working groups where clinicians share best practices and develop new quality measures
  • Educational opportunities and training resources
  • Support for research, publications, and national presentations
  • Participation in innovative incentive programs such as the BCBSM Gold Card program, which reduces prior authorization burden for high-performing facilities.

Through this collaborative model, the MROQC Coordinating Center team (Figure 1) enables clinicians and institutions to learn from each other, implement best practices more quickly, and continuously improve patient care. This has allowed Michigan to become a national leader in radiation oncology quality improvement, demonstrating how data-driven partnerships between member providers and payers can improve outcomes, reduce costs, and enhance patient experience.

Figure 1. MROQC Coordinating Center Team

Photo of 23 MROQC team members standing outside in front of a building

MROQC’s Key Initiatives and Achievements

Several initiatives highlight how MROQC’s collaborative model has been translated into meaningful improvements for patients and providers across Michigan.

Expanding use of shorter, evidence-based radiation treatments

MROQC has helped increase the adoption of hypofractionated radiation therapy, which delivers effective treatment in fewer sessions. For example, the use of accelerated whole breast radiation therapy has increased by more than 60% statewide, reducing treatment burden for patients while maintaining excellent outcomes.

Similarly, initiatives promoting shorter treatment courses for bone metastases have helped 78% of MROQC patients receive effective pain relief with fewer visits to the clinic, improving quality of life while reducing healthcare costs.

Improving treatment safety by reducing radiation exposure to critical organs

Through collaborative treatment planning initiatives, MROQC members have worked to reduce radiation exposure to organs such as the heart and esophagus during cancer treatment. These efforts have helped lower the risk of treatment-related complications and improve the safety of radiation therapy across the state.

Reducing administrative burden through the Gold Card program

In partnership with BCBSM, MROQC helped develop and implement the Gold Card program in 2017, which allows high-performing radiation oncology facilities to receive automatic prior authorization approval for radiation therapy treatments. This program rewards facilities that consistently meet quality improvement criteria and has significantly reduced administrative burden while allowing clinicians to begin treatment more quickly for patients.

Together, these successes demonstrate how statewide collaboration and real-world data can drive improvements in patient outcomes, treatment efficiency, and value-based care (Figure 2).

Figure 2. MROQC Performance: The Right Treatment at the Right Time

Infographic presents key statistics on radiation treatment effectiveness and advancements for breast, lung, bone metastases, and prostate patients from 2015 to 2024. Uses blue icons and bold percentages to highlight milestones such as 16K breast patients receiving targeted radiation, 89% lung patients avoiding esophagus radiation, 78% bone metastases patients benefiting from treatment reducing time and improving quality of life, and over 1K prostate patients receiving high precision radiation.

MROQC’s current initiatives focus on advancing high-value radiation therapy while strengthening the data infrastructure needed to support statewide quality improvement. Across its disease-site working groups - breast, lung, prostate, and metastatic cancer - MROQC continues to promote initiatives that improve treatment quality, reduce variation in care, and support evidence-based practice. Current efforts include improving treatment planning standards, expanding the use of shorter radiation therapy courses when appropriate, and monitoring treatment safety measures that reduce toxicity and improve patient outcomes.

MROQC is also expanding its quality improvement work to include brain metastases, building on the success of the existing metastases working group. This effort will help better understand treatment patterns and outcomes for patients receiving radiation therapy for brain metastases and identify opportunities to standardize and improve care.

For prostate cancer, MROQC partners with the Michigan Urological Surgery Improvement Collaborative (MUSIC) to better understand care across the full patient journey - from diagnosis through treatment. This collaboration allows the teams to link data across specialties and identify opportunities to improve coordination and outcomes for prostate cancer patients across Michigan.

Together, these initiatives ensure that MROQC continues to support clinicians across Michigan with the data, collaboration, and infrastructure needed to improve radiation therapy care for patients statewide.

Graphic quote from Lori Pierce, MD, highlighting MROQC as a unique radiation oncology-based collaborative quality initiative. The text emphasizes MROQC's role in setting standards for radiation-associated healthcare outcomes and efficient use of healthcare dollars in treating breast, lung, prostate cancers, and metastatic disease.

Addressing Non-Medical Drivers of Health Outcome Variation

Another important focus area is improving access to care for all Michigan cancer patients. MROQC is addressing variation in care through both data collection and targeted quality improvement efforts. The consortium collects data on demographic and social factors that may influence access to care or treatment outcomes. These data allow the collaborative to identify patterns of variation across facilities and patient populations and develop targeted interventions to address those outcome gaps. In addition, MROQC established the M-EQUAL committee, which focuses specifically on improving access to high-quality cancer care. The committee works to expand non-medical drivers of care data collection, is aiming to develop barriers-to-care quality measures and provides education and resources to member institutions to improve access and outcomes for all patients. Ultimately, MROQC’s efforts to leverage statewide data with collaborative learning translate into tangible benefits for patients: shorter and more convenient treatment courses, fewer complications, and more consistent care regardless of where they are treated.

Looking Ahead: Strengthening Data Infrastructure and Member Engagement

MVC and MROQC are currently partnering to explore a new data opportunity using claims-based analysis. This effort is looking to evaluate whether reduced fraction palliative radiotherapy for painful bone metastases among MROQC-participating sites results in lower overall healthcare utilization compared to episodes of care attributed to non-MROQC sites.

MROQC knows from experience that quality improvement requires more than collecting data - it requires building trust among clinicians, ensuring data accuracy, and creating opportunities for teams to learn from one another. Over the years, MROQC has seen how powerful a collaborative model can be when clinicians across institutions come together around shared goals. That is why the MROQC Coordinating Center continues to strengthen member engagement and is investing heavily in data infrastructure and reporting tools to support the collaborative with trustworthy, accurate data. These efforts include improving dashboards and reporting capabilities for participating facilities and preparing for a transition to a more scalable data platform to support future growth, analytics, and research. Visit the MROQC website to learn more about its team, offerings, and successes.