0
View Post
Patient-Reported Outcomes Improve Quality, Equity of Care

Patient-Reported Outcomes Improve Quality, Equity of Care

For several years, patient-reported outcomes (PROs) have been a topic of interest, in part due to increased utilization of electronic data and the integration of delivery systems. PROs are defined by the Food and Drug Administration (FDA) and National Quality Forum as "any report of the status of a patient's health condition that comes directly from the patient, without interpretation of the patient's response by a clinician or anyone else." In short, PRO tools ask patients questions to measure how they feel and what they are experiencing. With patient-reported outcome measures (PROMs), patients provide information about their health, quality of life, and functional status, either in absolute terms (e.g., pain severity rating) or in response to treatment changes (e.g., new nausea onset). The goal of gathering this information from the patient’s perspective without any interpretation from a healthcare provider is to improve both the quality of care being delivered and health outcomes.

The use of PROs has a variety of potential benefits. They can elicit enhanced patient engagement, be used to clarify the patient’s priorities and thus improve shared decision-making between patients and providers, and can bring to light any benefits or harms of interventions. The potential impact of PROs, therefore, is substantial because involving patients in their healthcare is linked to a myriad of positive patient outcomes. For example, based on a review of studies investigating patient participation, some of the benefits to patients include:

  • increased satisfaction and trust,
  • empowerment,
  • greater self-efficacy to manage health,
  • higher quality of life,
  • better understanding of condition and personal requirements,
  • improved adherence to medical treatment plans,
  • improved communication about symptoms with positive and lasting effects on health.

Ever increasing in its availability, the use of PROs is included in clinical investigations, healthcare practice, healthcare management, and various regulatory or reimbursement areas. As the patient continues to become more central to healthcare, they are in the best position to determine if their healthcare objectives have been achieved. PROMs are not the same as measures reported by patients on their experience of the healthcare system, such as being treated with dignity or waiting too long; however, patient-reported outcome-based performance measures (PRO-PMs) are beginning to find their way into healthcare and may integrate such measures. To help understand the relationship between PROs, PROMs, and PRO-PMs, see Figure 1, which was designed by the Centers for Medicare and Medicaid Services (CMS) in their supplemental guide on PROMs.

Figure 1.

To gather PROs, the tools and instruments known as PROMs must measure criteria that are identifiable, valid, and reliable. Most often these are general or disease-specific self-completed questionnaires, scales, or single-item measures that provide a score for any of the following:

  • functional status,
  • health related quality of life,
  • symptom and/or symptom burden,
  • personal experience of care,
  • health-related behaviors.

Generic PROMs often delve into areas covered by a variety of different conditions, allowing for comparisons across multiple medical conditions. These PROMs help with evaluation and implementation of care provision methodology and equality of service delivery. Some may even provide a cost-effectiveness component. Disease-specific PROMs identify the impact of definitive symptoms on the condition. PROMs can be used as either the primary or secondary outcome measure of a study or trial, and most studies use a combination of disease-specific and generic PROMs.

Measurement tools integrate other existing data (biological, genetic, clinical, and physical) to assess how a patient is functioning regarding their overall health, quality of life, mental well-being, or satisfaction with a healthcare process. Using all these data sources provides a more complete picture of the patient’s health journey and allows for patients and their providers to share decision-making and define individualized care. They also provide a unique opportunity to identify inequalities in healthcare access and treatment.

When utilizing PROMs, practitioners must plan for how the information will be collected and utilized. PROMs can be collected in a variety of ways, including face-to-face interviews, online or paper questionnaires, telephone interviews, or diaries. When deciding which PROMs to utilize, it is important to consider the preferences of patients, providers, and any other involved decision-makers. It is also essential to consider the cognitive, physical, demographic, and socioeconomic barriers that may exist for the patient to ensure they have adequate accommodations to participate. The length, schedule, and timeframe of assessments should also be appropriately assessed, along with any permissions needed to use the information. Lastly, the PROMs should be easy to score and interpret, actionable, and able to facilitate clinical decisions.

The use of PROs is here to stay. The hope is that improvements in interoperability, data governance, security, privacy, and ethics will allow greater integration of PROs. In turn, PROs will allow patient preferences, needs, and health outcomes to further drive value-based healthcare.

0

Joint, CHF Top Members’ Selections for MVC P4P Program

The MVC Coordinating Center recently distributed condition selection reports for Program Years 2022 and 2023 of the MVC Component of the Blue Cross Blue Shield of Michigan (BCBSM) Pay-for-Performance (P4P) Program. The reports were provided in conjunction with details pertaining to the condition selection process, as well as changes to the scoring methodology, cohort assignments, and bonus points available. More details about those changes was published in a previous MVC Coordinating Center blog.

Eligible members were tasked with reviewing these reports and returning their condition selection form at the end of August. Each participating hospital selected two of the seven available conditions for PY22 and PY23: spine surgery, joint replacement, chronic obstructive pulmonary disease (COPD), coronary artery bypass grafting (CABG), congestive heart failure (CHF), colectomy (non-cancer), and pneumonia. The condition that was selected by the most participants was joint replacement with 41 hospitals selecting it, followed closely by CHF with 40 selections. COPD was selected by 32 hospitals. See Figure 1 for a depiction of the total selections for each condition.

Figure 1.

Although the two conditions selected most frequently were consistent across a variety of hospitals, the overall selections varied somewhat from region to region and by hospital size or type. For instance, hospitals with fewer than 100 beds were much more likely to select pneumonia as one of their two conditions than peers with more than 100 hospital beds (see Figure 2).

Figure 2.

Conversely, larger hospitals that perform more complex procedures made up the totality of selections for spinal surgery, colectomy, and CABG. Still, joint replacement and CHF were the most commonly selected conditions among all hospital sizes.

Similarly, CHF and joint replacement were popular among all hospitals regardless of location type, such as urban or rural (see Figure 3), or location within the state (see Figure 4), with the exception of Region 4 hospitals selecting COPD more frequently than joint replacement.

Figure 3.

Figure 4.

With the majority of hospitals focusing on both joint replacement and CHF, the MVC Coordinating Center hopes that continued participation at the joint and CHF workgroups will result in meaningful collaboration among members. MVC will also continue to offer events for virtual networking with facilities and physician organizations (POs) within a member’s geographic region (see Figure 5). These regional networking events provide additional opportunities to connect and share knowledge with peers who may share your hospital’s priorities. For instance, the next Coffee, Chat, and Collaborate virtual networking event takes place among hospitals and POs in Region 1 on Monday, September 13, at noon. Members from Region 1 interested in attending can register here.

Figure 5.

P4P cohorts were reassigned for PY22 and PY23. These changes were also detailed in the new technical document, and the new cohort assignments were published on the MVC website. The cohorts were not intended to group hospitals that are exactly alike; rather, they created a reasonably comparable grouping from which MVC can complete statistical analyses.

This program began in 2018, when BCBSM allocated 10% of its P4P program to an episode of care spending metric based on MVC data. This metric measures hospital performance using price-standardized, risk-adjusted 30-day episode payments for BCBSM Preferred Provider Organization (PPO), Medicare Fee-for-Service (FFS), BCBSM Medicare Advantage, Blue Care Network (BCN) Health Maintenance Organization (HMO), and BCN Medicare Advantage.

If you would like to receive notices about the MVC workgroups or have questions about any aspect of the MVC Component of the BCBSM P4P Program, please contact the MVC Coordinating Center at michiganvaluecollaborative@gmail.com.

0

MVC Coordinating Center Launches Health Equity Report

As hospitals begin to identify lessons learned since the start of the pandemic, providers are keenly aware of the prevalence and exacerbation of existing health inequities. Despite the fact that many providers are increasingly interested in addressing the social determinants of health (SDOH) and equitable access to care, communities of color and other minorities that are statistically more impacted by SDOH and socioeconomic status (SES) have endured even wider gaps in health outcomes and care this past year. For many hospitals and physician organizations, the way forward requires the application of a health equity or social risk lens across the board, so that basic healthcare and quality improvement decision-making can be maximized for all patient populations, not just those with fewer social risk factors. The MVC Coordinating Center is, therefore, proud to have released its first MVC Health Equity Report to its membership on Wednesday morning.

MVC began developing metrics for its membership in this area over the past year so providers might better understand where inequities are materializing within the four walls of their hospitals and beyond. One popular method for identifying low-SES patients is by determining where someone lives and applying population-level metrics to the individual. Examples of this would be using the Area Deprivation Index (ADI) or Social Vulnerability Index (SVI). Both indexes are based on census tract data and provide SES characteristics about a population within a specific geographic location (i.e., a census tract), including risk factors such as poverty, education level, transportation access, and housing security. However, in developing the MVC Health Equity Report, the MVC Coordinating Center elected to utilize a patient-level metric of SES that is compatible with MVC claims data. As a result, the report identifies low-SES patients using dual-eligibility status.

Dual-eligible beneficiaries are patients that are eligible for both Medicare and Medicaid. In the MVC Health Equity Report, dual eligibility is defined as having been eligible for both Medicare and Medicaid at any point during the year of the index admission and is limited to patients that were at least 65 years old at the time of admission. Medicaid eligibility is a good indicator of SES when using claims data since it is income-based, and studies have shown that there is a strong association between low-income status and adverse health outcomes. Dual eligibility allows MVC analysts to identify Medicaid-eligible patients within its more extensive Medicare data set for analyses. Medicare data on the MVC registry currently includes claims data from 1/1/2015 through 9/30/2020. The resulting reports prepared for members focuses on episodes occurring between 2017 and 2020, or between 2017 and 2019 if the circumstances of 2020 resulted in unusual case counts by facility.

In developing this report, there was a conscious decision to exclude any sort of comparison group alongside each individual hospital's metrics. This is because the socioeconomic factors of a hospital’s patient population cannot be changed, and there is great diversity between hospitals throughout the state and within geographic regions. For those reasons, benchmarking was not the intention of this report. However, it is important to note that across the state, the data analyzed by the MVC Coordinating Center consistently indicates that dual-eligible patients have poorer outcomes than their non-dual-eligible counterparts, including longer lengths of stay, higher readmission rates, higher post-discharge emergency department utilization, lower rates of office visits post-discharge, higher rates of post-discharge outpatient procedures, and higher utilization of skilled nursing facilities. Blinded sample graphs for length of stay (Figure 1) and readmission rates (Figure 2) were created using data from three distinct, large hospitals in order to showcase some of these differences.

Figure 1.

Figure 2.

Members receiving reports will see a variety of graphs depicting, for example, total episode payment trends, 30-day readmission rate trends, and post-acute care utilization. Also provided is a table outlining a hospital or region’s highest volume of conditions within its dual-eligible population (see Figure 3 for a blinded sample). The purpose of this table is to help members better understand the proportion of dual-eligible patients at their hospital and the prevalence of various conditions within that population. It will also help members to better understand their report overall by identifying the conditions and procedures driving the various metrics included within it.

Figure 3.

MVC is eager to do more in this space in the months ahead. With the recently added Michigan Medicaid data on the MVC registry, the Coordinating Center has a new opportunity to more closely examine the types of disparities that are prevalent in healthcare. Additionally, with the addition of 13 rural or critical access hospitals to the collaborative in the past 12 months, the Coordinating Center aims to expand its metrics outside of the episode structure to examine population health metrics. This will allow for better understanding about healthcare delivery and how outcomes differ in rural regions compared to urban.

The MVC Coordinating Center wants to hear feedback from its members. With the addition of Medicaid data, we are working hard to develop more metrics and reports that focus on health equity. If you have any questions, comments, or suggestions, please contact the MVC Coordinating Center at michiganvaluecollabortative@gmail.com.

0

Predictive Analytics Assist with Chronic Disease Prevention

The healthcare system has an immense wealth of information at its digital fingertips. Big data is constantly expanding from sources such as digitized patient records, patient wearables, medical apps, genome datasets, monitoring devices, and more. A critical challenge facing hospitals and health systems today is in effectively identifying strategies and personnel to utilize big data in a way that influences clinical care. Those that succeed in this task will find themselves in a much better position to advance care and improve patient outcomes.

One developing strategy to convert big data sets into improved patient outcomes is the use of predictive analytics, an approach that differs from what many hospital quality improvement departments are currently utilizing. For example, the Michigan Value Collaborative (MVC) Coordinating Center has been helping hospitals identify opportunities for quality improvement since 2013 by aggregating and analyzing payor claims data and presenting the results on the registry and in analytics reports. The goal of these efforts is to help hospitals compare utilization against peers and draw important insights across a range of medical and surgical procedures. This retrospective approach helps MVC members to learn from their past performance in order to pursue meaningful, observable improvements within their buildings. It is one piece of the big data puzzle. Predictive analytics, on the other hand, allows clinicians to utilize big data before their patient experiences significant healthcare services or treatments. As its name denotes, this approach identifies prevention opportunities before the incidence of disease by predicting a patient’s risk. This is especially important for diseases that require early detection for optimal treatment and survival.

Unlike Robotic Process Automation (RPA), which is also on the rise in health systems across the country, predictive analytics is performed by Artificial Intelligence (AI). This means that computer systems will perform tasks typically requiring human intelligence, including analyses and decision-making. In some ways, this strategy mimics what physicians have long been doing at a patient’s bedside: collecting a patient’s medical history and risk factors in order to tailor their treatment and advice. This process is essential in evaluating a patient’s risk of developing chronic diseases, which often run in their family or are more likely due to socioeconomic factors. An article from the University of Illinois Chicago posits that predictive analytics represent a significant potential for cost savings if they help clinicians and their patients prevent the onset of chronic diseases, one of healthcare’s costliest areas.

“On a population-wide level, predictive analytics can help greatly cut costs by predicting which patients are at higher risk for disease and arrange early intervention, before problems develop,” the article stated. “This involves aggregating data that are related to a variety of factors. These include medical history, demographic or socioeconomic profile, and comorbidities.”

The Centers for Disease Control and Prevention (CDC) states that, “90% of the nation’s $3.8 trillion in annual health care expenditures are for people with chronic and mental health conditions.” So the potential cost savings from reducing chronic disease treatment are significant.

Using predictive analytics in a clinical setting can leverage both patient records and socioeconomic factors. Medical records will often include family history of chronic diseases such as cancer, diabetes, and heart disease, which would make a patient more likely to develop the condition themselves. In addition to family history, a patient’s socioeconomic factors (e.g., education, employment, and environment) and lifestyle choices are significant predictors of chronic disease. A study in the American Journal of Preventive Medicine outlines how researchers used predictive analytics to screen for cardiovascular disease risk from social determinants of health, and ultimately guide clinician treatment options. The researchers also suggest that large databases about social determinants of health variables, especially environmental ones, are not as readily available as they should be, and are an important area of opportunity for future data collection efforts.

A similar application of this technology was used in a study published by Cancer Immunology Research to predict lung cancer immunotherapy success. In the study, researchers used an AI algorithm to identify changes in patterns from CT scans that were previously not detected by clinicians, which ultimately predicted how well a patient would respond to immunotherapy. This suggests that predictive analytics can help improve the accuracy of diagnoses and treatment.

Of course, the applications for predictive analytics extend beyond chronic disease prevention and treatment. In the past year, researchers have also used predictive analytics to forecast outcomes for patients positive for COVID-19. In The American Journal of Emergency Department Medicine, a published study validated a tool that helps physicians predict adverse events among patients presenting with suspected COVID-19. The study suggests that the algorithm and scores can help physicians decide when to hospitalize or discharge patients during the pandemic. Therefore, predictive analytics appear to also provide insights that enhance treatment.

Many additional articles (such as one article from Health IT Analytics) and published studies recommend predictive analytics for its potential benefits. As with any technology, however, it is not without its risks. The use of AI brings about concerns for privacy, especially since hospitals must properly steward patient data and comply with HIPAA regulations. But there are several other considerations identified in a recent Deloitte analysis (see Figure 1), not the least of which is ensuring the algorithm doesn’t introduce bias that disproportionately harms minorities and communities of color. Predictive analytics may also present evaluation challenges. Once algorithms are validated, their widespread use in clinical settings should be confirmed for their efficacy, which requires measuring the absence of disease.

Figure 1.

The potential benefits of predictive analytics are variable and significant; however, as healthcare learns to integrate AI technologies, it will be important to keep its risks in mind and address them accordingly. The MVC Coordinating Center endeavors to assist its members through their data analytics journey by providing insights into specific data sets. When pursuing additional technologies or analytic tools, the Coordinating Center encourages members to volunteer as a sounding board and resource for other members. If your hospital or physician organization is currently utilizing AI or considering it with your patient data, we encourage you to reach out so MVC can share your experience with others. You can reach the MVC Coordinating Center at michiganvaluecollaborative@gmail.com.

0

Growth On the Horizon for Robotic Process Automation in Healthcare

Hospital quality improvement teams have an increasingly difficult task ahead. Their efforts to improve quality of care across a wide range of medical services must be balanced with the need to expand their facility’s capacity, ensure proper handling of sensitive data, adhere to strict procedures, cut costs, and adapt to the limitations of a pandemic. This work poses challenges both organizational and operational. Even though patient care is the primary focus for hospital staff, they must maintain a constant stream of paperwork and other administrative tasks such as data entry, scheduling appointments, billing, and managing claims paperwork. Robotic process automation (RPA) presents an opportunity to decrease these administrative costs and streamline some operations.

RPA is defined as software that can automate repeatable, rule-based processes. RPA interacts with the assigned applications in the same way that a human does, logging into a given system and following a defined set of keystrokes and rules. It is not the same as artificial intelligence (AI)—there is no decision-making capacity. RPA can only offload manual, high-volume computer processes. The primary benefit of RPA, therefore, is its ability to free up time for humans to complete more complex tasks, such as interfacing with patients or interpreting data.

RPA is a burgeoning field recommended by consulting groups such as Deloitte, McKinsey, and Bain & Company. Although RPA hasn’t had sufficient time to make its way into academic literature, it is spreading quickly in all types of industries. For example, according to Deloitte’s Global RPA Survey, more than half of their 400 respondents from multiple industries were already pursuing automation with as many as 72% looking to add RPA in the next two years.

“RPA exceeds adopters’ expectations not only when it comes to the rapid rate of ROI increase, but also when it comes to facilitating compliance (92%), improved quality and accuracy (90%), or improved productivity (86%),” the report read. The report also suggests that the benefits of utilizing RPA may include cost reductions, boosts to productivity, more stable workflows, and fewer human errors, among others (see Figure 1).

Figure 1.

Source: Summit Healthcare

Healthcare as an industry has the potential to significantly benefit from offloading administrative tasks to bots. According to McKinsey, the healthcare sector has the potential to automate around 36% of tasks. They suggest that the greatest potential for healthcare payers is in areas such as claims processing, customer service, and billing activities (see Figure 2).

Figure 2.

Hospitals and health systems have pursued RPA in these areas as well and found success. One example written about in Forbes recently described the efforts of Baylor Scott & White Health (BSWHealth), an academic medical system with 52 different hospitals and the largest not-for-profit provider in Texas. BSWHealth uses RPA to automate “claim statusing” in its insurance collections department. The bot helps to check the status of outstanding insurance claims that, previously, a human employee would have to do by logging into multiple payer websites or placing phone calls. The RPA bot uses screen-scraping technology that mimics keystrokes the employee would enter to obtain claim statuses from payers. As a result, an abundance of claims—those that are accepted and scheduled to be paid—never clutter the employee’s desk. Instead, the employee only sees those that are denied and require human attention, resulting in outstanding claims being addressed faster. BSWHealth is pursuing a variety of RPA projects like this one across all of its revenue cycle departments. They reduced their total FTEs by over 20% while simultaneously reducing payer denials by 20%.

Success stories like this one are particularly exciting for hospitals struggling to manage their case load amidst the pandemic. Daily operations and procedures have been severely impacted financially and operationally by coronavirus. A recent survey conducted by the World Health Organization identified that almost half of the countries surveyed (49%) reported strains on their ability to treat diabetes, with 42% reporting the same for cancer and 31% struggling to properly manage cardiovascular emergencies. As a result, companies are pursuing automation opportunities more than ever before (see Figure 3), with Bain & Company reporting as many as 81% of hospitals pursuing RPA initiatives.

Figure 3.

Still, according to a 2019 white paper by The Economist, “extensive” use of automation is only used by half of healthcare organizations, and healthcare in general is among the most resistant to adopting it. Some healthcare organizations remain cautious for a variety of reasons, including concerns about initial investments, maintenance costs, and the possibility of failure. The same white paper also proposes that data privacy and security concerns might be a significant hinderance to RPA efforts, as well as a deficit in the skill sets needed to develop the bots.

Plus, any discussion of RPA sometimes begets fears about job replacement. In some scenarios, health systems have seen an overall decrease in FTEs after putting RPA initiatives in place. However, the overall goal is usually to reallocate effort toward more high-level, cognitive projects in a way that increases productivity without replacing people. If an administrative task requires no higher-level thinking, then giving it to an RPA bot will free up time for clinical staff to attend to patient care rather than paperwork. In fact, according to Harvard Business Review, most new adopters of RPA have promised their employees that it won’t result in layoffs.

Despite hesitations, health systems are likely to test out RPA projects in the coming years in response to the current state of affairs. Hospitals have been forced over the past year to find efficiencies where they can. RPA bots appear to have the potential for a variety of benefits, not the least of which is flexibility to redeploy personnel to areas in need of increased staffing. As RPA begins to make its way into the literature, it will be important to consider research findings about best practices going forward.

It will also be helpful going forward to share lessons learned with peer institutions. One of the goals of the MVC Coordinating Center is to support collaboration and idea sharing across its membership. If any member is implementing RPA projects and would be interested in sharing their experience with others, please contact the MVC Coordinating Center team at michiganvaluecollaborative@gmail.com.
0

MVC Registry Expands with Addition of Medicaid Episodes

The Michigan Value Collaborative (MVC) Coordinating Center recently added Medicaid data to its registry. This update reflects the culmination of many months of work to acquire, process, clean, and add the data, which became available on July 16 to MVC registry users. The current data set is from 1/1/15 through 9/30/19, which amounts to claims from 1/1/15 through 12/31/19. MVC data sources now comprise over 80% of Michigan’s insured population. This represents an additional 1.8 million covered lives (see Figure 1). MVC’s data sources now include Medicare FFS, Commercial Blue Cross Blue Shield of Michigan (BCBSM) PPO, Medicare Advantage BCBSM PPO, Commercial Blue Care Network (BCN) HMO, Medicare Advantage BCN, and Michigan Medicaid.

Figure 1.

The addition of Medicaid data will impact, among other things, the distribution of MVC episodes across its portfolio of payers. Medicare is still the dominant payer within MVC data with more than 641,747 episodes. However, the new distribution of MVC episodes by payer (Figure 2) showcases that Medicaid is now the third-largest payer in MVC data, accounting for 18% of total episodes.

Figure 2.

MVC currently serves 97 participating hospitals, including critical access members, and 40 physician organizations in Michigan. The proportion of Medicaid episodes in MVC data by facility (Figure 3) varies significantly across MVC’s membership, with some members attributing less than 5% of their episodes to Medicaid and some near 60%. For the bulk of MVC’s membership, between 10% and 30% of their episodes are in Medicaid, which represents a significant increase in the total episodes they can now utilize. For some MVC hospitals, the number of episodes they have in MVC data may double if they have a large share of Medicaid patients.

Figure 3.

MVC currently provides data on 40 defined conditions. The addition of Medicaid data is likely to impact certain conditions more than others in keeping with the types of procedures and conditions most prevalent with Medicaid-eligible populations. The top five Medicaid conditions include sepsis, C-section, vaginal delivery, cholecystectomy, and chronic obstructive pulmonary disease (COPD), so members are more likely to see changes to their utilization data for those conditions. The number of episodes being added for each condition is outlined in Figure 4.

Figure 4.

The Medicaid data will also allow for the creation of new data visualizations and reports that capture information not previously available. For example, MVC analysts recently generated two new Medicaid-based maps (Figures 5 and 6) that help visualize utilization and location information for the Medicaid population. Figure 5 represents the patient Zip codes that can be attributed to Medicaid episodes in MVC data, with Zip codes appearing darker if a larger percentage of Medicaid patients reside there. This allows members to see those communities near their own facilities that are likely home to the Medicaid patients they serve.

Figure 6 also represents the percentage of episodes attributed to Medicaid patients, with darker colors representative of higher percentages; however, Figure 6 connects these Medicaid episodes to MVC member facilities rather than Zip codes and visualizes the total number of episodes in addition to the percentage. Together, these two figures provide MVC members with more information about their Medicaid populations as well as the extent to which utilization varies between peer facilities in the same region.

Figure 5.

Figure 6.

These maps are the first example of new outputs that are possible with the addition of Medicaid data. The MVC Coordinating Center plans to produce additional reports for members that leverage the new data set. One area of interest is the social determinants of health. Since Medicaid provides medical assistance to disabled and low-income individuals, statistical analysis using this data often reflects trends tied to low socioeconomic status populations. Ideally, this data set will allow MVC and its members to invest more attention and resources into equity-based quality improvement projects.

The MVC Coordinating Center is eager to learn which topics are of greatest interest to members that integrate Medicaid claims. If your team has specific ideas that could help guide this work, please contact MVC at michiganvaluecollaborative@gmail.com.
0

The Behavior Change Puzzle of Medication Non-Adherence

Non-adherence to a prescribed medication regime for chronic disease management is known to lead to poor health outcomes and higher healthcare costs. A number of studies have shown that adherence is usually around 50% or less, even when medications are provided free of charge. What seems to be less clear is how best to address poor adherence; one study points out that most of the current interventions meant to improve adherence rates are too complex or ineffective, and that the research in this field is rife with weaknesses and bias.

But as with most quality improvement initiatives, understanding the source of the problem is an important first step. In this case, identifying the reasons for non-adherence is an important starting point for reducing barriers and improving patient outcomes. Many factors may affect whether a person takes their medications, including the patient themselves, the disease being treated, the health system and team, and the type of therapy involved. One study’s survey of 10,000 patients found that the most cited barrier to taking one’s medications was simply forgetfulness (24%). This was followed by perceived side effects (20%), high drug costs (17%), and a perception that their prescribed medication will have very little effect on their disease (14%).

The same study illustrated the various patient, provider, and external factors that can play a role in medication adherence using the figure below (Figure 1). If any one of these factors were to present a challenge for the patient, then they are at risk of not taking their prescribed medications on time and any related medical issues.

Figure 1.

While some interventions such as pill box aids and electronic reminders have helped patients when forgetfulness is the issue, these do not address factors such as concerns about side effects and medication-related harm, or uncertainty about the importance of taking long-term prescribed medications. These issues have the potential to be addressed through shared decision-making and education from clinical experts such as pharmacists and nurses.

One review analyzed the impact that social determinants of health has on medication adherence. Disadvantageous circumstances in social and living conditions are associated with an increase in chronic disease, and it is believed that these same challenges impact a person’s ability to manage their health. When an individual is facing food insecurity, unemployment, and unstable living conditions, they are sometimes unable to address their health concerns emotionally or financially. The review found that medication adherence was negatively impacted by food insecurity and housing instability, although few studies identified other specific social determinants that influence non-adherence to medications beyond these two. In fact, education, income, and employment status did not significantly correlate with adherence to a medication regime.

The Michigan Value Collaborative (MVC) would like to hear how your institution is addressing medication non-adherence, especially in the chronic disease patient population. This will be an upcoming topic at a chronic disease management workgroup. Please contact MVC at michiganvaluecollaborative@gmail.com for information about attending.

0

Condition Selection Process Announced for MVC Component of BCBSM P4P Program

This week the Michigan Value Collaborative (MVC) Coordinating Center announced the condition selection process for program year (PY) 2022 and PY 2023 of the MVC Component of the Blue Cross Blue Shield of Michigan (BCBSM) Pay-for-Performance (P4P) program. The timeline for each program year’s stages are detailed in Figure 1.

Figure 1.

In the announcement, hospitals were tasked with selecting two conditions for which they will be evaluated and returning their condition selection form to the Coordinating Center by Friday, August 13, 2021. The announcement also outlined changes to the scoring methodology, cohort assignments, and bonus points available.

The Coordinating Center’s recent announcement included condition selection reports with targets for each condition option that may help inform hospitals’ selection decisions. Each participating hospital will choose two of the seven available conditions for PY22 and PY23: spine surgery, joint replacement, chronic obstructive pulmonary disease (COPD), coronary artery bypass grafting (CABG), congestive heart failure (CHF), colectomy (non-cancer), and pneumonia. When selecting conditions, the Coordinating Center recommends reviewing your data in the registry and considering several factors for each condition, including case counts and identifiable areas with the greatest cost opportunities. The Coordinating Center also recommends considering where resources are currently being directed in your facility and potentially aligning with those efforts.

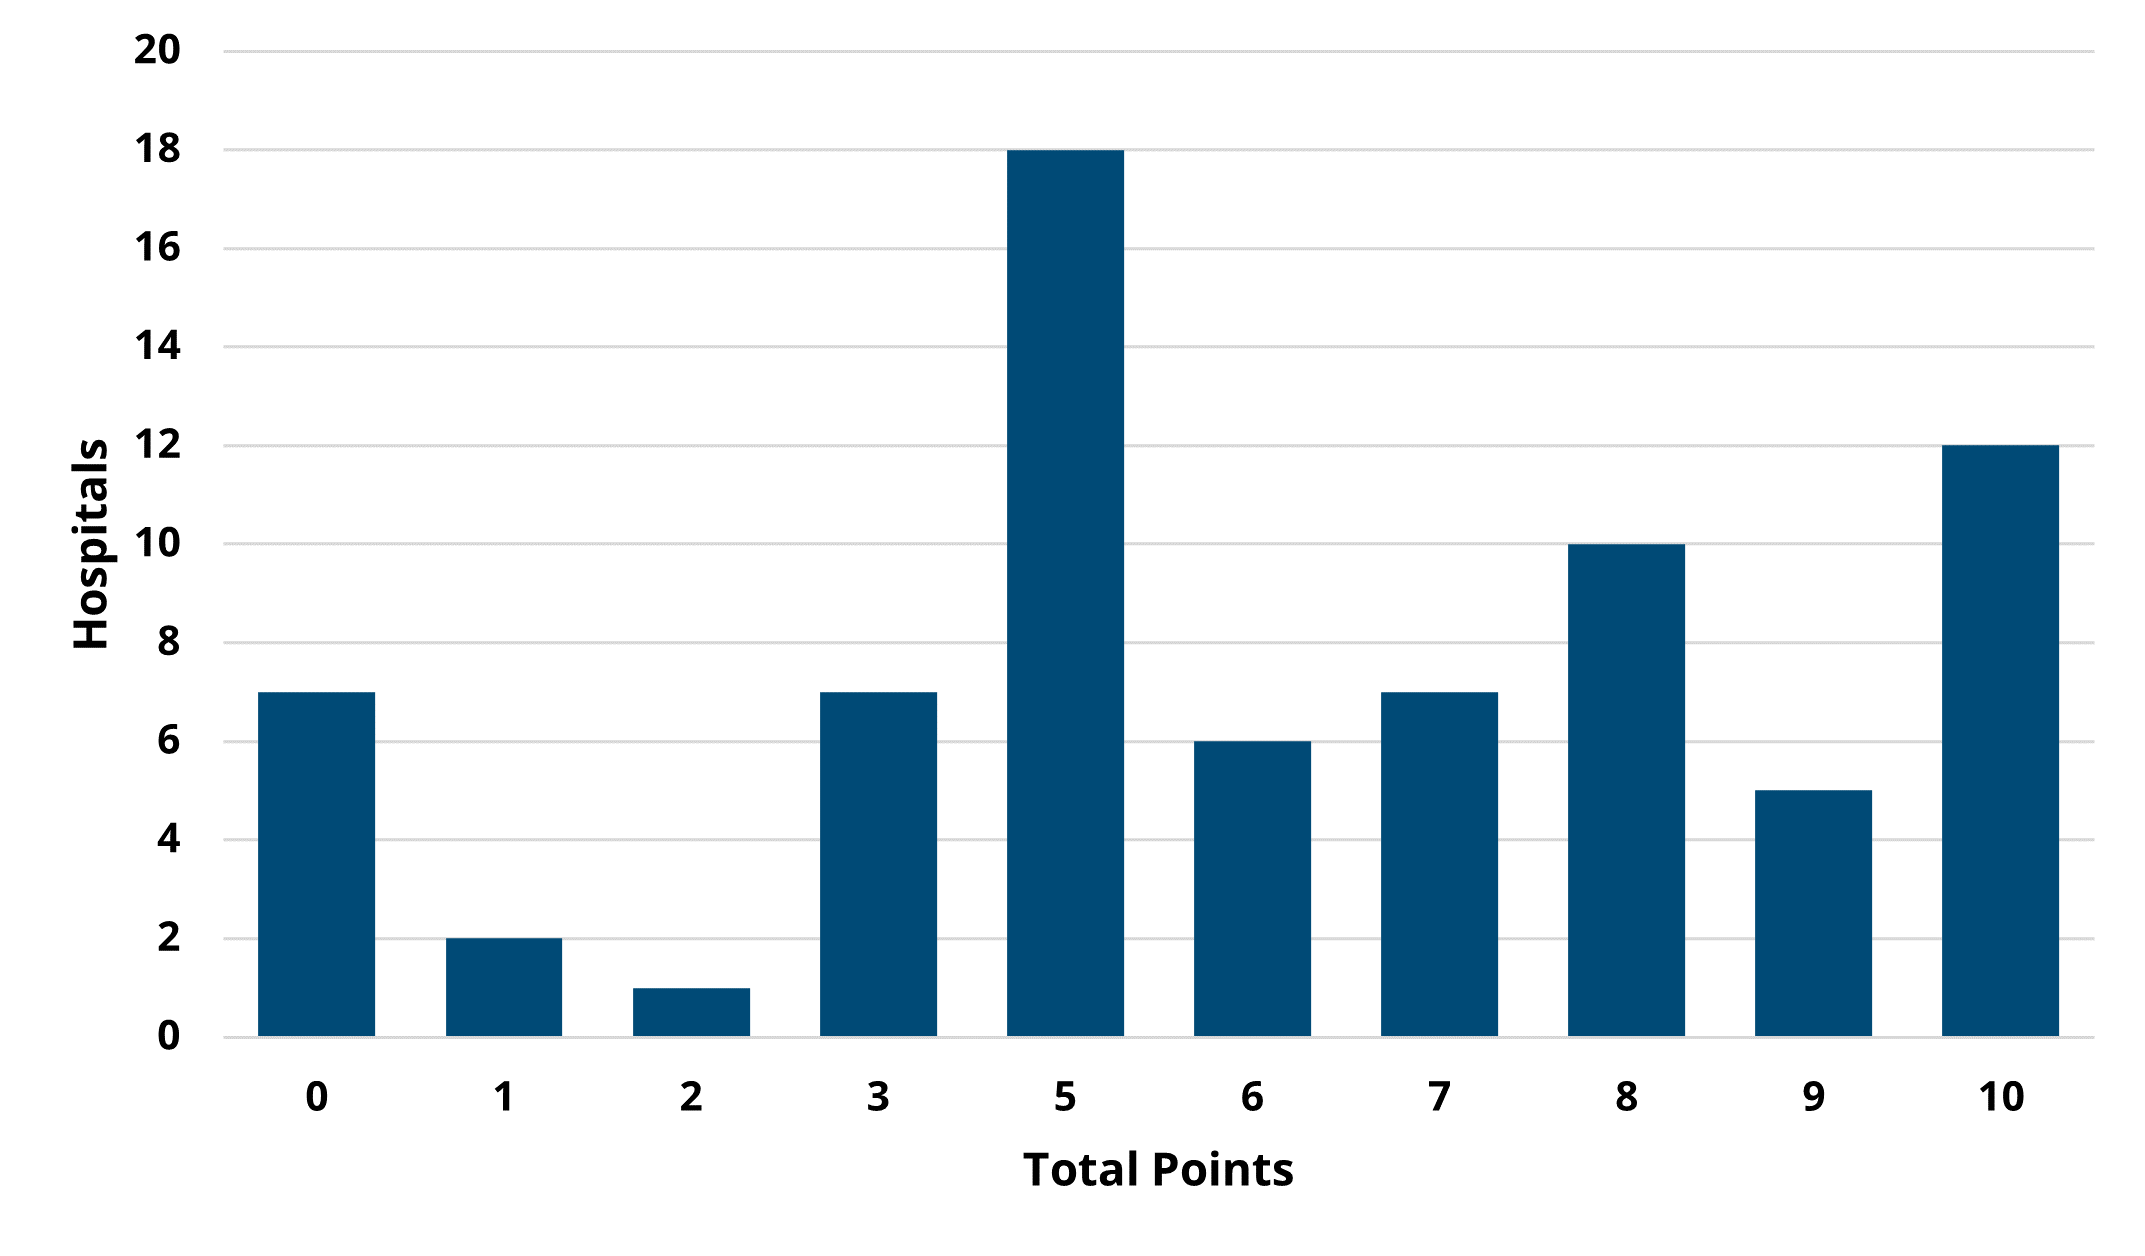
One notable change from prior program years is the methodology by which hospitals earn achievement and improvement points. Hospital scores will continue to be based on a hospital’s risk-adjusted, price-standardized total episode payments for two selected conditions, and they can still earn a maximum score of 10 points. However, the improvement and achievement scores will become more similar in order to be placed on the same scale. As such, the achievement equation will change from being based on rank within MVC cohort at performance year to being based on distance from MVC cohort mean at baseline year. Similarly, the improvement equation will utilize the distance from the hospital’s mean at baseline. These new equations (see Figure 2) as well as complete descriptions of the updated methodologies are reviewed at length with examples in the technical document.

Figure 2.

P4P cohorts have also been reassigned for PY22 and PY23. These changes are also detailed in the technical document, and the new cohort assignments can be found on the MVC website. The cohorts are not intended to group hospitals that are exactly alike; rather, they create a reasonably-comparable grouping from which MVC can complete statistical analysis.

The final change is to the awarding of bonus points. In place of the previous 5% cohort reduction bonus, participants can instead earn bonus points by completing two questionnaires (one per selected condition) and submitting these to the Coordinating Center by November 1st of each program year. The purpose of this is to gather examples of quality improvement initiatives in operation at MVC member hospitals to share with the Collaborative. Moving forward, this will help support members in reducing costs through collaboration.

Each of the changes mentioned above are designed to deliver a more transparent, intuitive, flexible, and fairer P4P program. The Coordinating Center will offer an explainer webinar to answer questions and walk through the details of these changes in more detail. The webinar will be offered on two dates: the first is scheduled for Thursday, July 29 from 11:00-12:00 pm, and the second is on Tuesday, August 3 from 1:00-2:00 pm. Both webinars can be accessed using the following Zoom link: https://umich.zoom.us/j/95502303999. Participants can also call +1 301 715 8592 (meeting ID #955 0230 3999). For those interested in the explainer webinar who are unavailable on both dates, a recording of the first webinar will be available. If you are interested in receiving a link to this recording, please email the MVC team at michiganvaluecollaborative@gmail.com.

0
View Post
Introducing Carla Novak, MVC’s Administrative Assistant

Introducing Carla Novak, MVC’s Administrative Assistant

I am excited to be joining the MVC team as the Administrative Assistant. I was born in Ohio (Go Buckeyes!) and moved to Michigan when I was young. I have always had a desire to work on the clerical side of healthcare, which led me to several roles within Michigan Medicine.

Most recently, I worked as a Referral Coordinator for the U-M Division of Cardiovascular Medicine, where I obtained insurance authorizations for various procedures. Prior to this I worked as an Administrative Assistant on an inpatient unit within the hospital, providing support to roughly 90 employees and our management team. I also processed payroll, reimbursements, PTO requests, and more.

As MVC’s Administrative Assistant, I look forward to assisting with the day-to-day needs of the Coordinating Center. I am thankful for the opportunity to work with this great team and look forward to getting to know each and every one of you!

0

MVC Sepsis Workgroup Review

The Michigan Value Collaborative (MVC) holds bi-monthly virtual workgroups on six different clinical areas of focus. The goals of these workgroups are to help bring collaborative members together to discuss current quality improvement initiatives and/or challenging areas of practice. These six different clinical areas include chronic disease management (CDM), chronic obstructive pulmonary disease (COPD), congestive heart failure (CHF), diabetes, joint, and sepsis. At the most recent MVC sepsis workgroup, the discussion centered around post-sepsis syndrome and how organizations are identifying and caring for patients that are diagnosed with this condition.

The group learnt that for several organizations, post-sepsis syndrome is not well understood, identified, or diagnosed which prompted some interesting discussion around this topic and the topic of sepsis itself. A number of studies have suggested that due to an aging population with an increased number of comorbidities, frequent use of immunosuppression therapy, expanded use of invasive procedures and medical devices, and multi-drug resistance, the incidence of sepsis has increased. However, the same studies share that in-hospital mortality has decreased. Credit for this decrease in mortality is associated with improved detection, establishing treatment earlier, improvements in critical care, and the implementation of evidence-based guidelines established by the Surviving Sepsis Campaign.

While survivors of sepsis have increased, identification of post-sepsis syndrome is garnering attention as many patients can suffer from a number of serious and long-lasting complications including delusions, debilitating muscle and joint pains, extreme exhaustion, poor concentration, reduced cognitive functioning, as well as mental health issues and concerns. Certain patients, such as the elderly, those with a preexisting condition, or those diagnosed with severe sepsis are more likely to develop post-sepsis syndrome.

Currently, the most effective method of treatment for post sepsis syndrome is to prevent an initial incidence of sepsis. Primary prevention includes hand washing, vaccination uptake, and managing any chronic conditions. Pharmacological strategies for the treatment of sepsis and the prevention of post-sepsis syndrome include:

• Antibiotic stewardship, to improve the use of antibiotics and using prolactin levels to decide when to stop antibiotic use.
• The use of H2-receptor agonists over proton pump inhibitors to prevent stress ulcers.
• Low dosage and short-term use of medications.
• Early mobility to prevent functional decline.

Non-pharmacological strategies for the prevention and treatment of sepsis to avert post-sepsis syndrome include:
• Sepsis treatment and the identification of post-sepsis syndrome education for frontline workers.
• Post-sepsis education for family and caregivers of sepsis survivors along with available resources.
• Vision/Hearing Aids to reduce the risk of delirium, as well as adaptive equipment.
• Referral for rehabilitation post sepsis survival.

MVC collaborative members from multiple facilities including Michigan Medicine, Henry Ford Wyandotte, Sparrow, and Spectrum Health discussed different ways in which they are working to identify sepsis as early as possible within their facilities. Many organizations have instituted a sepsis program, and some are looking to onboard a sepsis navigator. Dr. Jessie King, Program Director, shared information about the Post-Intensive Care Unit (ICU) research and treatment clinic (PULSE) now screening discharged ICU patients for post-sepsis syndrome, and the Michigan Medicine return on investment analysis which helped initiate a sepsis program. You can find the recording of the workgroup here.

The MVC Coordinating Center is interested in hearing how you are treating sepsis and the prevention and treatment of post-sepsis syndrome. We would like more hospitals to share the work they are doing around these important topics so if you would like to present at or attend an upcoming MVC workgroup, please email MVC at the michiganvaluecollaborative@gmail.com