0
View Post
September MVC Workgroups Highlight Initiatives for COPD Readmissions, Health Equity

September MVC Workgroups Highlight Initiatives for COPD Readmissions, Health Equity

Since its founding, a core component of MVC’s strategy has been organizing opportunities to collaborate with and learn from peers, leading to the ongoing facilitation of MVC workgroups. MVC has hosted workgroup presentations twice per month in recent years, and this year’s workgroups are focused on six topic areas: post-discharge follow-up, sepsis, cardiac rehabilitation, rural health, preoperative testing, and health in action. Going forward, MVC will publish a monthly blog to highlight key takeaways and shared resources from the prior month’s presentations. In doing so, all MVC members and partners may utilize and benefit from the content regardless of their live participation.

September Post-Discharge Follow-Up Workgroup

MVC hosted a post-discharge follow-up workgroup on Sept. 10 featuring a presentation by Brian Leideker, RRT, COPD Navigator for Trinity Health Oakland Hospital. Leideker’s presentation summarized Trinity Heath Oakland Hospital’s progress since initiating an A3 COPD readmission committee in June 2021, including the key interventions their team has implemented to date.

One initial intervention was the hiring of a COPD navigator. Leideker described how his unique role as a respiratory therapist involved in case management has allowed him to be “a middleman between respiratory physicians and other entities trying to deliver and support services” for COPD patients.

Following several root cause analyses, the COPD committee identified that nearly 90% of patients readmitted for COPD at Trinity Health Oakland Hospital had an interruption in intended continuation of pharmacotherapy and/or non-pharmacotherapy treatments. This finding encouraged Leideker’s team to work to improve the education of patients, providers, and the greater healthcare community on ambulatory treatment for COPD as well as reviewing the testing and documentation needed to ensure coverage of durable medical equipment (DME) post-discharge.

With the help of an MVC custom analytic report, Leideker was able to trend DME utilization rates for patients hospitalized with COPD since the initiation of these interventions, as seen in Figure 1.

Figure 1. Annual Select* DME Utilization Rates During the Index and 30-Day Post-Discharge Period Among Patients Hospitalized for COPD at Trinity Health Oakland (2020-2023)**

Generally, the utilization rate of post-discharge non-bi-level home ventilators (E0466) was found to increase over time, while bi-level home ventilator (E0470) utilization has decreased. Leideker noted that this was somewhat expected since patients routinely report difficulty with the utilization of bi-level home ventilators (BiPAP) and often move on to non-bi-level home ventilators (CPAP). Additionally, based on Trinity Health Oakland’s internal analyses as of May 2024, their COPD three-day readmission rates have been reduced to <18% for all payers.

Sept. 10 Post-Discharge Follow-Up Workgroup

September Rural Health Workgroup

MVC hosted a rural health workgroup on Sept. 26 featuring a presentation by Brent Mikkola, MBA, PMP, Manager of Community Health at MyMichigan Health. Mikkola’s presentation summarized MyMichigan Health’s approach to developing a strategic plan for health equity and an overview of some specific community programs currently in place. MyMichigan Health’s phased approach to integrating health equity is currently focused on evaluating social determinant of health (SDoH) opportunities in an “assess, analyze, and address” model.

Some unique community partnerships that resulted from this process include:

  • Gratiot County Public Transit voucher program
  • Rx 4 Health – partnership with Michigan State Extension and specific grocery suppliers including SpartanNash, SaveALot, and Meijer
  • Food Pharmacies & Weekend Kits - partnership with the Greater Lansing Food Bank and the Food Bank of Eastern Michigan
  • Bridge to Belonging - virtual series on loneliness and social connection
  • Continuing Care Clinic Pilot with Community Health Workers (CHWs)
  • Intervention for Nicotine Dependence: Education, Prevention, Tobacco and Health (INDEPTH) Suspension Diversion Program

In addition to developing a strategic framework for reporting and developing objectives around health equity, Mikkola described how MyMichigan Health delved into the data collection, analysis, and quality improvement work surrounding health equity. For example, after initially integrating CHWs into community practices and inpatient services, MyMichigan Health further integrated CHWs following the WHO’s CHW Lifecycle Approach, as seen in Figure 2.

Figure 2.

CHWs have become instrumental to MyMichigan’s assessment of SDoH as required by CMS and JCAHO mandates by filling gaps in system workflows and in the expansion of the Continuing Care Clinic Pilot. To date, nearly 500 well visit appointments have been completed by CHWs at MyMichigan. Of those patients, 34% were identified as having SDoH needs and 50% of those needs have now reportedly been met through connections to community support services.

To learn more about the efforts showcased by Trinity Health Oakland and MyMichigan Health, or to view past workgroup presentations, visit MVC’s YouTube channel here.

October’s workgroups will include a health in action presentation on Oct. 8 about the University of Michigan’s Hospital Care at Home program, as well as a sepsis presentation on Oct. 17 by Garden City Hospital. You can view the complete 2024 calendar of events and register for workgroups here. To learn more about MVC workgroups or other presentation opportunities, contact the MVC Coordinating Center by emailing us here.

0
View Post
Refreshed Hospital-Level, ED-Based Episode Push Reports Coming Soon to Members

Refreshed Hospital-Level, ED-Based Episode Push Reports Coming Soon to Members

The MVC Coordinating Center will soon distribute refreshed hospital-level versions of its push report utilizing emergency department-based episodes (“ED-based episodes”). MVC generated separate versions for acute care hospitals and Critical Access Hospitals (CAHs) with tailored comparison groups. In addition to reflecting more recent data across all included payers, these refreshed hospital-level reports differ from prior versions due to the addition of three high-volume ED conditions and the incorporation of Michigan Medicaid claims.

Each page of the report is dedicated to a specific condition with the same metrics throughout, such as risk-adjusted, price-standardized 30-day total episode spending, inpatient admission rates, and rates of post-ED utilization. Reports feature each hospital’s own attributed ED-based episode data for eight high-volume ED conditions: abdominal pain, cellulitis, chest pain (nonspecific), congestive heart failure (CHF), chronic obstructive pulmonary disease (COPD), diabetes with long-term complications (including renal, eye, neurological, or circulatory), diabetes with short-term complications (including ketoacidosis, hyperosmolarity, or coma), and urinary tract infection (UTI). The three new conditions included in this year’s refresh include diabetes with long-term complications, diabetes with short-term complications, and UTI.

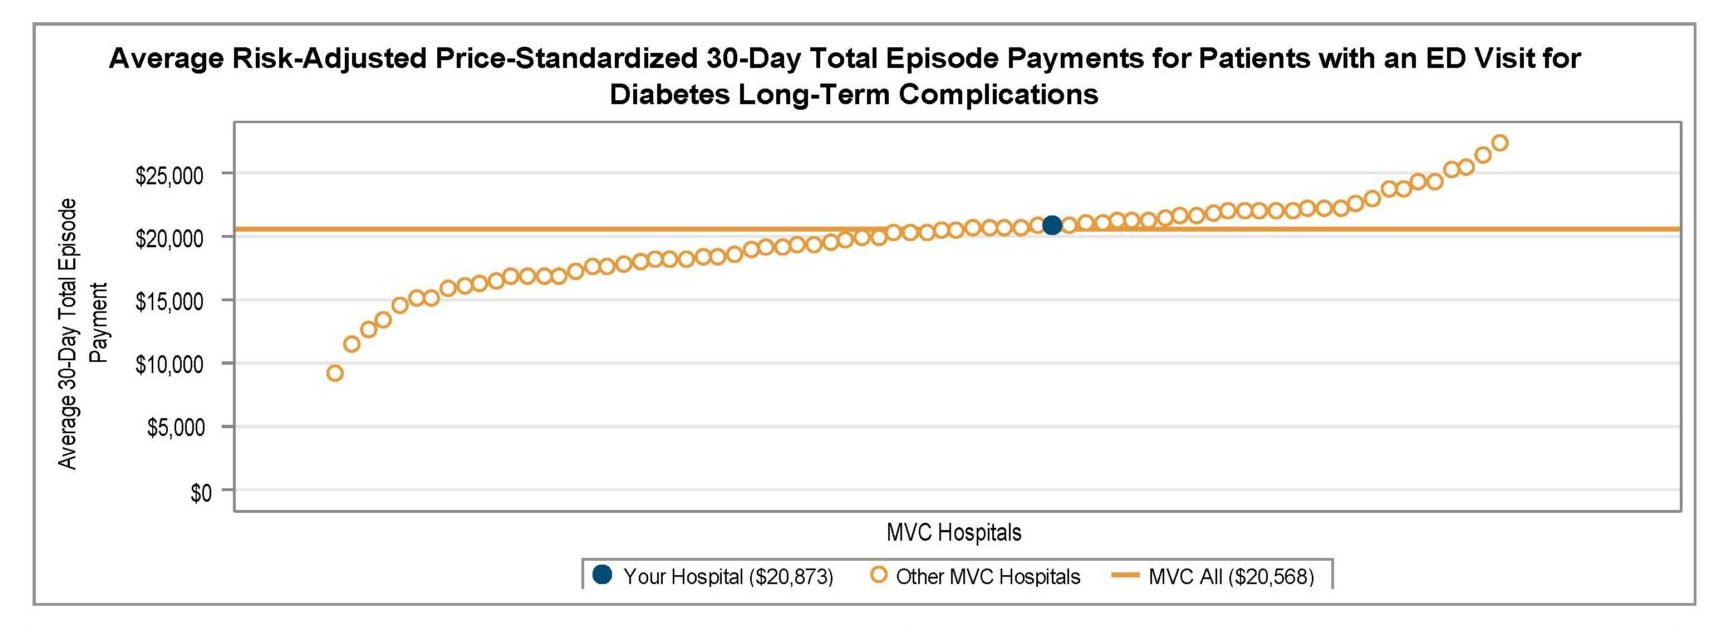
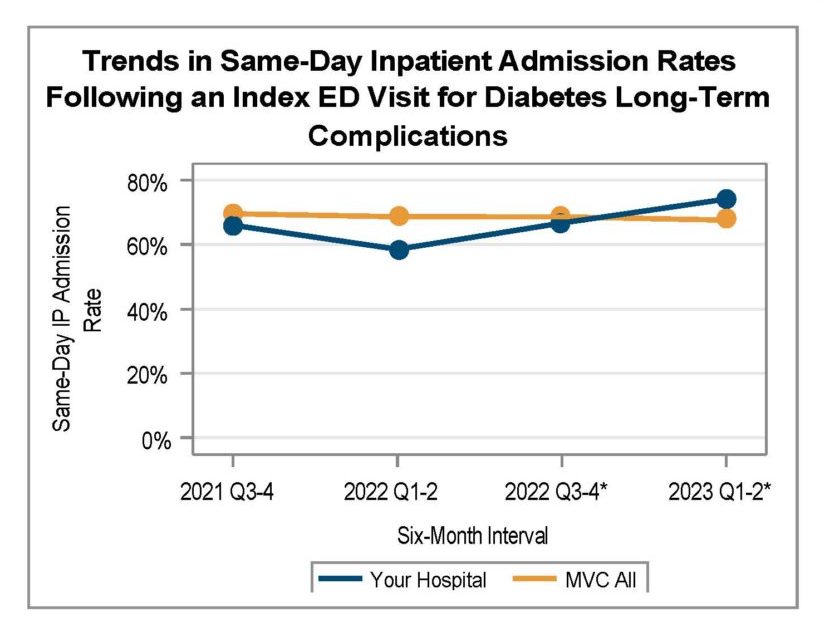
Among general acute care hospitals receiving a report, the average risk-adjusted, price-standardized 30-day total episode payment (Figure 1) for the reported conditions is highest for diabetes with long-term complications ($20,568), CHF ED-based episodes ($17,245), diabetes with short-term complications ($12,087), and COPD ED-based episodes ($10,289). The collaborative-wide average is lowest for chest pain ($3,111) and abdominal pain ($3,123) ED-based episodes. Within each condition, MVC 30-day total episode payments are consistently higher for episodes in which the patient had a same-day inpatient admission compared to episodes in which the patient did not have an inpatient stay beginning on the date of their ED visit. With that information in mind, hospital members can also use their individualized reports to track their same-day inpatient admission rate at six-month intervals using trend graphs for each included ED-based condition (Figure 2).

Figure 1.

Figure 2.

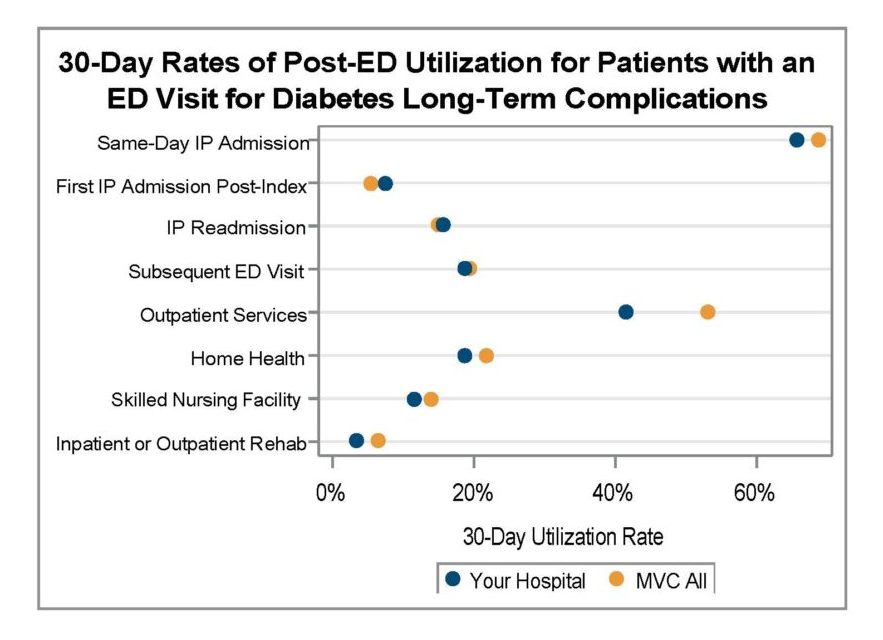
A key goal for these ED-based episode reports is to provide insight into healthcare utilization following index ED visits. Therefore, reports continue to include a dot plot (Figure 3) comparing patient post-ED utilization at a member hospital against their peer comparison group. Dot plots provide information on what percent of episodes had a same-day inpatient admission, what percent did not have a same-day inpatient admission but did see the patient admitted in the 1 to 30 days following the index ED visit, and the percent of patients who had two or more inpatient admissions (thus, at least one readmission) during the episode of care. Also provided are rates of subsequent ED visits, receipt of outpatient services, home health, skilled nursing facility care, and inpatient or outpatient rehab.

Figure 3.

These ED-based episodes are built using MVC’s most recent medical claims data from Medicare FFS, Blue Cross Blue Shield of Michigan PPO Commercial and Medicare Advantage plans, Blue Care Network HMO Commercial and Medicare Advantage plans, and Michigan Medicaid.

ED-based episodes utilize MVC’s newest episode of care data structure, which was developed last year in collaboration with the Michigan Emergency Department Improvement Collaborative (MEDIC), a BCBSM-funded Collaborative Quality Initiative with the goal of improving care and patient outcomes in Michigan emergency departments. MVC and MEDIC team members worked closely to develop 30-day episodes of care initialized by a patient’s visit to the ED and including all claims-documented care received in the 30 days following a patient’s index ED visit.

Please share your feedback with the MVC team if certain report measures are helpful or if you wish to see additional ED-based episode reporting for certain conditions and metrics. MVC is now also accepting custom report requests using its new ED-based data. Contact MVC to learn more.

0
View Post
MVC’s Refreshed Common Conditions Report Coming to Hospital Members Soon

MVC’s Refreshed Common Conditions Report Coming to Hospital Members Soon

MVC members will receive their next batch of updated push reports in the coming days with a refreshed version of MVC’s common conditions report. These reports provide insight into episodes of care for eight medical and surgical conditions that are commonly a focus for quality improvement efforts at MVC hospitals: acute myocardial infarction (AMI), chronic obstructive pulmonary disease (COPD), colectomy (non-cancer), congestive heart failure (CHF), coronary artery bypass graft (CABG), total knee and hip (joint) replacement, pneumonia, and spine surgery. MVC’s general acute care hospital and Critical Access Hospital (CAH) members will receive tailored versions of the report, with each group receiving benchmark data specific to their own category of hospitals.

Although the metrics provided vary by condition and case count, report pages generally focus on 30-day total episode payments, readmission rates, common reasons for readmissions, and post-acute care utilization. MVC price standardizes total episode payments to Medicare FFS amounts so that comparisons can be made across hospitals and over time. Payments are risk adjusted for patient age, gender, payer, comorbidities, and high or low prior healthcare utilization/payments.

Post-acute care utilization benchmarking for each of the eight medical and surgical conditions includes graphs displaying the percentage of each hospital’s patients who used home health care, inpatient/outpatient rehab, skilled nursing facility care, outpatient services, or emergency department care in the 30 days following their index hospitalization or surgery. Across the collaborative, reports show high use of 30-day home health care and outpatient services for these common conditions. For patients initiating their episode of care at a general acute care hospital within the collaborative, the home health care utilization rate was highest following CABG (69%) and joint replacement (50%).

Patients with a CABG episode were also high utilizers of outpatient services in the 30 days post-index (Figure 1), with a 73% average utilization rate. Patients with episodes for CHF (58%) and AMI (53%) were also high utilizers of outpatient services. Across conditions, use of outpatient services in the 30 days post-index was generally higher among episodes originating at CAHs than among episodes originating at general acute care hospitals.

Figure 1.

Reports also assess the setting of care for joint replacements and spine surgeries. For total knee and hip replacements, MVC data shows that the percent of joint replacements performed in an outpatient setting at general acute care hospitals across Michigan continued to rise from January 2021 through September 2022 (Figure 2).

Figure 2.

The patient population in these reports comprises adult patients who had surgery or an inpatient hospitalization at an MVC-participating hospital between January 2021 and September 2022. Measures are based on 30-day inpatient and surgical-based episodes of care data, incorporating paid claims from Blue Cross Blue Shield of Michigan and Blue Care Network Commercial and Medicare Advantage plans as well as paid claims from Medicare Fee-for-Service. Episodes meeting any of the following criteria were excluded from calculations: patients transferred to another acute care hospital or to hospice, patients who died during their index stay, and patients with a primary diagnosis of COVID-19 received in an inpatient setting at any point during their 30-day episode.

We hope our collaborative participants find these reports valuable, and as always, we welcome MVC members to contact MVC with any questions or analytic requests.

0
View Post
MVC’s 2023 Chronic Disease Management Follow-Up Reports Coming to Members Soon

MVC’s 2023 Chronic Disease Management Follow-Up Reports Coming to Members Soon

MVC will soon distribute the 2023 version of its chronic disease management follow-up reports to members. This refreshed version provides summary data on patients eligible for follow-up care after discharge from hospitalizations for congestive heart failure (CHF) or chronic obstructive pulmonary disease (COPD).

MVC defines timely follow-up care as receipt of an in-person or remote outpatient follow-up visit within 30 days of hospital discharge to home or home health care and before any readmission, emergency department (ED) visit, or procedure. Patients admitted to a skilled nursing facility, long-term acute care hospital, or inpatient rehab within the 30-day episode were excluded. MVC’s follow-up analyses was performed using claims-based episodes of care with index hospital admissions between 7/1/2019 and 06/30/2022 for Blue Cross Blue Shield of Michigan (BCBSM) PPO Commercial and Medicare Advantage (MA), Blue Care Network (BCN) HMO Commercial and MA, and Medicare Fee-for-Service insurance plans. For each of the two chronic conditions included in the report, hospitals with at least 11 episodes per year for a given condition received that condition-specific data.

The report offers a comparison of demographic characteristics for CHF and COPD patients who received a follow-up visit within 30 days versus those who did not receive follow-up. Demographic characteristics tabulated for each condition include the percent of patients living in “at-risk” or “distressed” Zip codes as defined by the Economic Innovation Group’s Distressed Community Index, patients’ average number of comorbidities, the mean age of patients, and the distribution of race and ethnicity. MVC recently refined and expanded its reporting of race and ethnicity identities, and these updates were reflected in the report. Patients are grouped as Hispanic if their insurance provider categorized their combined race/ethnicity as Hispanic or their ethnicity as Hispanic. Additionally, MVC no longer combines smaller groups and discontinued its use of the terms “other” and “unknown.”

On the first page provided for each condition, hospital follow-up rates are provided for three windows of time compared to those at other MVC hospitals (Figure 1), as well as trends over time for each follow-up window (Figure 2). For CHF, follow-up rates are provided in 3-day, 7-day, and 14-day time windows. For COPD, follow-up rates are provided in 7-, 14-, and 30-day time windows.

Figure 1.

Figure 2.

The second page of condition-specific feedback includes a summary of average 30-day risk-adjusted, price-standardized total episode payments by follow-up status compared to statewide and regional averages. Among general acute care hospitals included in the analysis, the statewide total average payment for CHF episodes was $17,235 for patients who received follow-up and $20,069 for those who did not; for COPD episodes, the statewide average payments were $13,815 among those with follow-up and $16,056 among those without. In reports generated for Critical Access Hospitals (CAHs), payments were compared to averages across all MVC CAH members. Rates of 30-day follow-up were also compared by payers across the same groups.

The final figure (Figure 3) in the report for each condition is a summary of follow-up method among those who received any follow-up care. Patients who received follow-up were categorized as having received only in-person follow-up visit(s), only remote follow-up, or both in-person and remote follow-up. MVC found that more than 80% of CHF and COPD patients statewide exclusively received in-person follow-up after a hospitalization.

Figure 3.

If you have any questions or feedback about this report, please contact the MVC Coordinating Center.

0
View Post
MVC Publishes its 2023 QECP Public Report as a Qualified Entity

MVC Publishes its 2023 QECP Public Report as a Qualified Entity

Today the MVC Coordinating Center published its annual Qualified Entity Certification Program (QECP) public report for 2023. One of the requirements of being a qualified entity (QE) with the Centers for Medicare & Medicaid Services (CMS) through the QECP is the annual dissemination of a public report created using claims data. MVC shared its first public report last year, making the 2023 report the second iteration.

As with last year, the 2023 MVC QECP Public Report provides unidentified aggregated data on Michigan hospitals for two measures: rates of 30-day rehospitalizations following start of home health care, and rates of outpatient follow-up received after hospitalization for congestive heart failure (CHF) or chronic obstructive pulmonary disease (COPD). Both measures were created using data from episodes of care initialized by inpatient hospitalizations or surgeries between 1/1/2018 and 12/31/2021.

For 2018-2021, the overall rate of 30-day unplanned rehospitalizations from home health among MVC member hospitals in Michigan was 11.3%. Risk-adjusted rates by index hospital ranged from 1.6% to 18.5% (Figure 1). By home health provider, risk-adjusted rates ranged from 2.0% to 23.6%. Patients whose episode of care began with an index event for endocarditis, COPD, CHF, or percutaneous coronary intervention (PCI) were more likely than patients with other index conditions to experience an unplanned rehospitalization in the 30 days after they started home health care.

Figure 1. Risk-Adjusted Rates of 30-Day Unplanned Rehospitalization from Home Health, by MVC Hospital

Across the 102 MVC hospitals with attributed episodes of care data underlying this report, the unadjusted rates of patients receiving outpatient follow-up were higher following index hospitalizations for CHF than for COPD (Figures 2 and 3). This was the case whether follow-up occurred three days (16% vs. 13%), seven days (45% vs. 37%), 14 days (63% vs. 54%), or 30 days (72% vs. 64%) after discharge.

Figure 2. 30-Day Follow-Up After CHF by MVC Hospital

Figure 3. 30-Day Follow-Up After COPD by MVC Hospital

For more information and the entire set of findings, we invite you to read the full report, which is available online to any member of the public on the MVC Resources page or directly here.

QE certification status allows MVC to provide hospital members with additional data from Medicare Fee-for-Service (FFS) claims at a level of granularity not otherwise available under standard CMS data use agreements. Reports located under the “QE Data” icon on the MVC registry allow hospital registry users to see unsuppressed data that include case counts <11 as well as utilization rates and average payments based on case counts <11. In addition, on any QE Data registry report, members can click on specific data points to load a list of all episodes underlying that data point. From that episode list, it is possible to view drill-down information on any individual listed episode to learn more about the claims and price-standardized payments comprising that episode.

MVC members representing one or more MVC-participating hospitals can send an email to Michigan-Value-Collaborative@med.umich.edu to learn more about data available through MVC’s QECP reports and to receive the forms necessary to gain access to those registry reports.

0
View Post
MVC Shares New COPD Report with Physician Organizations

MVC Shares New COPD Report with Physician Organizations

This week the Michigan Value Collaborative (MVC) introduced a new push report for its physician organization (PO) members focused on chronic obstructive pulmonary disease (COPD), providing a tailored version for each of MVC’s 40 PO members. This new push report was created in response to member interest in improving the quality of care for chronic diseases. It utilized 30-day claims-based COPD episodes from Medicare Fee-For-Service, Blue Cross Blue Shield of Michigan (BCBSM) PPO Commercial, and BCBSM Medicare Advantage with index admissions from 1/1/19 to 6/30/21.

One feature the MVC Coordinating Center is excited to highlight is the inclusion of 30-day readmission rates by major comorbidity categories for COPD. Rates were assessed for a PO’s attributed COPD patients overall as well as for attributed patients with congestive heart failure, diabetes, and vascular disease (see Figure 1). These comorbidities are assessed using diagnosis codes on claims in the six months prior to the patient’s index hospitalization.

Figure 1.

Also featured in this report were 90-day rates of pulmonary rehabilitation utilization following COPD index hospitalizations. This is the first time MVC has included a measure of pulmonary rehabilitation utilization in a collaborative-wide report, and the Coordinating Center hopes that this metric will encourage increased use of this important program across Michigan. Across all COPD episodes in the report, the collaborative-wide rate of pulmonary rehabilitation for PO-attributed patients was 2.7% (see Figure 2).

Figure 2.

Due to the low collaborative-wide rate, the Coordinating Center assessed 90-day utilization of pulmonary rehabilitation rather than 30-day utilization. However, the American Thoracic Society recommends the initialization of pulmonary rehabilitation within three weeks following hospitalization. Click here to learn more about American Thoracic Society recommendations for pulmonary rehabilitation and other care following COPD hospitalization.

Each PO’s complete report also includes figures illustrating average price-standardized risk-adjusted 30-day total episode payments, average index hospitalization length of stay, trends in readmission rates, rates and payments of post-acute care utilization, rates of outpatient follow-up, and patient population demographics. A patient population snapshot table details several demographic variables, including a variable based on data from the Economic Innovation Group’s Distressed Communities Index (DCI). It identifies the proportion of patients living in an “at-risk” or “distressed” zip code across all payers (see Figure 3). The DCI is derived from the U.S. Census Bureau’s Business Patterns and American Community Survey.

Figure 3.

A second table provides information on index hospital locations of care for the PO’s attributed patients, comparing the percent of patients treated at each site as well as each index hospital’s average 30-day total episode payment.

The COPD PO report is also being shared with members of the newly established lung care Collaborative Quality Initiative, commonly referred to as INHALE (Inspiring Health Advances in Lung Care). INHALE focuses on patients with asthma and COPD. They disseminate strategies to improve outcomes in these patient populations and reduce the costs associated with asthma/COPD care.

MVC also partnered with a fellow Collaborative Quality Initiative to provide POs with a provider resource that may be relevant to their work with COPD patients. The Healthy Behavior Optimization for Michigan (HBOM) team provided its Quit Smoking Resource Guide to send alongside MVC’s report. HBOM aims to ensure that all smokers who are interested in quitting receive the support and resources they need to be successful. Read more about HBOM’s materials and efforts on the HBOM website or in MVC’s May spotlight blog.

If you have any suggestions on how these reports can be improved or the data made more actionable, the Coordinating Center would love to hear from you. MVC is also seeking feedback on how collaborative members are using this information in their quality improvement projects. Please reach out at Michigan-Value-Collaborative@med.umich.edu.

0
View Post
MVC Distributes New Push Report Dedicated to P4P Conditions

MVC Distributes New Push Report Dedicated to P4P Conditions

MVC launched a new push report this week dedicated to the MVC P4P conditions. Its purpose is to support hospitals in identifying areas of opportunity within past and present conditions of the MVC Component of the Blue Cross Blue Shield of Michigan (BCBSM) Pay-for-Performance (P4P) Program. The conditions currently included in P4P and in this report are chronic obstructive pulmonary disease (COPD), congestive heart failure (CHF), colectomy (non-cancer), coronary artery bypass graft (CABG), joint replacement (hip and knee), pneumonia, and spine surgery. Acute myocardial infarction (AMI) is also included in this report as a historical P4P condition. Hospitals received a page for each condition if they met a case count threshold of 11 episodes in 2019 and 2020.

This report was limited to episodes included in the P4P program with index admissions in 2019 and 2020, and thus included the following payers: BCBSM Preferred Provider Organization (PPO), BCBSM Medicare Advantage, Blue Care Network (BCN) Health Maintenance Organization (HMO), BCN Medicare Advantage, and Medicare Fee-For-Service (FFS). To align with the P4P program, MVC excluded patients with a discharge disposition of inpatient death or transfer to hospice, episodes that started with an inpatient transfer, and episodes with a COVID-19 diagnosis on a facility claim in the inpatient setting. To fully exclude COVID-19 patients, pneumonia episodes in March 2020 were also excluded.

The reports provided data on hospital trends in episode payments, readmission rates, post-acute care utilization, and emergency department utilization for P4P patients. Data from the push report can be used in conjunction with the registry reports to inform areas of opportunity in the P4P conditions. The push reports also provided a snapshot of each hospital’s P4P patient population (see Figure 1), including race, mean age, and the average number of comorbidities.

Figure 1. Patient Population Snapshot for Blinded Hospital

For Critical Access Hospitals (CAHs), the report also included index length of stay. For acute care hospitals, the report included a “reasons for readmissions” table that identified the top five reasons a P4P patient was readmitted. However, this table was removed from the report’s joint replacement page due to low readmission rates among joint replacement surgeries. In its place, acute care hospitals received their ratio of outpatient to inpatient surgeries.

As with other push reports, hospitals were compared to other members in the collaborative for select measures. For acute care hospitals, each hospital’s report includes a comparison point for all MVC episodes (“MVC All”) as well as for episodes at hospitals in the same geographic region (“Your Region”). These reference points do not include episodes that occurred at hospitals with a CAH designation. Similarly, the reports distributed to CAHs included comparison points for MVC episodes at all CAHs in the collaborative (“CAH Average”).

This report takes the place of the cardiac service line reports, which included data on CHF, AMI, and CABG. The new P4P conditions push report uses many of the same measures and figures from the cardiac service line reports, but for the complete list of P4P conditions.

For more information on the MVC Component of the P4P Program, see the MVC P4P Technical Document. Please share your feedback on the newest P4P conditions push report with the MVC Coordinating Center at michiganvaluecollaborative@gmail.com.

0

MVC Shares National Action Plan with COPD Workgroup Attendees

The Michigan Value Collaborative (MVC) held a bi-monthly virtual workgroup recently on chronic obstructive pulmonary disease (COPD), a condition that accounts for the majority of deaths from chronic lower respiratory diseases and is continuously a leading cause of death in the United States. Notably, COPD is nearly two times as prevalent in rural areas as it is in urban areas; therefore, MVC members in rural areas may be dealing with significant inequities within their patient populations. The workgroup presentation and discussion focused on the COPD National Action Plan (CNAP). To the Coordinating Center’s surprise, many workgroup participants had not previously heard of the CNAP, making this event a great opportunity for practice sharing and discussion among members.

Overcoming barriers to prevention, early diagnosis, treatment, and management of COPD is necessary to improve quality of life and reduce mortality. To address these barriers, the U.S. Congress; National Heart, Lung, and Blood Institute; and Centers for Disease Control and Prevention convened a town hall where they asked federal and nonfederal partners to develop an action plan. These partners were tasked with identifying the efforts needed to change the course of COPD. The result was the development of the COPD National Action Plan (CNAP), which was released in 2017 and updated in 2019. It consists of five goals, which were outlined and discussed during the workgroup (see Figure 1).

Figure 1. Slide from COPD Workgroup Presentation

Goal 1 calls for promoting more public awareness and understanding of COPD, especially among patients and their caregivers. Key opportunities include patient and caregiver education that is sustainable and culturally appropriate, technological support mechanisms, and connecting patients and caregivers to local and state resources.

Goal 2 focuses on increasing the skills and education of healthcare providers so they are better equipped to provide comprehensive care. This goal is supported by the development and dissemination of patient-centric, clinical practice guidelines for care delivery, the use of technological support mechanisms, and consideration of home-based pulmonary rehabilitation programs. It’s important to note that studies have found no statistically or clinically significant differences for health-related quality of life and exercise capacity among patients who have completed home-based vs. outpatient-based pulmonary rehabilitation.

Goal 3 encourages increased data collection, analysis, and sharing to create a better understanding of disease patterns. Opportunities within this goal include supporting pharmaceutical and clinical COPD research; identifying and delivering comprehensive, evidence-based, culturally appropriate interventions; and disseminating findings to a variety of audiences (from patients to national policymakers).

Goal 4 aims to increase and sustain COPD research to improve understanding of the disease and its diagnosis and treatment. It’s vital that clinicians, researchers, and health policy experts foster research across the COPD continuum (prevention, diagnosis, treatment, management). Workgroup attendees agreed that there are opportunities to improve equity among COPD patients through more data on diagnosed and undiagnosed COPD in disadvantaged patients. Another vital component of this goal is supporting and sustaining pharmaceutical research for COPD medications since none of the existing medications for COPD have been shown to reduce the progressive decline in lung function.

Goal 5 calls for federal and nonfederal partners to collaborate to meet the objectives of the CNAP and translate its recommendations into research and action. Workgroup attendees highlighted the importance of implementing CNAP equitably among both urban and rural regions and implementing COPD strategies at all health policy levels (national, state, local). Such opportunities could improve access to cost-effective and affordable COPD support services and expand support for and access to pulmonary rehabilitation services (including home-based PR), thus reducing health inequities among COPD patients.

Each of the five CNAP goals is equally important and vital in reducing COPD health disparities. Although many of the MVC workgroup participants had not heard of the CNAP before, they were interested in sharing its goals and opportunities with others in their healthcare organization. If you would like to learn more about this patient-centered national action plan, you can read the full published report here. If your organization has addressed the CNAP goals or implemented any of the discussed opportunities, the MVC Coordinating Center would like to hear about the successes, challenges, and lessons learned. If you would like to share this information or present at an upcoming MVC workgroup, please email MVC at michiganvaluecollaborative@gmail.com.

0

Reducing Admissions and Readmissions in the COPD Patient Population

At a recent MVC chronic obstructive pulmonary disease (COPD) workgroup, representatives from McLaren Physician Partners presented on their recent quality improvement initiative involving their COPD patient population. McLaren Physician Partners worked to identify areas for improvement within this specific patient population and found some common patient struggles consisted of higher utilization of the emergency department and in-patient settings, as well as higher readmission rates, specifically among their Medicare patients (38%). Five nurse managers were tasked with doing case reviews in order to identify possible areas for improvement. Five to ten patients that had three or more encounters in the last six months were taken from each nurse managers case load. Around 83% of those patients had other significant comorbidities (e.g. Diabetes Mellitus, Congestive Heart Failure, Hypertension.) Additionally, the reason for readmission was most often related to either respiratory insufficiency or a cancer treatment side effect.

Care managers then engaged the patients and went over a questionnaire with them. Approximately 68% of these patients had a misunderstanding of their medication, 26% had environmental barriers, 14% were not compliant with medication, and less than 15% reported an inability to afford medication/devices. Readmissions related to disease progression and inappropriate medication use were the major contributing factor to higher utilization of the in-patient setting and emergency department. Additionally, all admissions and readmissions were related to some form of respiratory insufficiency or a cancer treatment side effect.

Due to the time of implementation, COVID-19 impacted the type of intervention that could be put into place. McLaren Physician Partners opted to adopt a telephonic intervention in order to address education needs and remove barriers. Specific needs related to managing medications and compliance, triggers that led to an exacerbation, and developing a plan of action at the onset of first symptom were addressed. Additionally, the intervention sought to minimize and remove barriers where possible (e.g. cost of medications, transportation issues for visits). Lastly, a consideration was made if a patient was a candidate for palliative care.

Nurse navigators looked into possible ways to engage patients differently in order to hopefully prevent an exacerbation that caused an admission or a readmission. They were aware that what they were doing wasn't working, and needed some sort of upgrade. A toolkit was developed that was sent to the patient prior to a one to two-hour phone call scheduled in order to  help the patient understand this toolkit. The kit requires active participation and helps the patient develop specific goals and actions to take when they see signs of a potential exacerbation.

After implementation of this pilot program, all navigators came together to discuss their findings. Many things were noted, including the fact that patients did not know the difference between their inhalers (long-acting vs. rescue). Additionally, patients often didn't know that by identifying certain triggers, some symptoms may have been preventable. Of the patients who received and engaged in this telephonic intervention, the readmission rate for those who had been recently discharged decreased by more than 20%. Overall, McLaren Physician Partners saw a decrease in their hospitalizations due to the implementation of this program.