0
View Post
MVC’s 2023 Chronic Disease Management Follow-Up Reports Coming to Members Soon

MVC’s 2023 Chronic Disease Management Follow-Up Reports Coming to Members Soon

MVC will soon distribute the 2023 version of its chronic disease management follow-up reports to members. This refreshed version provides summary data on patients eligible for follow-up care after discharge from hospitalizations for congestive heart failure (CHF) or chronic obstructive pulmonary disease (COPD).

MVC defines timely follow-up care as receipt of an in-person or remote outpatient follow-up visit within 30 days of hospital discharge to home or home health care and before any readmission, emergency department (ED) visit, or procedure. Patients admitted to a skilled nursing facility, long-term acute care hospital, or inpatient rehab within the 30-day episode were excluded. MVC’s follow-up analyses was performed using claims-based episodes of care with index hospital admissions between 7/1/2019 and 06/30/2022 for Blue Cross Blue Shield of Michigan (BCBSM) PPO Commercial and Medicare Advantage (MA), Blue Care Network (BCN) HMO Commercial and MA, and Medicare Fee-for-Service insurance plans. For each of the two chronic conditions included in the report, hospitals with at least 11 episodes per year for a given condition received that condition-specific data.

The report offers a comparison of demographic characteristics for CHF and COPD patients who received a follow-up visit within 30 days versus those who did not receive follow-up. Demographic characteristics tabulated for each condition include the percent of patients living in “at-risk” or “distressed” Zip codes as defined by the Economic Innovation Group’s Distressed Community Index, patients’ average number of comorbidities, the mean age of patients, and the distribution of race and ethnicity. MVC recently refined and expanded its reporting of race and ethnicity identities, and these updates were reflected in the report. Patients are grouped as Hispanic if their insurance provider categorized their combined race/ethnicity as Hispanic or their ethnicity as Hispanic. Additionally, MVC no longer combines smaller groups and discontinued its use of the terms “other” and “unknown.”

On the first page provided for each condition, hospital follow-up rates are provided for three windows of time compared to those at other MVC hospitals (Figure 1), as well as trends over time for each follow-up window (Figure 2). For CHF, follow-up rates are provided in 3-day, 7-day, and 14-day time windows. For COPD, follow-up rates are provided in 7-, 14-, and 30-day time windows.

Figure 1.

Figure 2.

The second page of condition-specific feedback includes a summary of average 30-day risk-adjusted, price-standardized total episode payments by follow-up status compared to statewide and regional averages. Among general acute care hospitals included in the analysis, the statewide total average payment for CHF episodes was $17,235 for patients who received follow-up and $20,069 for those who did not; for COPD episodes, the statewide average payments were $13,815 among those with follow-up and $16,056 among those without. In reports generated for Critical Access Hospitals (CAHs), payments were compared to averages across all MVC CAH members. Rates of 30-day follow-up were also compared by payers across the same groups.

The final figure (Figure 3) in the report for each condition is a summary of follow-up method among those who received any follow-up care. Patients who received follow-up were categorized as having received only in-person follow-up visit(s), only remote follow-up, or both in-person and remote follow-up. MVC found that more than 80% of CHF and COPD patients statewide exclusively received in-person follow-up after a hospitalization.

Figure 3.

If you have any questions or feedback about this report, please contact the MVC Coordinating Center.

0
View Post
MVC’s Latest CDM Push Report Reframes Focus to Follow-Up Care

MVC’s Latest CDM Push Report Reframes Focus to Follow-Up Care

The Michigan Value Collaborative (MVC) distributed its chronic disease management (CDM) push report recently, which has been refreshed and reframed from its previous iterations. Originally termed the CDM congestive heart failure (CHF) report and the CDM chronic obstructive pulmonary disease (COPD) report, the new “CDM follow-up report” focuses more specifically on follow-up care after hospitalization for the two conditions.

The newest version aims to provide additional granularity into follow-up care at member hospitals by showcasing variability across different windows of time, across payers, and by type. MVC defines follow-up as episodes where a patient had an outpatient follow-up visit (in person or by telehealth) within 30 days or before a readmission, inpatient procedure, emergency department visit, skilled nursing facility admission, or visit for inpatient rehabilitation.

The report features a new patient population snapshot table that highlights demographic data. These tables (see Figure 1) provide each hospital with demographics for their CHF/COPD patient populations, including race, mean age, the average number of comorbidities, and the proportion of patients who are dual-eligible.

Figure 1.

MVC hospitals will see comparisons to their peers on 7-day, 14-day, and 30-day outpatient follow-up rates, as well as 30-day risk-adjusted total episode payments and 30-day outpatient follow-up rates stratified by payer. Members will also see their individual hospital’s breakdown of follow-up types at 30 days, and trends over six months for 3-, 7- and 14-day rates.

Each figure presented reflects index admissions from 1/1/18 – 12/31/20 for Blue Cross Blue Shield of Michigan (BCBSM) PPO Commercial, Blue Care Network (BCN) Commercial, BCBSM PPO Medicare Advantage, BCN Medicare Advantage, Medicare Fee-For-Service, and Medicaid. Hospitals received report pages for each condition if they met the threshold of at least 11 episodes in each year of data for that condition.

There was wide variation in follow-up rates across the collaborative, with member follow-up rates ranging from less than 40% after 30 days to approximately 80% (see Figure 2). In addition, 30-day follow-up rates were lowest within the Medicaid patient population with an MVC average of 58% (see Figure 3); the collaborative-wide averages for 30-day follow-up among BCBSM/BCN and Medicare patients were 76% and 73%, respectively. It was also the case that most patients (92% on average) received follow-up care in person as opposed to a remote or hybrid option (see Figure 4).

Figure 2.

Figure 3.

Figure 4.

The CDM follow-up report was distributed in partnership with the Integrated Michigan Patient-Centered Alliance in Care Transitions (I-MPACT) Collaborative Quality Initiative (CQI). I-MPACT is a unique patient-centered, data-driven collaborative that engages hospitals and provider organizations throughout Michigan in developing and implementing innovative approaches for improving care transitions. They work to improve the transition of patients between care settings with the goal of bettering outcomes and reducing readmissions.

In addition to partnering with I-MPACT to expand the report’s reach, MVC also partnered with a CQI to provide members with supplemental materials that may be relevant to their work with CHF/COPD patients. The Healthy Behavior Optimization for Michigan (HBOM) CQI provided tobacco cessation materials that were shared alongside the MVC report, including a Quit Smoking Resource Guide and Quit Smoking Medication Guide. HBOM aims to ensure that all smokers who are interested in quitting receive the support and resources they need to be successful. Read more about HBOM’s materials and efforts in MVC’s May CQI spotlight blog.

In addition to continuing to offer its CDM push report, the MVC Coordinating Center offers a bimonthly CDM workgroup. The next workgroup will take place on Tuesday, July 12 from 1-2 p.m., and will feature a presentation about the Sparrow Pain Management Center’s Care Management Program. Please register today to join the MVC Coordinating Center for this presentation and discussion.

If you have any suggestions on how these reports can be improved or the data made more actionable, the Coordinating Center would love to hear from you. MVC is also seeking feedback on how collaborative members are using this information in their quality improvement projects. Please reach out at michiganvaluecollaborative@gmail.com.

0
View Post
Unique Food Assistance Program Bridges Medical and Food Sectors

Unique Food Assistance Program Bridges Medical and Food Sectors

MVC hosted another successful session of its new health equity workgroup last week with a guest presentation by Ariane Donnelly, MPH, RD, Health Promotion Coordinator at the Washtenaw County Health Department. The new health equity workgroup was established in response to a greater strategic focus on health equity within the MVC Coordinating Center as well as widespread interest in this topic within the healthcare field.

The March 16 workgroup focused on the Prescription for Health program, which takes a unique approach to chronic disease management by connecting the medical system with the food sector. It operates by having participating healthcare providers assign “prescriptions” to their patients to eat more fruits and vegetables. These prescriptions can then be “filled” at local participating farmers markets, where patients receive $100 in tokens to spend on fresh fruits and vegetables as well as nutrition education and support. Participants also work with Community Health Workers to set health goals. The program leverages the fact that Michigan is the second most agriculturally diverse state in the country, and its abundant farmers markets can be an asset in supporting healthy lifestyles for patients.

Evaluation of the program’s effectiveness has been fruitful. For every year of the program, the health department found a statistically significant increase in self-reported fruit and vegetable intake, often by one cup or serving per day (see Figure 1).

Figure 1.

The program was first created in 2008 in response to high levels of food insecurity within communities in Washtenaw County combined with generally low consumption of fruits and vegetables, both of which are associated with an increased risk of chronic disease. Ms. Donnelly pointed out that while many clinics provide nutrition advice, patients face multiple barriers to equitably accessing healthy foods and need additional support. Since its first pilot, the program has continued to grow in total enrollees and economic impact, and it maintained its participation levels throughout the pandemic with a modified version of the program.

Similar programs are in operation in other parts of the state and country as well, such as Food Rx in Chicago and Fresh Prescription in Detroit. Washtenaw County’s Prescription for Health program launched an implementation toolkit in 2016 to help others with starting a similar program in their area.

To learn more about the Prescription for Health program’s operations, impact, and lessons learned, watch the full recording of the workgroup here: https://bit.ly/3IyIsnS. You can also visit the program website for more information: www.washtenaw.org/prescriptionforhealth.

MVC will continue to invite guest speakers with valuable insights on a more equitable health system. The next MVC health equity workgroup will take place on Tuesday, May 10, from 1-2 p.m. If you would like to suggest a topic or speaker for a future workgroup, please contact the MVC Coordinating Center at michiganvaluecollaborative@gmail.com.

Prescription for Health is funded by Saint Joseph Mercy Health System with additional financial support from multiple partners.

0

The Behavior Change Puzzle of Medication Non-Adherence

Non-adherence to a prescribed medication regime for chronic disease management is known to lead to poor health outcomes and higher healthcare costs. A number of studies have shown that adherence is usually around 50% or less, even when medications are provided free of charge. What seems to be less clear is how best to address poor adherence; one study points out that most of the current interventions meant to improve adherence rates are too complex or ineffective, and that the research in this field is rife with weaknesses and bias.

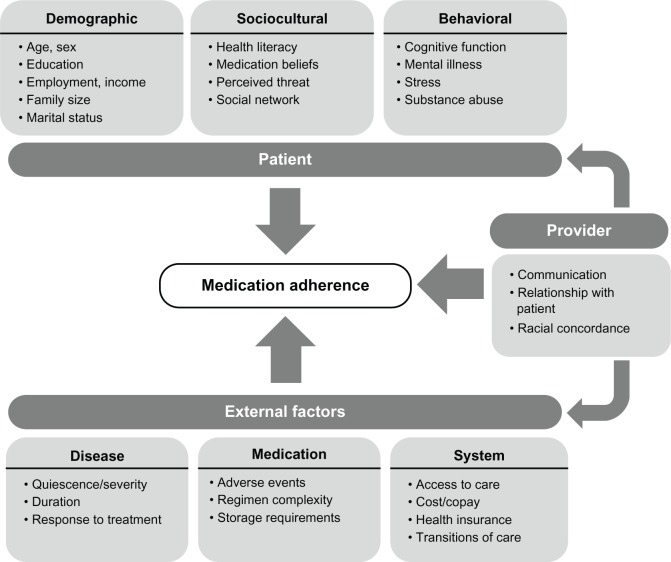
But as with most quality improvement initiatives, understanding the source of the problem is an important first step. In this case, identifying the reasons for non-adherence is an important starting point for reducing barriers and improving patient outcomes. Many factors may affect whether a person takes their medications, including the patient themselves, the disease being treated, the health system and team, and the type of therapy involved. One study’s survey of 10,000 patients found that the most cited barrier to taking one’s medications was simply forgetfulness (24%). This was followed by perceived side effects (20%), high drug costs (17%), and a perception that their prescribed medication will have very little effect on their disease (14%).

The same study illustrated the various patient, provider, and external factors that can play a role in medication adherence using the figure below (Figure 1). If any one of these factors were to present a challenge for the patient, then they are at risk of not taking their prescribed medications on time and any related medical issues.

Figure 1.

While some interventions such as pill box aids and electronic reminders have helped patients when forgetfulness is the issue, these do not address factors such as concerns about side effects and medication-related harm, or uncertainty about the importance of taking long-term prescribed medications. These issues have the potential to be addressed through shared decision-making and education from clinical experts such as pharmacists and nurses.

One review analyzed the impact that social determinants of health has on medication adherence. Disadvantageous circumstances in social and living conditions are associated with an increase in chronic disease, and it is believed that these same challenges impact a person’s ability to manage their health. When an individual is facing food insecurity, unemployment, and unstable living conditions, they are sometimes unable to address their health concerns emotionally or financially. The review found that medication adherence was negatively impacted by food insecurity and housing instability, although few studies identified other specific social determinants that influence non-adherence to medications beyond these two. In fact, education, income, and employment status did not significantly correlate with adherence to a medication regime.

The Michigan Value Collaborative (MVC) would like to hear how your institution is addressing medication non-adherence, especially in the chronic disease patient population. This will be an upcoming topic at a chronic disease management workgroup. Please contact MVC at michiganvaluecollaborative@gmail.com for information about attending.

0

Monitoring Chronic Disease Utilizing Social Media and Sensors

According to the Centers for Disease Control and Prevention, “treating individuals with chronic diseases accounts for 86% of health care costs.” While the number of those living with chronic conditions and the associated costs may be increasing, the Michigan Value Collaborative (MVC) is committed to providing you with current data around providing the right care, at the right time, at the right cost. Technological advances in healthcare are changing how and where chronic disease care is being delivered, how these patients interact with providers, and how organizations exchange information.

Both diabetes and abnormal blood pressure (BP) are extremely common in chronic disease patients and cause various complications, including an increased risk of cardiovascular events. When thinking about the way in which these chronic diseases should be managed moving forward after the COVID-19 pandemic, technological advances offer promising solutions.  Most devices in the healthcare industry have been digitalized. This advancement allows for routine monitoring using various devices that some patients may already own, such as a smart phone or a smart watch. These devices contain sensors that can be used to obtain information that can then be transmitted straight into the electronic health record (EHR). Other devices that can be used to collect patient information include a glucometer sensor, pulse oximeters, temperature sensors, scales, and many more. However, this method is not without its limitations.

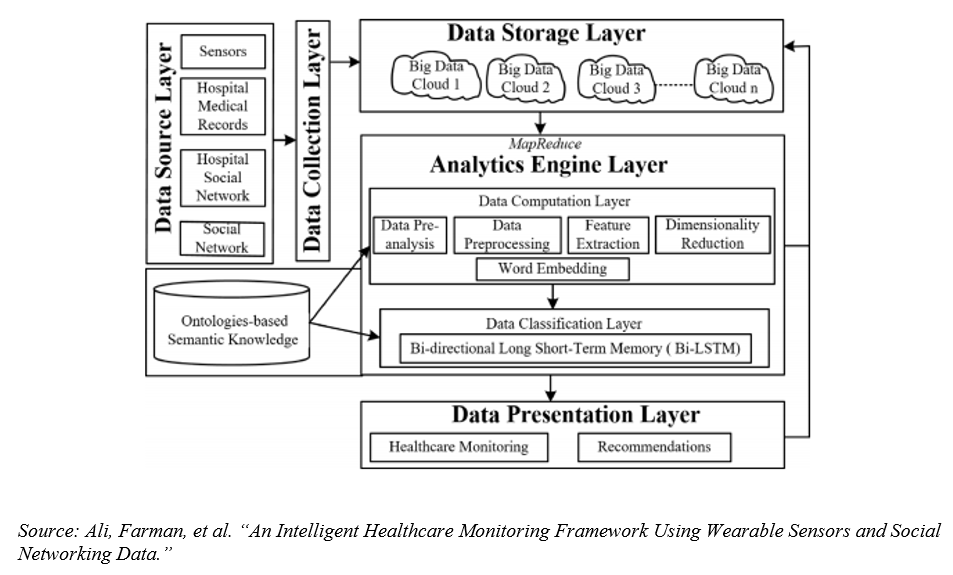
The amount of data that is generated from these devices is vast and not all systems are capable of storing and processing it efficiently for precise and real time monitoring. In order to negate this issue, a framework was recently published that can be seen in Figure 1 below. This framework utilizes the cloud environment along with a large analytics engine layer to help store and process the data. The recently published study identifies the importance of utilizing wearable sensors and social networking platforms in collecting patient data, but identifies the challenges that come with this such as issues with data storage and running correct analyses.

Figure 1. Layers in the proposed healthcare monitoring framework

Chronic disease management patients may use social media platforms in order to seek support or learn new ways in which they may be able to reverse certain symptoms. Other ways in which monitoring is done through social networks include patient and provider conversations through application programming interfaces (APIs). Through these APIs, providers can pick up on tone or social connection status. Through this proposed framework of social media and sensor monitoring, providers can closely monitor chronic disease management patients.

MVC hosts chronic disease management workgroups where collaborative members discuss their current initiatives and connect on ways in which they can work together to better the health of Michigan. If you have any questions about upcoming chronic disease management workgroups, please feel free to contact the coordinating center at michiganvaluecollaborative@gmail.com