0
View Post
BCBSM Initiative Incentivizes Data Collection on Social Factors

BCBSM Initiative Incentivizes Data Collection on Social Factors

Health equity is a top priority for providers across the country, who are keenly aware of the prevalence and exacerbation of existing health inequities. The state of Michigan in particular ranks poorly in measures of population health and social determinants of health (SDOH), which represent a huge opportunity to improve equity and health outcomes for patients. Health equity is currently a key strategic focus of the Michigan Value Collaborative (MVC) Coordinating Center in the years ahead, as well as for Blue Cross Blue Shield of Michigan (BCBSM). As work in this area grows, some suggest that better data collection is the next critical step to improving health equity.

Data collection is the focus of BCBSM’s latest initiative - the SDOH Standardized Data Collection and Aggregation Initiative - which offers incentives to physician organizations (POs) for collecting and submitting SDOH screening data. Its goal is to increase SDOH screening by primary care physicians during annual wellness visits as well as enhance SDOH data submitted to the Michigan Health Information Network (MiHIN), Michigan's nonprofit statewide health information network.

This data will be used in the short term to improve data conformance and SDOH definitions within the Michigan provider community. Ideally, this initiative will help BCBSM to improve care coordination between providers, identify gaps in resources and community-level social need trends, and provide analytics and reporting to the provider community. The long-term goal is to reduce disparities and improve health outcomes.

There are multiple pathways for POs to participate, primarily by either submitting screening data through MiHIN’s SDOH use case, or by developing infrastructure to enable participation in MiHIN’s SDOH use case. BCBSM sees this incentive program as an important step toward ensuring all patients receive the care they need.

“The SDOH initiative is valuable for both patients and providers because it encourages providers to screen for SDOH needs in patients and also encourages that the data from these screenings is exchanged in an interoperable way,” said Karolina Skrzypek, MD, Medical Director of Clinical Partnerships at BCBSM. “It is very important that providers across the state of Michigan have the ability to access SDOH screening data regardless of where the screening took place. Screening for SDOH needs by providers is the first step in helping to address these needs in our patients.”

These points were echoed by Martha M. Walsh, MD, MHSA, FACOG, Medical Director of Clinical Partnerships and Engagement at BCBSM, who said, “We know that when patients have SDOH needs, that it is more difficult for them to have their healthcare needs met and for patients to care for their chronic conditions. Our initial goal in having providers screen for SDOH needs is for patients to have their needs addressed at the point of care.”

Some POs are already actively submitting this data to MiHIN and can receive incentive payments for continuing to do so. The other pathways are focused on those who have capacity to store and extract SDOH data but are not submitting it to MiHIN, or those POs who don’t yet have the digital infrastructure in place. Helping all POs to achieve a similar capacity and submit their data to the same vendor will allow for a broader understanding of the gaps and communities in need of further funding.

“By aggregating this data, we hope to learn more about specific domains of need and geographic areas with the most needs so that we can start to address these more broadly,” said Dr. Walsh. “We hope that by screening for and addressing SDOH needs, we will start to be able to decrease disparities in care for our most vulnerable patients.”

Incentives for the MiHIN SDOH use case pathways are paid out of the BCBSM Physician Group Incentive Program (PGIP) reward pool. Therefore, any deadlines related to participation are based on PGIP payment cycles. Those POs wishing to participate in the October 2022 cycle should submit their opt-in form and any other required materials by the end of August.

A separate value-based reimbursement (VBR) reward was created specifically for patient-centered medical home (PCMH) designated primary care physicians for completing SDOH screenings using Z codes. This VBR payment was available when the SDOH initiative launched in January. Provider offices had six months to work towards meeting the criteria to receive VBR effective 9/1/2022. Criteria for the 2023 cycle was previously announced and updates to the criteria will be provided during the upcoming BCBSM September PGIP quarterly meeting.

Any POs or providers interested in learning more about this initiative and the pathways for participating can read the full brochure here and submit questions directly to BCBSM at POPrograms@bcbsm.com. In addition, if your PO or hospital has success stories or insights that have resulted from collecting SDOH screening data, please consider sharing your story and insights with the MVC Coordinating Center at michiganvaluecollaborative@gmail.com.

Support for MVC is provided by Blue Cross Blue Shield of Michigan as part of the BCBSM Value Partnerships program. Although BCBSM and MVC work collaboratively, the opinions, beliefs, and viewpoints expressed by the author do not necessarily reflect the opinions, beliefs, and viewpoints of BCBSM or any of its employees. To learn more about the Value Partnerships program, visit www.valuepartnerships.com.

0

Roll Up Your Sleeve to Save a Life

After declaring the nation’s first-ever blood crisis in early 2022 and the worst shortage in over a decade, the American Red Cross and other blood donation organizations continue to plea for blood donors. In Michigan, blood donations fell with the start of COVID-19 and continue to lag pre-pandemic levels.

Based on data from the Red Cross, someone in the United States needs blood or platelets every two seconds, resulting in approximately 29,000 units of red blood cells, 5,000 units of platelets, and 6,500 units of plasma required daily. And, while an estimated 6.8 million people in the U.S., or 3% of eligible individuals, donate blood each year, more donors are always needed!

Figure 1.

According to the Association for the Advancement of Blood and Biotherapies, donating blood is a safe, simple, and rewarding experience that usually only takes 45-60 minutes. During a typical whole blood donation, approximately 0.5 liters of blood is collected. For donations of other blood products, such as platelet or plasma, the amount collected is based on the donor’s height, weight, and platelet count.

Along with helping others in need, blood donation also has some surprising health benefits, including:

  • A free mini health screening: before donating, potential blood donors receive a brief physical exam that includes taking blood pressure, body temperature, and pulse to ensure they are fit for donation.
  • A healthier heart and vascular system: in hypertensive individuals, regular blood donation has been linked to lower blood pressure and may lower the risk for heart attacks.
  • A happier, longer life: people usually donate because it feels good to help others and altruism has been linked to positive health outcomes, including a lower risk for depression and greater longevity.

Figure 2.

Alternatively, to help protect the limited supply of blood, reduce costs associated with the collection and administration of blood products, and reduce patient complications of allergic, febrile, and hemolytic reactions, restrictive transfusion practice or conservative blood use can be considered. This practice, recommended by the National Institute for Health and Care Excellence and the Choosing Wisely campaigns, uses the two major clinical decision points of hemoglobin concentration when transfusion should be considered and the number of units being transfused.

Whilst evidence suggests there is no increase in morbidity or mortality by following restrictive transfusion practices, outcomes related to the quality of life, symptoms of anemia, and length of hospital stay are not as well studied.

Some examples of multimodal interventions to reduce unnecessary blood transfusions include the START (Screening by Technologists and Auditing to Reduce Transfusions) study which produced guideline development, education for clinicians, prospective order screening, and immediate feedback to physicians for potentially inappropriate orders, and monthly feedback to the clinical teams on appropriateness. Secondly, an Australian system-wide initiative focusing on education, practice audits, and feedback for individuals and a policy promoting single-unit red blood cell transfusions showed success. Other blood management approaches including anemia prevention, iron supplementation for iron deficiency, and a reduction in blood loss during procedures are other methods that can be used.

To implement strategies for reducing the unnecessary use of transfusions, individuals should assess their own practice against evidence-based standards. Additionally creating a multidisciplinary team to discuss and set guidelines and protocols based on evidence, auditing practices against identified evidence-based standards and tailoring interventions to the institutional setting and context can help with the implementation of restrictive transfusion practices.

Until we can find an alternative source or increase supply, we will continue to need people to step up and donate.

If you plan to donate blood, a few helpful tips can make for a better experience:

  • Drink plenty of water. Staying hydrated makes it easier to find your veins and prevents you from becoming light-headed after donating
  • Eat well beforehand and be sure to eat snacks offered to you.
  • Get a good night’s sleep and, if you are planning to exercise, do so before donating, not after.
  • Take iron tablets. The American Red Cross recommends individuals who donate blood frequently take an iron supplement or a multivitamin with iron.

Typically, donors are eligible to donate blood every 56 days or up to six times per year. To find a blood donation site near you, visit the American Red Cross or your local donation center. Every drop helps!

0
View Post
Breastfeeding Awareness Month: The Value of Hospital Initiatives

Breastfeeding Awareness Month: The Value of Hospital Initiatives

As August is National Breastfeeding Month, many healthcare professionals and hospitals across the country are joining in to promote its benefits. Currently, the American Academy of Pediatrics (AAP) recommends exclusive breastfeeding of infants for the first six months of life and then alongside solids as long as mutually desired by mother and child for two years and beyond. This updated recommendation – the AAP previously recommended breastfeeding through age one and beyond – acknowledges its continued benefits for mother and child.

Many experts suggest that it is an investment in the health of current and future patients, not just a lifestyle choice. In updating its guidance, the AAP clarifies that breastfeeding beyond one year and up to two years has significant benefits to the mother in particular; lower rates of diabetes, high blood pressure, and breast and ovarian cancers are associated with long-term breastfeeding. In breastfeeding infants, some studies indicate there are fewer respiratory and gastrointestinal infections, incidents of severe respiratory disease or sudden infant death syndrome (SIDS), development of chronic illnesses, doctor visits, hospitalizations, and prescriptions. The Centers for Disease Control and Prevention (CDC) estimates that an additional $3+ billion in medical costs per year can be attributed to low breastfeeding rates.

Breastfeeding is a personal choice – not everyone wants to or even can breastfeed their baby. For those who choose to, however, being successful is linked to the presence of interventions and support along the way. Evidence-based practices at the hospital level are a critical component for establishing breastfeeding.

The Agency for Healthcare Research and Quality (AHRQ) cited a systematic review of 38 randomized controlled trials that found short- and long-term increases in breastfeeding as a result of direct assistance and education across a variety of providers and settings in conjunction with structured training for health professionals. The AHRQ and the AAP also both cite increases in breastfeeding initiation and duration as a result of the Baby-Friendly Hospital Initiative, which gives a special designation to facilities that successfully complete an assessment and implement the World Health Organization’s 10 Steps to Successful Breastfeeding.

Some of the evidence-based practices linked to higher breastfeeding rates include individualized support in the first few hours and days following birth, rooming-in, and education and support. Additionally, the CDC’s 2018 national survey of Maternity Practices in Infant Nutrition and Care (mPINC) identified institutional management as an area with the widest range of scores across all states, with 45 being the lowest state score and 95 the highest state score (see Figure 1). As this category is defined by activities such as nurse training and clinical competency, record keeping, and policy setting, it is clear that some important breastfeeding initiatives extend beyond the maternity ward.

Figure 1. National score and state score ranges for mPINC subdomains in 2018

According to the AAP, there are also significant opportunities for more equitable gains in breastfeeding outcomes. The United States continues to see evidence of disparities in success rates – none of the Healthy People 2020 objectives for breastfeeding were met for non-Hispanic black mothers and infants. The rates for any breastfeeding are approximately 10% lower in non-Hispanic black mothers compared to the average for all races/ethnicities (see Figure 2). Similarly, there are disparities in mothers who are younger than 20, low income, or less educated. Hospitals interested in health equity initiatives likely have an opportunity in the realm of breastfeeding support that accounts for socioeconomic and cultural differences.

Figure 2. Rates of any breastfeeding in U.S. by race/ethnicity

A summary of recommendations, provider implementation tools, and other resources are summarized for healthcare providers in the AHRQ breastfeeding provider fact sheet. In addition, MVC would like to spotlight those members with ongoing or completed improvement efforts around breastfeeding. If your site has achieved the Baby-Friendly Hospital designation or has tools for addressing patient disparities in breastfeeding, please consider sharing your story with the Coordinating Center for the benefit of the larger collaborative.

0

MVC Launches New Push Report on ED and Post-Acute Care Use

The emergency department (ED) is a unique and critical component of the healthcare system in the U.S., treating acute injuries or illnesses and acting as a safety net for patients who are uninsured or low income. ED visits are also very expensive, and that spending is growing according to a recent retrospective study of ED trends. This week the Michigan Value Collaborative (MVC) is distributing its newest push report on ED and post-acute care (PAC) utilization to support members' efforts in this space.

Since the ED serves as a safety net for patients experiencing barriers to healthcare access, the Coordinating Center report purposefully integrates measures tied to social determinants of health and health equity. Reports contain a patient population snapshot table showcasing several patient characteristics by payer (see Figure 1), including age, race, comorbidities, zip code, dual-eligibility status, and economic distress scores. Dual-eligible patients are those who qualify for both Medicaid and Medicare; these patients tend to have a higher prevalence rate for chronic conditions, disabilities, and other care needs that substantially increase healthcare utilization.

Figure 1.

Economic distress scores range from 0-100 with a higher score indicating greater economic distress. These scores come from the Economic Innovation Group’s Distressed Communities Index (DCI), which is derived from the U.S. Census Bureau’s Business Patterns and American Community Survey. The DCI combines seven complementary economic indicators (see Figure 2) to provide a single, holistic, and comparative measure of economic well-being across communities in the U.S. In MVC’s report, there is a proportion of patients living in an “at-risk” or “distressed” zip code across all payers, as classified by the DCI. However, as the literature often indicates, the Medicaid population has the highest average distress score and a larger proportion of patients living in an “at-risk” or “distressed” zip code.

Figure 2.

The bulk of MVC’s latest report aims to provide its members with more granular insights into PAC utilization in the 30-day post-discharge period than is available on the MVC registry. Using index admissions for medical conditions from 1/1/18 through 12/31/20, the report focuses predominantly on ED utilization, which is categorized as either “ED to Home” or “ED to Readmission.” ED to Home represents ED visits that do not occur on the same day as readmission, and ED to Readmission refers to those visits occurring on the same day as readmission.

The report includes figures illustrating trends in 30-day ED to Home rates between 2018 and 2020, top reasons for ED visits at a given hospital, the number of ED to Home visits within 30 days post-discharge, the number of days until the first ED visit post-discharge, the ED to Home rate and the breakdown of total PAC spending for a hospital’s three highest-volume conditions, and the average ED facility payment. MVC included the following payers in this report: Blue Cross Blue Shield of Michigan (BCBSM) PPO Commercial, BCBSM Medicare Advantage (MA), Blue Care Network (BCN) HMO Commercial, BCN MA, Medicare Fee-for-Service, and Medicaid.

Overall, the MVC report confirms published findings that Medicaid patients utilize the ED at a higher rate than patients insured by other payers. The Coordinating Center also finds that ED use differs between types of providers. For acute care hospitals, for example, over half of ED visits occur on the same day as readmission, whereas these visits account for 40% at Critical Access Hospitals (CAHs).

MVC also finds that ED to Home visits most often occur once in the 30 days following discharge for most of the collaborative (see Figure 3). There are some members, however, with three or more ED to Home visits within the 30-day post-discharge period.

Figure 3.

The Coordinating Center envisions this report being of particular importance to its CAH members, whose structures, services, and patient populations make the ED and PAC a top priority. As such, MVC prepared versions of this report for both CAHs and acute care hospitals using their respective comparison groups throughout. In other words, the CAH version of the report includes comparison points for all other CAHs in the collaborative. Acute care hospitals can see their traditional collaborative-wide and regional comparison data, not including hospitals with a CAH designation.

As members review and discuss the findings in their report(s), MVC encourages providers to utilize the Michigan Emergency Department Improvement Collaborative (MEDIC), which is dedicated to improving the quality of ED care across the state of Michigan. In addition, if members wish to discuss additional custom analyses on ED and PAC utilization, please contact the MVC Coordinating Center at michiganvaluecollaborative@gmail.com.

0
View Post
Latest MVC Preop Testing Report Features New Figures and Data

Latest MVC Preop Testing Report Features New Figures and Data

This week MVC distributed its second preoperative testing push report of 2022, providing members with another opportunity to benchmark their testing practices. MVC first introduced its preoperative testing push reports in 2021 to help members reduce the use of unnecessary testing for surgical procedures. Preoperative testing, especially for low-risk surgeries, often provides no clinical benefits to patients but is ordered regularly at hospitals across Michigan.

The report distributed this week had many similarities to the version distributed earlier this year in April, namely that members continued to see their rates across a variety of tests for three elective, low-risk procedures performed in outpatient settings: laparoscopic cholecystectomy, laparoscopic inguinal hernia repair, and lumpectomy. Claims were evaluated for the index event as well as 30 days prior to the procedures for the following common tests: electrocardiogram (ECGs), echocardiogram, cardiac stress test, complete blood count, basic metabolic panel, coagulation studies, urinalysis, chest x-ray, and pulmonary function.

The latest report has a few key differences from the spring version, the most significant of which is that it utilizes claims from Blue Cross Blue Shield of Michigan (BCBSM) and Blue Care Network (BCN) plans exclusively. This allows members to see MVC’s most up-to-date data; the report includes index admissions from 1/1/2019 through 12/31/2021. In addition, since the report contains BCBSM/BCN data only, there is no case count suppression, whereas members would only see their data in the spring version if they had at least 11 cases in each year of data for the three combined conditions.

The reports received by members this week included several new figures. Similar to other MVC push reports, members will now see a patient snapshot table that provides additional information about the report’s patient population. For this, MVC chose to include patient characteristics such as age, zip code, and comorbidities. Generally speaking, there were more comorbidities among patients who underwent preoperative testing compared to patients with one or no comorbidities (see Figure 1). However, the majority of patients who complete a preoperative test do not have multiple comorbidities. There were also observed differences in testing rates by age. In general, patients who had preoperative testing were older on average than patients who had no preoperative testing.

Figure 1.

Another new figure showcased the overall preoperative testing rates by year. This trend graph showed members how their overall rate for any preoperative testing compared in 2019, 2020, and 2021, and it included data points for the MVC average and regional comparison groups (see Figure 2). The key finding for this figure was that there has been very little change in testing rates over time when looking at overall preoperative testing practices. This means that, in general, the prevalence of low-value preoperative testing has remained consistently high overall across the collaborative for three years and likely longer.

Figure 2.

The latest report also included a new figure for absolute change in any preoperative testing from 2019 to 2021. For each hospital, this appears as a caterpillar plot of absolute change percentages for their highest-volume procedure among the three low-risk surgeries in the report. Members can see the percentage change—positive or negative—in their testing rate for that surgical condition, as well as how their absolute change compares to the rest of the collaborative. For example, hospitals that perform more cholecystectomies than hernia repairs or lumpectomies saw a wide range of both increases and decreases in preoperative testing rates from 2019 to 2021 (see Figure 3).

Figure 3.

The blinded hospital in this example observed very little change in its testing rate for cholecystectomy (-1.6%), and the MVC average was similar (-2.2%). This showcases that although the collaborative is not seeing much change to overall rates for any testing over time, individual members might see greater variability over time for specific tests or procedures, especially in instances of low case counts.

Members will be able to take those deeper dives into their rates for specific tests in the figures that make up the remaining pages of the report. Viewing one’s preoperative testing rates for each specific test can help members understand if any specific tests are driving their overall testing rate. One area of opportunity, for example, could be to reduce one's rate of cardiac testing, specifically ECGs; the rate of ECGs is very variable across the collaborative (see Figure 4) and could lead to a cascade of care.

Figure 4.

MVC is eager to drive improvement in this area. For more information on how MVC is working to reduce unnecessary preoperative testing, visit its Value Coalition Campaign webpage here. If you are interested in a more customized report or would like information about MVC’s preop testing stakeholder working group, please contact the MVC Coordinating Center at michiganvaluecollaborative@gmail.com.

0

Ambulatory Surgical Centers Transforming Surgery Market

Surgery in the United States is transforming, with as many as 70% of surgeries currently performed in an outpatient setting. Ambulatory Surgical Centers (ASCs) have grown significantly over the past decade and are now a critical part of the healthcare system. The Ambulatory Surgery Center Association now represents more than 6,000 centers across the United States. ASCs account for more than half of the outpatient surgery market with roughly 23 million procedures per year. The growth of these centers has had a significant impact on hospitals. As the number of ASCs has grown and hospital outpatient departments (HOPDs) have taken on fewer cases, many hospitals have elected to set up ASCs as part of their business.

This growth has been driven in part by greater scheduling flexibility and lower costs. Since most surgeries performed in outpatient settings are elective, patients are enabled to “shop” for their facility of choice prior to treatment. ASCs exclusively provide same-day surgical services that do not exceed 24 hours or require hospitalization. They are often – but not always – specialty-specific. Some of the most common specialties serviced by ASCs are orthopedics, pain, and ophthalmology (see Figure 1).

Figure 1.

A recent study of Medicare patients evaluated the scope of practice, number of patients treated, number of procedures, and revenue for ASCs. The study found that across the United States there was a 7% increase in the number of ASCs certified to service Medicare patients. In 2018 there was an 11% increase in the number of services performed and a 6.5% increase in patients. The median number of surgeries performed at each ASC was 1,050 per year. Payments collected rose from $3.6 billion in 2012 to $5.1 billion in 2018, with cataract surgery accounting for 24% of all payments. The study concluded that the increased revenue was most likely due to the increasing complexity of procedures being performed and, thus, higher reimbursement.

The increase in more complex surgeries at ASCs can most likely be attributed to better anesthesiology methods that allow for improved pain control and reduced post-operative recovery time, as well as new technologies and techniques that make surgeries safer and more comfortable. The Leapfrog Group identified over 50 different procedures performed across 10 disciplines in their 2022 ASC outpatient surgery fact sheet (see Figure 2).

Figure 2.

Associated with this rise in complexity is the need for ASC staff to accurately identify high-risk patients who are not appropriate candidates for ASCs. Many ASCs have created their own methods for identifying these high-risk candidates since there are no universal or ready-to-use published criteria. Although no preoperative screening system is perfect, the average national ASC transfer rate to an inpatient facility is just 0.42%, and in one study the use of a criteria checklist (see Figure 3) helped the facility achieve a 0.17% transfer rate.

Figure 3.

To assist the growing number of patients in their selection of a surgical provider, several organizations now publish evaluations about the quality and safety of various ASC facilities. For example, Newsweek published their rankings of "America's Best Ambulatory Surgical Centers" earlier this year in partnership with the global research firm Statista. The list spotlights 470 facilities in the 25 states with the most ASCs, with up to 10 ranked centers by state. Michigan's highlighted ASCs (see Figure 4) received scores of 74% - 83%, which was based on a "reputation score" and KPI data score.

Figure 4.

As ASCs continue to have a transformative impact on the surgery market, the Michigan Value Collaborative is interested in learning more about the metrics and data being utilized by these stand-alone or hospital-affiliated centers. If you have any information to share, please reach out to the MVC Coordinating Center at michiganvaluecollaborative@gmail.com.

0

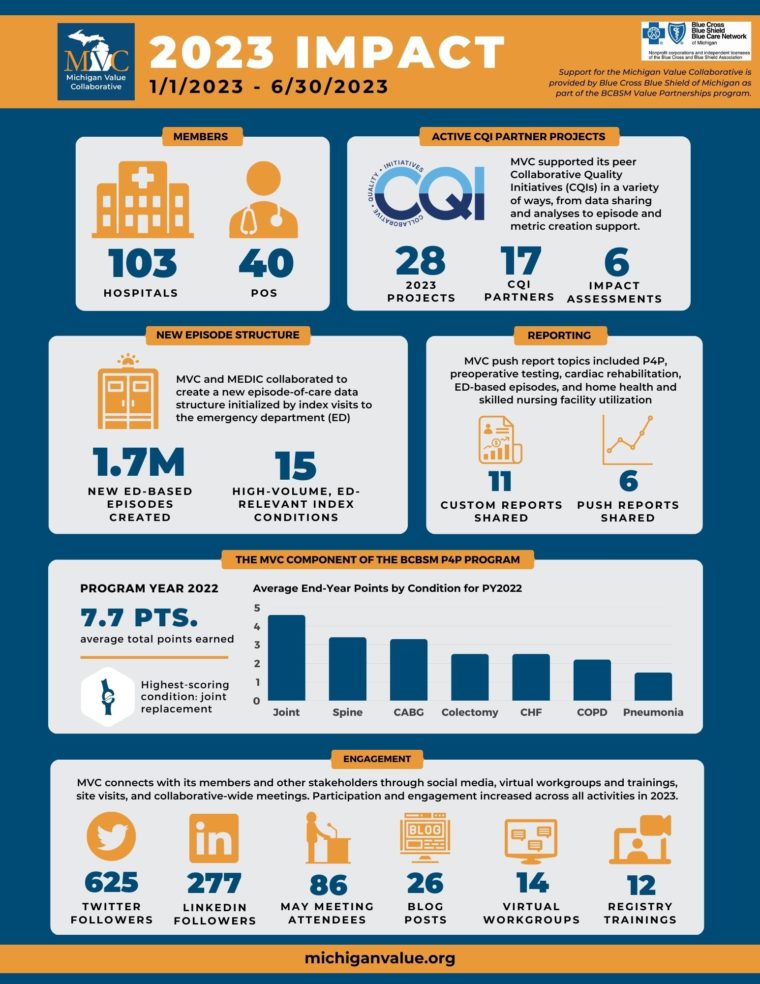
Reflecting on MVC’s Accomplishments: January-June 2022

As we start the second half of 2022, the MVC Coordinating Center is taking a moment to pause and reflect on the tremendous work that has been accomplished over the past six months. Here is a look back at some of the highlights.

JANUARY

MVC Workgroups consist of a diverse group of representatives from Michigan hospitals and POs that meet virtually to collaborate and share ideas related to various topics. January kicked off with the launch of MVC’s new Health Equity Workgroup! The inaugural meeting featured speakers from the Michigan Social Health Interventions to Eliminate Disparities (MSHIELD) Collaborative. The Health Equity Workgroup has two more meetings in 2022 and we’d love to see you there! Visit the MVC 2022 Events Calendar to register and check the calendar for additional Workgroup offerings focused on Chronic Disease Management, Diabetes, Health in Action, Joint Replacement, and Sepsis.

FEBRUARY

MVC launched two new push reports in February, with the release of the new Physician Organization (PO) Colectomy Report, shared with 35 of MVC’s PO members, and the first-ever Pneumonia Push Report, distributed to 89 MVC hospital members[1]. To meet the needs of MVC’s growing hospital members, a subset of the Pneumonia Push Reports was tailored to meet the specific data needs of our Critical Access Hospital members.

MARCH

After completing 58 hospital site visits in 2021, MVC announced the creation of a robust quality improvement (QI) initiatives database, developed to track QI initiatives across the collaborative. The database, searchable by QI focus area and project status, allows MVC to understand common themes and challenges among all its members as well as within subgroups such as hospital size or region. In 2022, the MVC team is hosting site visits with our PO members and will be gathering QI initiatives to add to the QI initiatives database. The database is being used as a resource for custom analytic requests and a library of practice standards for members. If you are an MVC PO interested in participating in a virtual site visit, please contact the MVC Coordinating Center to schedule.

APRIL

In April, MVC distributed a refreshed Sepsis Push Report, developed in collaboration with the Michigan Hospital Medicine Safety Consortium. These customized reports provide hospitals with new insight on demographics for their sepsis patients, including the percentage of COVID-positive patients to illustrate how COVID has impacted their sepsis data, along with race, top comorbidities, and most common zip codes, stratified by payer.

MAY

MVC held its first collaborative-wide meeting of 2022 in May, with a focus on “Turning Data into Action.” Held virtually, a total of 158 leaders representing 68 different hospitals and 15 physician organizations (POs) from across the state of Michigan participated in the event. Save the Date for our next in-person collaborative-wide meeting, scheduled for Friday, October 28th at the Radisson Hotel Lansing!

JUNE

In June, the MVC Coordinating Center hosted its first in-person event since 2019, with a Regional Networking Dinner for our Eastern Michigan sites (Region 3). The dinner provided an opportunity for MVC hospital and PO members to come together to network, share ideas and discuss key priorities, including health equity initiatives. MVC’s next Regional Networking Event for Southeast Michigan (Region 4) is scheduled for Tuesday, September 27th. For identification of your MVC designated region, please see the MVC Regions Map here.

AND COMING SOON…

Along the way, the MVC team has been hard at work preparing for two new exciting developments:

  • MVC’s first Northern Summer Meeting (RSVP here) is scheduled for Thursday, August 18th at Traverse City’s Great Wolf Lodge. The agenda is tailored to highlight unique opportunities and challenges facing the Northern Michigan healthcare community. Interested MVC members serving Northern Michigan, the Upper Peninsula, and small/rural communities are encouraged to The University of Michigan Medical School designates this live activity for a maximum of 3.75 AMA PRA Category 1 Credit(s)™.  This meeting will feature presentations from:
    • Michigan Center for Rural Health
    • MyMichigan Medical Center – Sault
    • Munson Healthcare Grayling Hospital
    • Region 9 Area Agency on Aging

To learn more about these initiatives and other MVC happenings, visit the MVC blog!

Footnote

[1] Hospitals and POs not meeting case count thresholds did not receive a report.

0
View Post
MVC Coordinating Center Team Volunteers at Member Hospital

MVC Coordinating Center Team Volunteers at Member Hospital

As employers and managers endeavor to invest in their company’s culture, there is one often overlooked activity that can positively impact job satisfaction: volunteering. According to a study from Deloitte, cultivating a culture that encourages volunteerism can boost employee morale, workplace atmosphere, and brand perception. It found that 89% of employees believe companies with sponsored volunteer activities offer a better overall work environment and that 70% felt volunteering was a stronger boost to morale than company-sponsored happy hours. Since team culture and the retention of skilled employees have become increasingly important in the current job market, there has never been a better time to help staff feel connected to their community and teammates.

The Michigan Value Collaborative (MVC) experienced some of these benefits recently when the Coordinating Center team spent several hours volunteering together at a local MVC member hospital. This was the first time MVC had organized an official service day for its team. It took place at the Farm at Trinity Health, located at the Trinity Health St. Joseph Mercy Ann Arbor Hospital in Ypsilanti, MI. The MVC team spent several hours weeding, planting, and harvesting vegetables. After harvesting, the MVC team helped wash and pack fresh greens, salad mix, kale, and radishes for the Farm’s community-supported agriculture (CSA) program and patient produce boxes.

Selecting the Farm at Trinity Health as MVC’s service day location was an exciting opportunity due to its many connections to MVC’s priorities. The produce boxes distributed by the Farm help feed members of the community who experience food insecurity or hunger, as well as hospital patients who participate in programs like cardiac rehabilitation (CR). MVC has identified health equity as a strategic priority for 2022 and beyond, and also currently has a Value Coalition Campaign that encourages members to increase patient utilization of CR programs. The MVC team was excited to learn about this direct connection to CR patients and the program’s overall impact on community health. In addition, the Farm at Trinity Health is a participating site in the Washtenaw County Health Department’s Prescription for Health Program, which was a featured topic at MVC’s health equity workgroup earlier this year.

This service day also coincided with an overall shift in how MVC staff members interact. As MVC grew over the past two years, multiple new employees had only ever interacted with coworkers virtually because of the pandemic’s impact on in-person activities. That changed this past spring with MVC’s part-time return to in-person work and some in-person team-building events. The service day was intended to bring teammates together after many months apart to get to know one another, connect, and give back to the wider community.

If you have a story about an impactful program that could be shared with the Collaborative or wish to connect your team with local community volunteering, contact the MVC Coordinating Center for assistance at michiganvaluecollaborative@gmail.com. Learn more about the Farm at Trinity Health (formerly the Farm at St. Joe’s) here.

0

MVC Launches First Preoperative Testing Awareness Week

Prior to surgery, most Michigan patients will undergo a series of tests, such as blood draws, urinalysis, chest x-rays, or electrocardiograms (ECGs/EKGs). Many of these tests are unnecessary for healthy patients undergoing low-risk procedures, such as groin hernia repair or cholecystectomy. Routine preoperative testing is widely considered a low-value service, and yet a majority of hospitals continue to order these tests.

Last week the Michigan Value Collaborative (MVC) helped to increase awareness about low-value preoperative testing during its first-ever Preoperative Testing Awareness Week. MVC distributed press releases, published a daily cadence of social media content on Twitter and LinkedIn, and launched a new video (shown above) about preoperative testing – all in service of inspiring collaboration in this area.

MVC first focused on preoperative testing in 2020, when the Coordinating Center selected it as a priority area for its Value Coalition Campaigns. Since then, MVC has taken steps to reduce the use of unnecessary preoperative testing for surgical procedures to improve quality, reduce cost, and improve the equity of care delivery in Michigan. Throughout Preoperative Testing Week, the Coordinating Center’s goals were to describe the potential harm of unnecessary testing, showcase the variability in testing practices across the collaborative, and connect members with MVC resources that could help.

MVC primarily supports members via two key strategies. One is data analysis and reporting. MVC analysts utilize administrative claims data to calculate testing rates in the preoperative period, and then share these results with members as reports or as unblinded data at collaborative-wide meetings. More recently, MVC partnered with the Michigan Surgical Quality Collaborative (MSQC) to distribute these reports more widely, which enables both clinical and quality personnel to identify patterns, explore new strategies, and work together to reduce preoperative testing at each hospital.

These reports are an invaluable resource in benchmarking the extent of the issue statewide since MVC data can show members how their rates compare to other Michigan hospitals. By focusing on a homogeneous cohort of healthy patients undergoing common, low-risk surgical procedures, MVC benchmarks can help all hospitals understand where they have an opportunity to improve, regardless of facility size, resources, or patient population.

MVC data reveals large variability between hospitals—so much so that even high-performing hospitals have room to safely reduce testing rates. Across the collaborative, preoperative testing rates among young, healthy patients range from 10% to 97% in MVC hospitals. Even within hospitals, there is usually variation, with certain surgeries driving the overall rate.

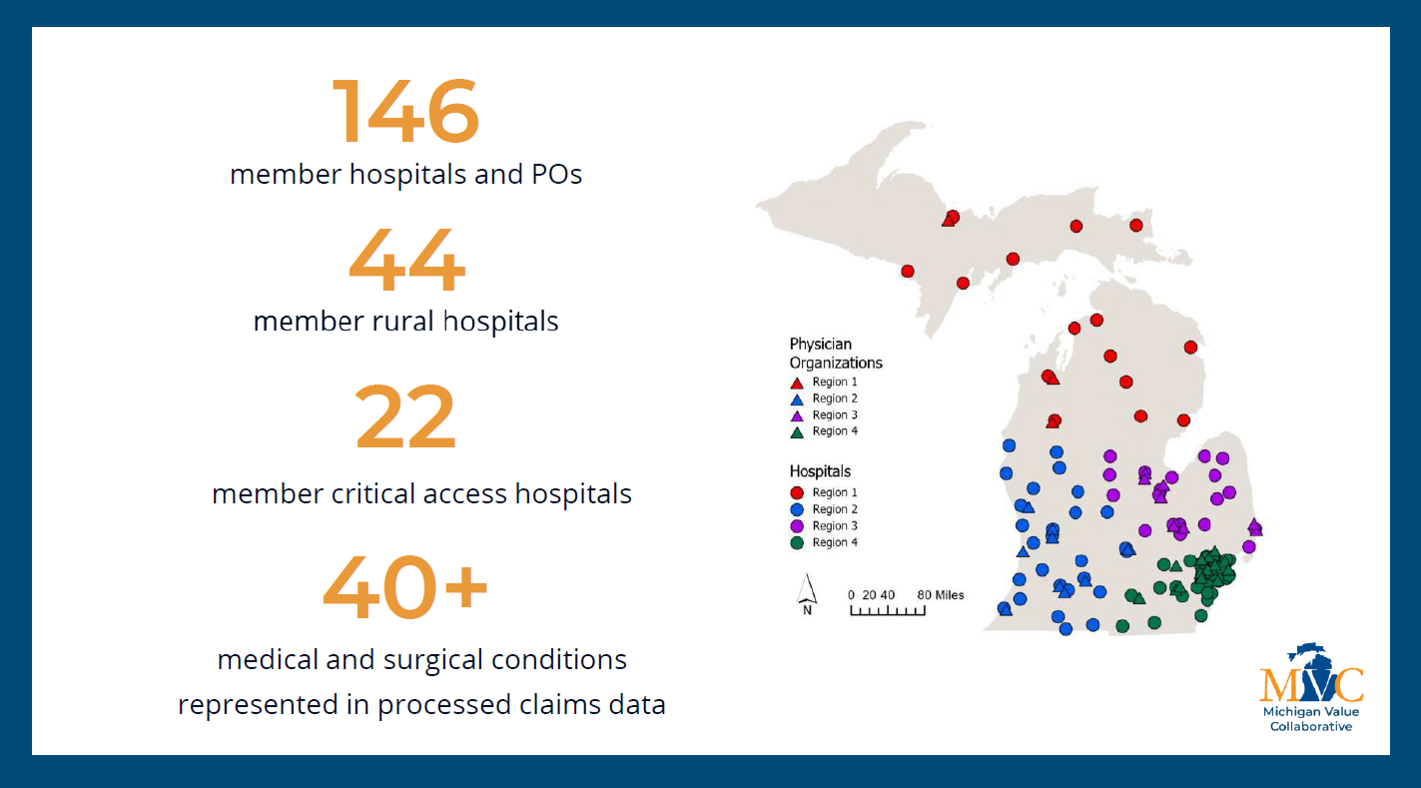
The other key strategy MVC uses to support members is engagement events, which help facilitate collaboration and resource sharing among peer hospitals and physician organizations. The MVC team supports its member base of more than 100 hospitals and 40 physician organizations through events like stakeholder meetings and workgroups, where clinicians and quality improvement staff can discuss solutions to common challenges. Last week, MVC hosted a special, one-time workgroup on preoperative testing as part of its “Health in Action” workgroup series. The session featured guest presenter Dr. Michael Danic, DO, for a presentation titled, “Safe, Evidence-Based Reductions in Preoperative Testing: Why is it so hard to change?” Dr. Danic is a board-certified anesthesiologist at Ascension Genesys who has served in several leadership positions for quality and safety initiatives. A recording of the full workgroup is available here.

At the conclusion of the week, the MVC team helped its stakeholders connect to educational materials, data, specialists, and successful peers in this space. The Coordinating Center urges its members to take steps to understand their role in unnecessary preoperative testing and improve the patient experience.

The Coordinating Center is eager to continue this momentum in pursuit of a variety of goals for 2022 and beyond. If your hospital or physician organization would like support with reducing preoperative testing rates or has a success story that could help others, please reach out directly to MVC at michiganvaluecollaborative@gmail.com.

0
View Post
MVC Registry to Soon Include Patient-Level Medicare Data

MVC Registry to Soon Include Patient-Level Medicare Data

In the coming weeks, MVC registry users will receive communications outlining several required steps related to implementing the Coordinating Center’s new data use agreement (DUA) as a qualified entity (QE) with the Centers for Medicare and Medicaid Services (CMS). The QE DUA permits MVC to display Medicare Fee-For-Service (FFS) claims data with fewer data suppression limitations than its research DUA within its online registry. As a result, authorized users of the MVC registry may gain access to identifiable Medicare beneficiary data.

These changes are the result of years of work by the MVC team to earn its QE status through the Qualified Entity Certification Program (QECP), which is also known as the Medicare Data Sharing for Performance Measurement Program. The QE application includes multiple phases before an entity is permitted to show patient-level data. The MVC Coordinating Center has been working through the final phase (see Figure 1) of the application, which involves developing and documenting measures for public reporting.

Figure 1.

The QE Medicare data will be contained in a separate tab on the MVC registry. Authorized users will have access to both the existing Medicare FFS reports as well as the QE reports. The QE data will be available for the most recent 18 months of index admissions only and will not have any case count suppression, allowing users to see the more granular data that is censored in the Medicare FFS reports.

The QE reports also have additional patient population filters to view the data by patient comorbidities, patient age, and more granular date options. These reports also feature trend graphs that can be viewed monthly, quarterly, or annually. In addition to uncensored data, the QE data will allow for patient-level drill-down as is currently available in the Blue Cross Blue Shield of Michigan data. The drill-down includes detailed information on the patient’s comorbidities, price standardized episode payments, and claim level walk-through. Although patient drill-down is available, the provider identifiers have been removed in conjunction with the QECP regulations. Additionally, the skilled nursing facility report is not available in the QE reports to avoid identifying providers.

For those with access, the QE reports should be used when evaluating the most recent years of data. The Medicare FFS reports can still be useful for historical trends and the Coordinating Center may be able to provide custom reports to fill in information that isn’t available through the registry. The patient-level drill-down can be used in conjunction with a hospital’s clinical information to understand what led to high-cost patients. The QE data should make Medicare data more useful to hospital members. However, QE data is only to be used for quality improvement rather than for marketing purposes. Additionally, authorized users are prohibited from disclosing or redistributing data provided in these reports outside of their institution.

Next week MVC member hospitals will receive a new QE DUA to be reviewed and signed by an authorized representative from their institution. This signed DUA is a prerequisite for receiving access to the new QE pages once they are available. MVC’s current CMS research DUA will remain in effect on non-QE registry pages and will continue to utilize data suppression for fewer than 11 episodes to protect patient identities. The MVC registry will also implement multifactor authentication (MFA) upon login for all registry users regardless of QE access in order to comply with the new DUA's security and data privacy requirements.

In the coming weeks, MVC members and registry users are encouraged to be attentive to any communications containing additional details or requests. In the meantime, please contact the MVC Coordinating Center with any immediate questions at michiganvaluecollaborative@gmail.com.