0
View Post
MVC Shares New COPD Report with Physician Organizations

MVC Shares New COPD Report with Physician Organizations

This week the Michigan Value Collaborative (MVC) introduced a new push report for its physician organization (PO) members focused on chronic obstructive pulmonary disease (COPD), providing a tailored version for each of MVC’s 40 PO members. This new push report was created in response to member interest in improving the quality of care for chronic diseases. It utilized 30-day claims-based COPD episodes from Medicare Fee-For-Service, Blue Cross Blue Shield of Michigan (BCBSM) PPO Commercial, and BCBSM Medicare Advantage with index admissions from 1/1/19 to 6/30/21.

One feature the MVC Coordinating Center is excited to highlight is the inclusion of 30-day readmission rates by major comorbidity categories for COPD. Rates were assessed for a PO’s attributed COPD patients overall as well as for attributed patients with congestive heart failure, diabetes, and vascular disease (see Figure 1). These comorbidities are assessed using diagnosis codes on claims in the six months prior to the patient’s index hospitalization.

Figure 1.

Also featured in this report were 90-day rates of pulmonary rehabilitation utilization following COPD index hospitalizations. This is the first time MVC has included a measure of pulmonary rehabilitation utilization in a collaborative-wide report, and the Coordinating Center hopes that this metric will encourage increased use of this important program across Michigan. Across all COPD episodes in the report, the collaborative-wide rate of pulmonary rehabilitation for PO-attributed patients was 2.7% (see Figure 2).

Figure 2.

Due to the low collaborative-wide rate, the Coordinating Center assessed 90-day utilization of pulmonary rehabilitation rather than 30-day utilization. However, the American Thoracic Society recommends the initialization of pulmonary rehabilitation within three weeks following hospitalization. Click here to learn more about American Thoracic Society recommendations for pulmonary rehabilitation and other care following COPD hospitalization.

Each PO’s complete report also includes figures illustrating average price-standardized risk-adjusted 30-day total episode payments, average index hospitalization length of stay, trends in readmission rates, rates and payments of post-acute care utilization, rates of outpatient follow-up, and patient population demographics. A patient population snapshot table details several demographic variables, including a variable based on data from the Economic Innovation Group’s Distressed Communities Index (DCI). It identifies the proportion of patients living in an “at-risk” or “distressed” zip code across all payers (see Figure 3). The DCI is derived from the U.S. Census Bureau’s Business Patterns and American Community Survey.

Figure 3.

A second table provides information on index hospital locations of care for the PO’s attributed patients, comparing the percent of patients treated at each site as well as each index hospital’s average 30-day total episode payment.

The COPD PO report is also being shared with members of the newly established lung care Collaborative Quality Initiative, commonly referred to as INHALE (Inspiring Health Advances in Lung Care). INHALE focuses on patients with asthma and COPD. They disseminate strategies to improve outcomes in these patient populations and reduce the costs associated with asthma/COPD care.

MVC also partnered with a fellow Collaborative Quality Initiative to provide POs with a provider resource that may be relevant to their work with COPD patients. The Healthy Behavior Optimization for Michigan (HBOM) team provided its Quit Smoking Resource Guide to send alongside MVC’s report. HBOM aims to ensure that all smokers who are interested in quitting receive the support and resources they need to be successful. Read more about HBOM’s materials and efforts on the HBOM website or in MVC’s May spotlight blog.

If you have any suggestions on how these reports can be improved or the data made more actionable, the Coordinating Center would love to hear from you. MVC is also seeking feedback on how collaborative members are using this information in their quality improvement projects. Please reach out at Michigan-Value-Collaborative@med.umich.edu.

0

Welcoming Fall with Quality Improvement Week

October brings celebrations of Fall – with pumpkins, trips to the orchard for apple picking, and Halloween - and also Healthcare Quality Week (October 16 – 22), a time for healthcare teams to highlight their efforts to improve the quality of care for patients and families.

Over the years, various improvement methodologies have been applied in healthcare settings to advance the quality of care, reduce costs, and improve patient outcomes. Here is a look at some of the models and how they could bring value to your organization.

Six Sigma uses statistics and data analysis to reduce errors and improve processes. Originally developed in the 1980s, Six Sigma has grown over the years into an industry standard, with training and certification programs too. The Six Sigma methodology leverages the DMAIC (Define, Measure, Analyze, Improve, Control) approach (Figure 1). Following the five steps of DMAIC provides teams with a framework for identifying, addressing, and improving processes.

Figure 1: The Six Sigma DMAIC

Lean, a methodology borrowed from the automobile industry, optimizes an organization’s people, resources, and effort to create value for customers (Figure 2). Lean’s focus is on sustaining improved levels of quality, safety, satisfaction, and morale through a consistent management system. With a goal to promote, evaluate, and implement ongoing process improvements, Lean uses Value Stream Mapping (VSM) to create a visual map of each step in a workflow, allowing teams to identify opportunities for efficiency.

Figure 2: Lean Process Improvement

Additionally, Lean encourages teams to focus on continuous improvement through the Plan Do Check Act (PDCA) model, an interactive form of problem-solving used to improve processes and implement change. In a PDCA cycle, teams work through four key steps: 1) identify the problem and create a solution plan (Plan), 2) implement a small-scale test (Do), 3) review the test performance (Check), and 4) decide to adjust or implement the test on a larger scale or adjust (Act/Adjust).

Figure 3: PDCA Cycle

Total Quality Management (TQM) is a management approach for long-term success through customer satisfaction. Originally used by the Naval Air System Command, TQM is based on the principles of behavioral sciences; qualitative and quantitative analysis; economic theories, and process analysis. Using the TQM methodology allows organizations to be customer-focused, with all employees participating and engaging in continual improvement. By utilizing strategy, data, and effective communication, TQM becomes integrated into the organizational culture and activities (Figure 4).

Figure 4: Total Quality Management

With a goal to optimize activities that generate value and reduce waste, the Kaizen approach is based on the belief that continuous, incremental improvement adds up to substantial change over time (Figure 5).

Figure 5: Kaizen (Continuous Improvement) Principles

The MVC Coordinating Center supports hospital and physician organization members across the state in identifying opportunities for improvement and facilitating a collaborative learning environment for members to exchange best practices. If you are interested in discussing improvement opportunities for your site, please contact the MVC Coordinating Center at michiganvaluecollaborative@gmail.com.

0
View Post
MVC Showcases Recent Work at Obesity Summit, Poster Session

MVC Showcases Recent Work at Obesity Summit, Poster Session

Michigan Value Collaborative data and efforts were on display this week as Coordinating Center staff attended the Learning Health System (LHS) Collaboratory Seminar Series Poster Session on Thursday and the Michigan Bariatric Surgery Collaborative (MBSC) / Blue Cross Blue Shield of Michigan 2022 Obesity Management Summit on Friday. At each event, MVC was able to highlight some of its recent work.

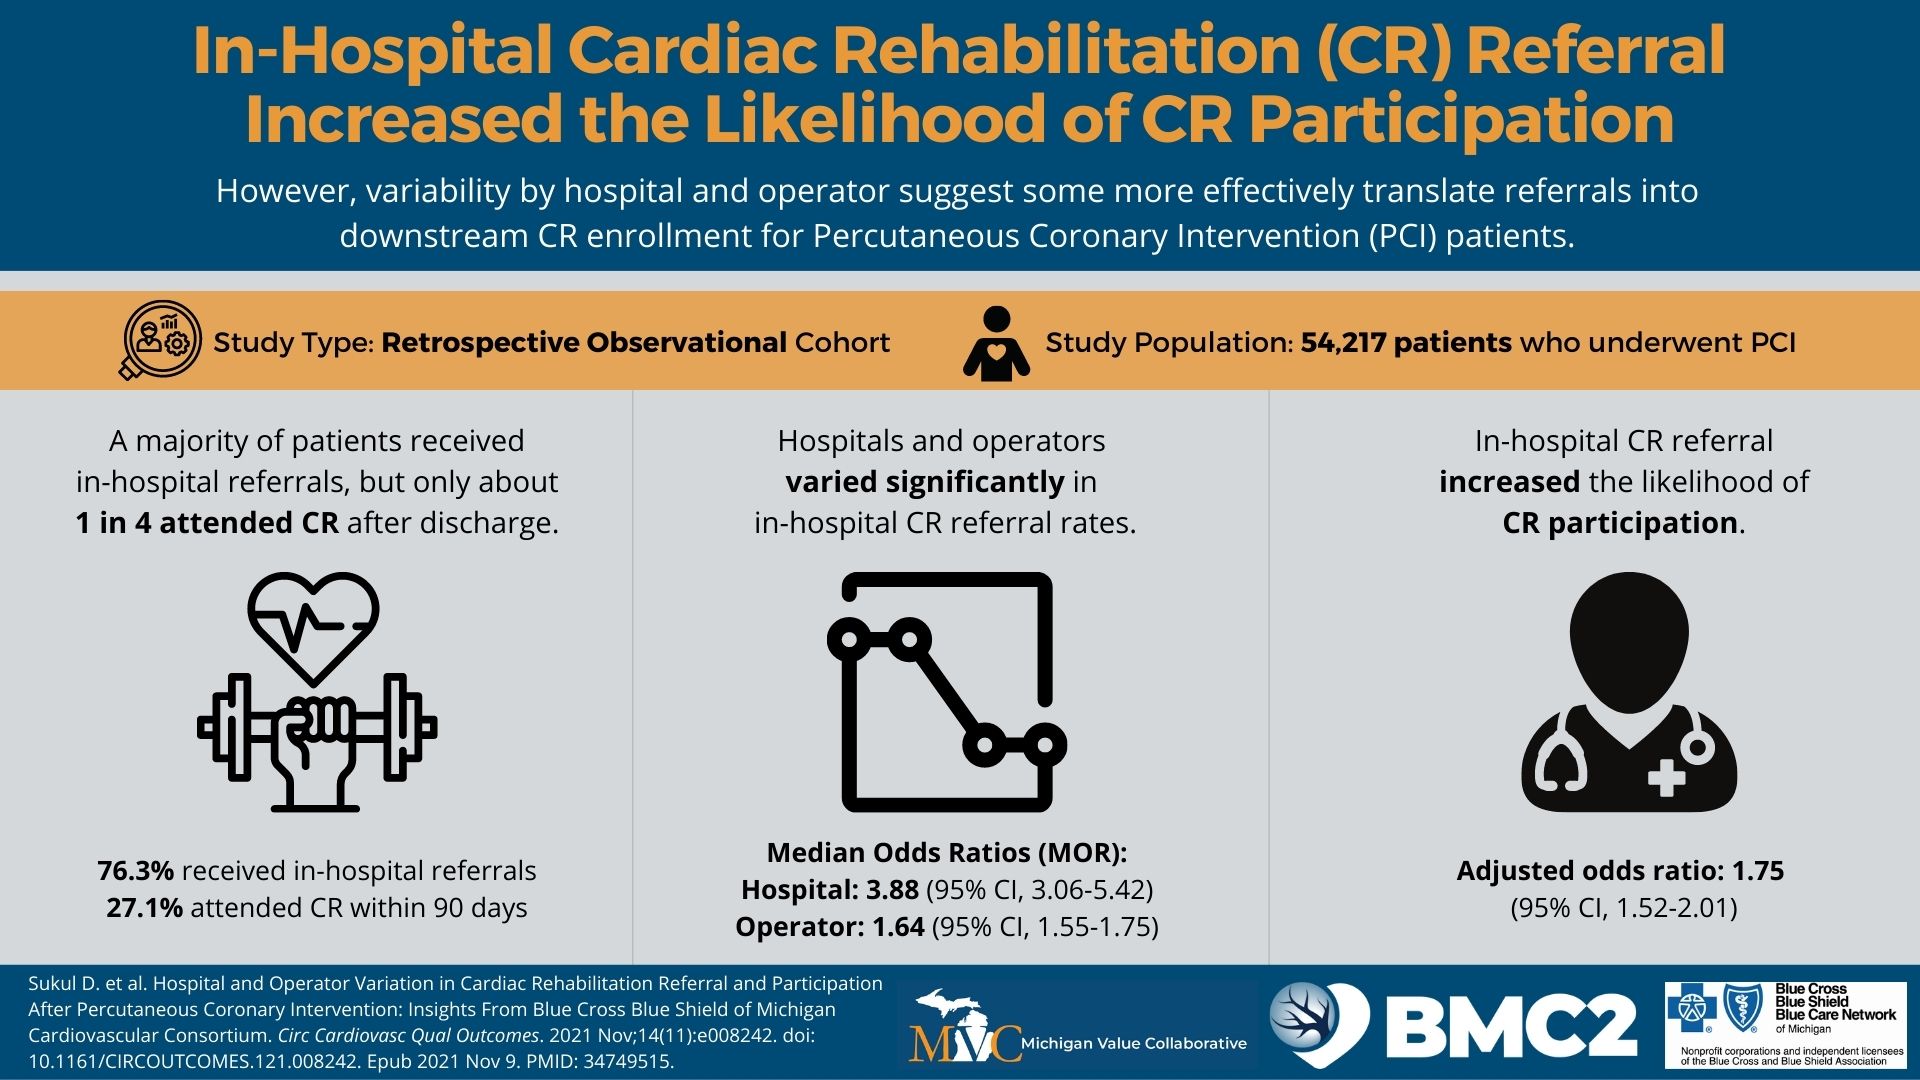
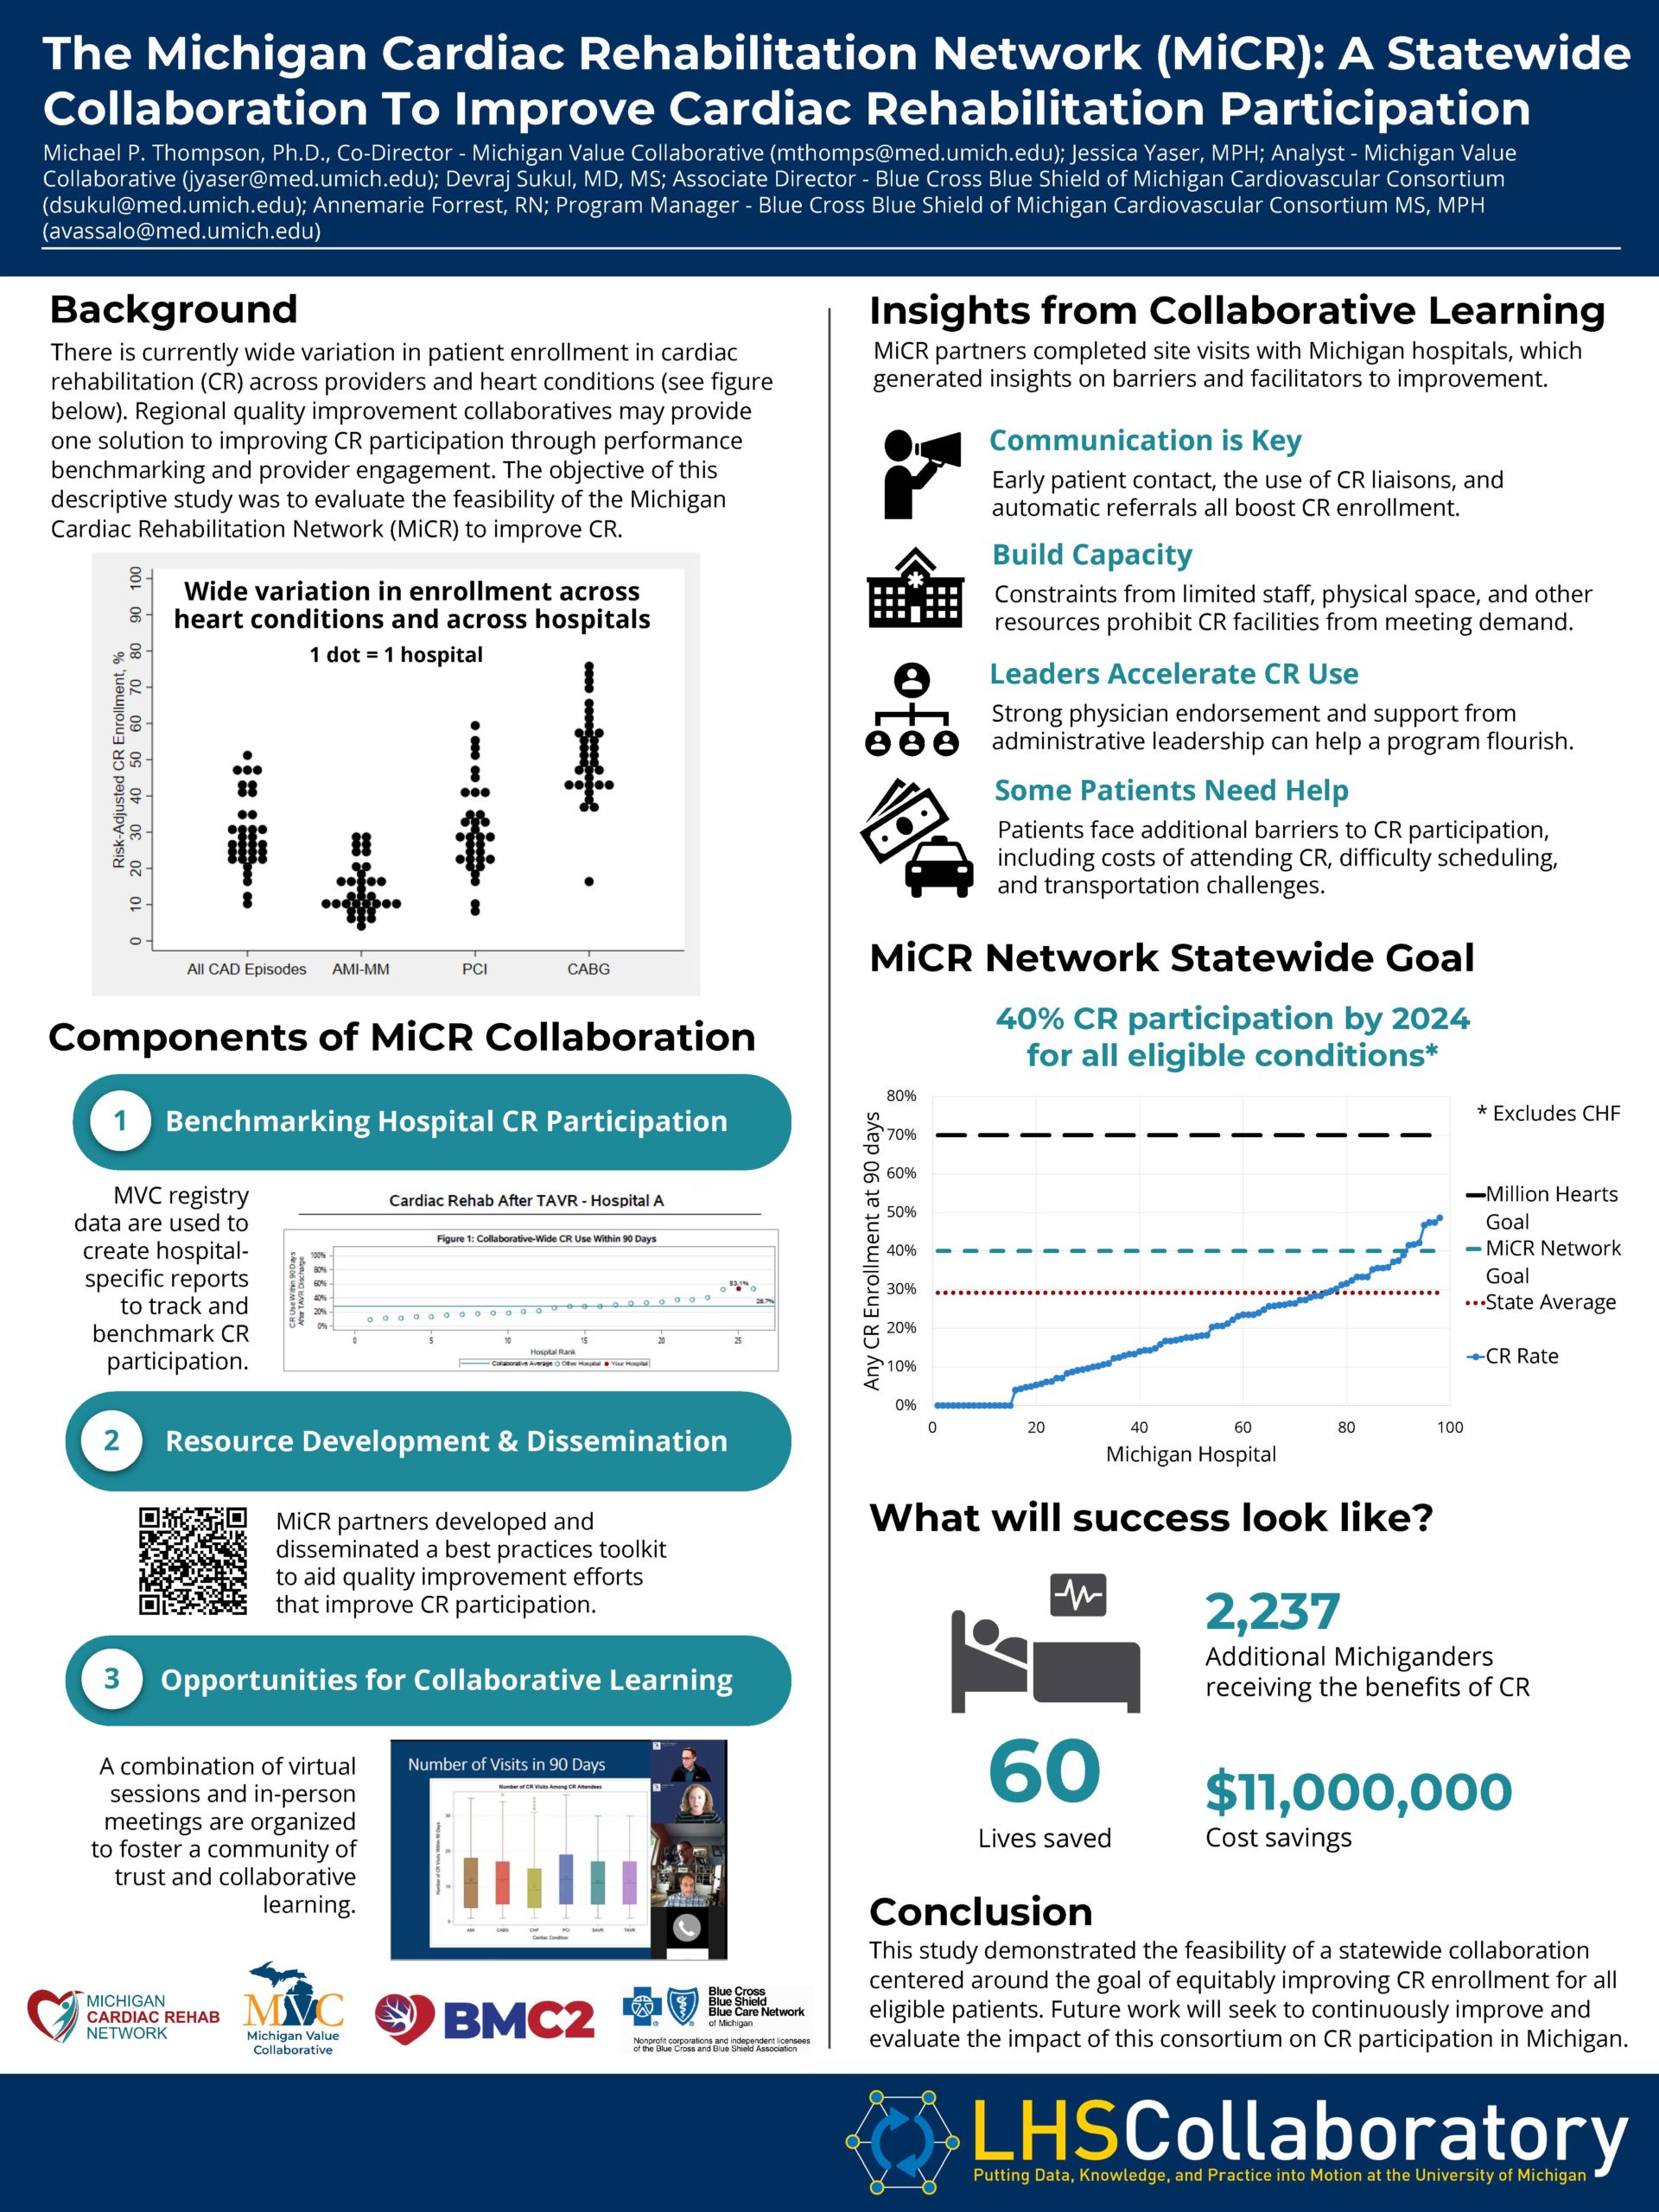
At the LHS Collaboratory poster session, MVC presented on behalf of the Michigan Cardiac Rehabilitation Network (MiCR), a partnership recently established by MVC and the Blue Cross Blue Shield of Michigan Cardiovascular Consortium (BMC2) with the aim to equitably increase cardiac rehabilitation participation for all eligible individuals in Michigan. Cardiac rehabilitation is highly beneficial to patients and cost-saving for the healthcare system, yet it is significantly underutilized in Michigan with only about 30% of eligible patients enrolling following a cardiac procedure. Using claims data, MVC can assess whether and when someone enrolls, and how long they keep going. There is wide variability in enrollment between MVC’s member hospitals as well as across cardiac conditions. The focus of the poster (see Figure 1) was a recent publication co-authored by MVC and BMC2 staff, which evaluated the feasibility of a statewide collaboration to improve cardiac rehabilitation participation. The poster summarized the key services provided by the MiCR collaboration and some of the lessons learned thus far about barriers to and facilitators of improvement. It also promoted the new statewide goal of 40% cardiac rehabilitation participation by 2024 for all eligible conditions - a goal set by MVC and BMC2. More details on this statewide goal and MiCR’s activities are summarized here.

Figure 1.

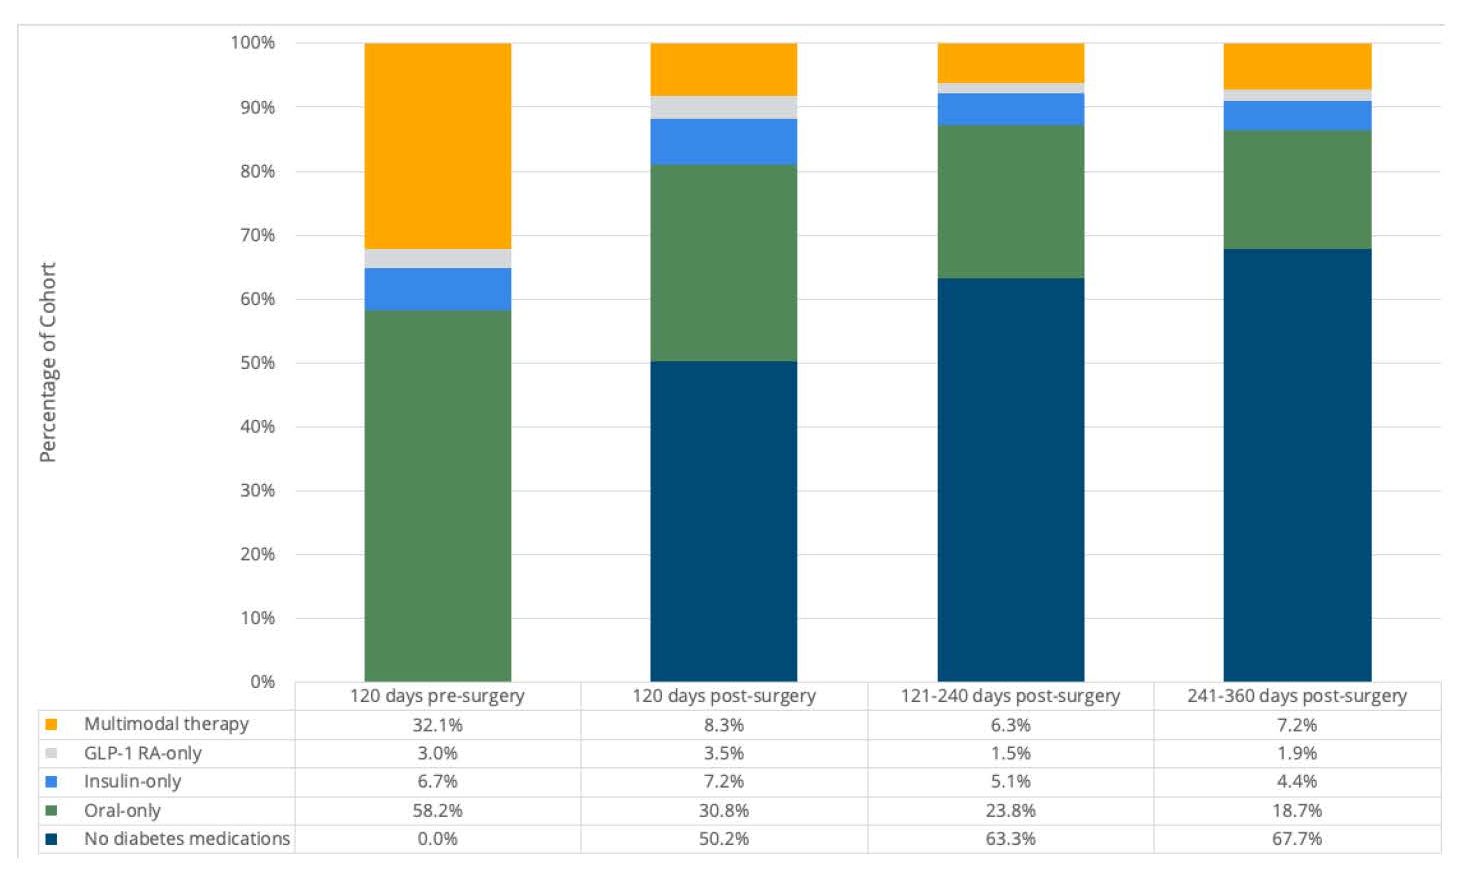
For Friday’s Obesity Summit, several MVC products were on display, including two recent analyses performed in partnership with MBSC. The two CQIs recently collaborated on a statewide improvement assessment about the impact of bariatric surgery on prescription fills for diabetes medications. Much of the evidence in the literature suggests that bariatric surgery may resolve or improve Type 2 diabetes symptoms in a large proportion of patients. MVC used its claims data to compare pre- and post-surgery receipt of diabetes medications, as well as the estimated cost savings to health insurance providers that could be attributed to a decrease in post-surgery diabetes medication prescription fills. There was a significant decrease in prescription fills for any diabetes medication (p<.001) from the 120 days pre-surgery to the 120 days post-surgery (see Figure 2).

Figure 2.

Furthermore, insurance providers in Michigan saved an estimated $76.5 million on diabetes medications in the 360 days following bariatric surgeries in 2015-2021, based on the average decrease in diabetes prescription payments per patient, the number of bariatric surgeries performed in that timeframe, and the proportion of bariatric surgery patients who have diabetes. These results provided evidence of statewide clinical outcome improvement and cost savings for Type 2 diabetes patients following bariatric surgery. The full summary of this analysis is available here.

MVC partnered with MBSC on a similar analysis of opioid medication use that was also highlighted at the 2022 Obesity Summit. MBSC has been working to reduce opioid utilization and prescribing following bariatric surgeries across Michigan for the past five years. Some of their strategies include an opioid value-based metric and a voluntary enhanced recovery initiative that incorporates evidence-based guidelines for pre-, peri-, post-operative, and post-discharge care of bariatric surgery patients. This includes a recommendation of prescribing no more than 75 morphine milligram equivalents (MME) of oral opiate following surgery - a recommendation consistent with surgery-specific guidelines set by the Michigan Opioid Prescribing Engagement Network (OPEN).

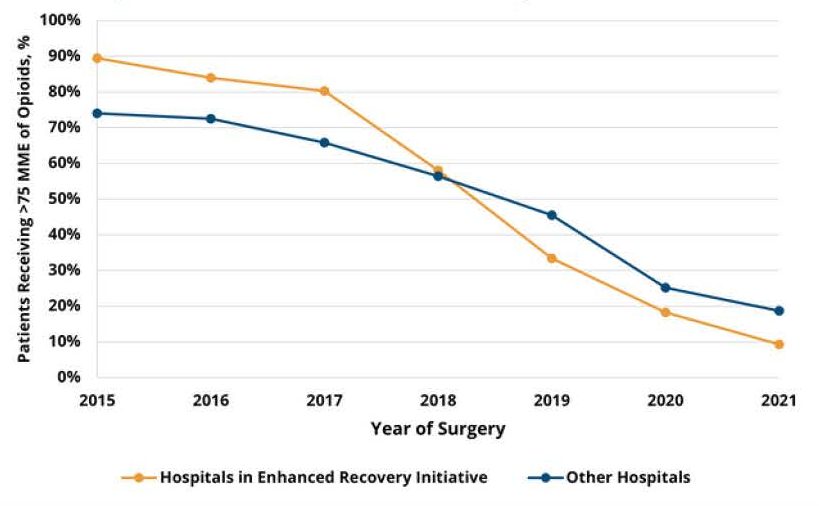
In evaluating the impact of MBSC’s opioid reduction work, analysts identified that the average amount of opioids received in 30-day post-surgery outpatient prescriptions decreased from 297.0 MME in 2015 to 65.4 MME in 2021. The percentage of patients receiving more than the recommended threshold of 75 MME decreased from 75.8% to 17.9% of bariatric surgery patients. Furthermore, hospitals that participated in MBSC’s enhanced recovery initiative saw the rate of patients receiving opioid amounts above 75 MME decrease more sharply than the rate at other hospitals (p=0.02) (see Figure 3). Given these findings, MVC estimated that MBSC’s efforts resulted in $12.5 million in cost savings because of reduced opioid prescribing after bariatric surgery. The full summary of this analysis is available here.

Figure 3.

MVC will continue to leverage its robust claims data to further the goals of fellow Collaborative Quality Initiatives as well as MVC member hospitals and physician organizations. To stay informed about newly released analyses, resources, or projects, follow MVC Coordinating Center updates on Twitter or LinkedIn. To learn more about these projects or MVC’s reporting capabilities, contact the Coordinating Center at michiganvaluecollaborative@gmail.com.

0
View Post
Hospitals Receive PY22 Mid-Year Scorecards for MVC Component of BCBSM P4P Program

Hospitals Receive PY22 Mid-Year Scorecards for MVC Component of BCBSM P4P Program

This week the Michigan Value Collaborative (MVC) Coordinating Center distributed the Mid-Year Scorecards for Program Year (PY) 2022 of the MVC Component of the Blue Cross Blue Shield of Michigan (BCBSM) Pay-for-Performance (P4P) Program. These were the first scorecards for the new two-year program cycle for PYs 2022 and 2023.

PY2022 evaluates the index admissions from 2021 as the performance year against admissions in 2019 as the baseline year. MVC is using an improved z-score methodology to calculate both improvement and achievement scores. Hospitals will continue to receive the better of the two scores for each of their two selected conditions. For a description of how the program has changed from the last two-year cycle see the Change Document.

Additionally, this cycle offers hospitals bonus points for completing and submitting a survey for each selected condition by November 1, 2022. These surveys will be used by the MVC Coordinating Center to improve the program for future years and elicit improved best practice sharing between members. The full methodology for the new program can be found in the PY2022-2023 Technical Document.

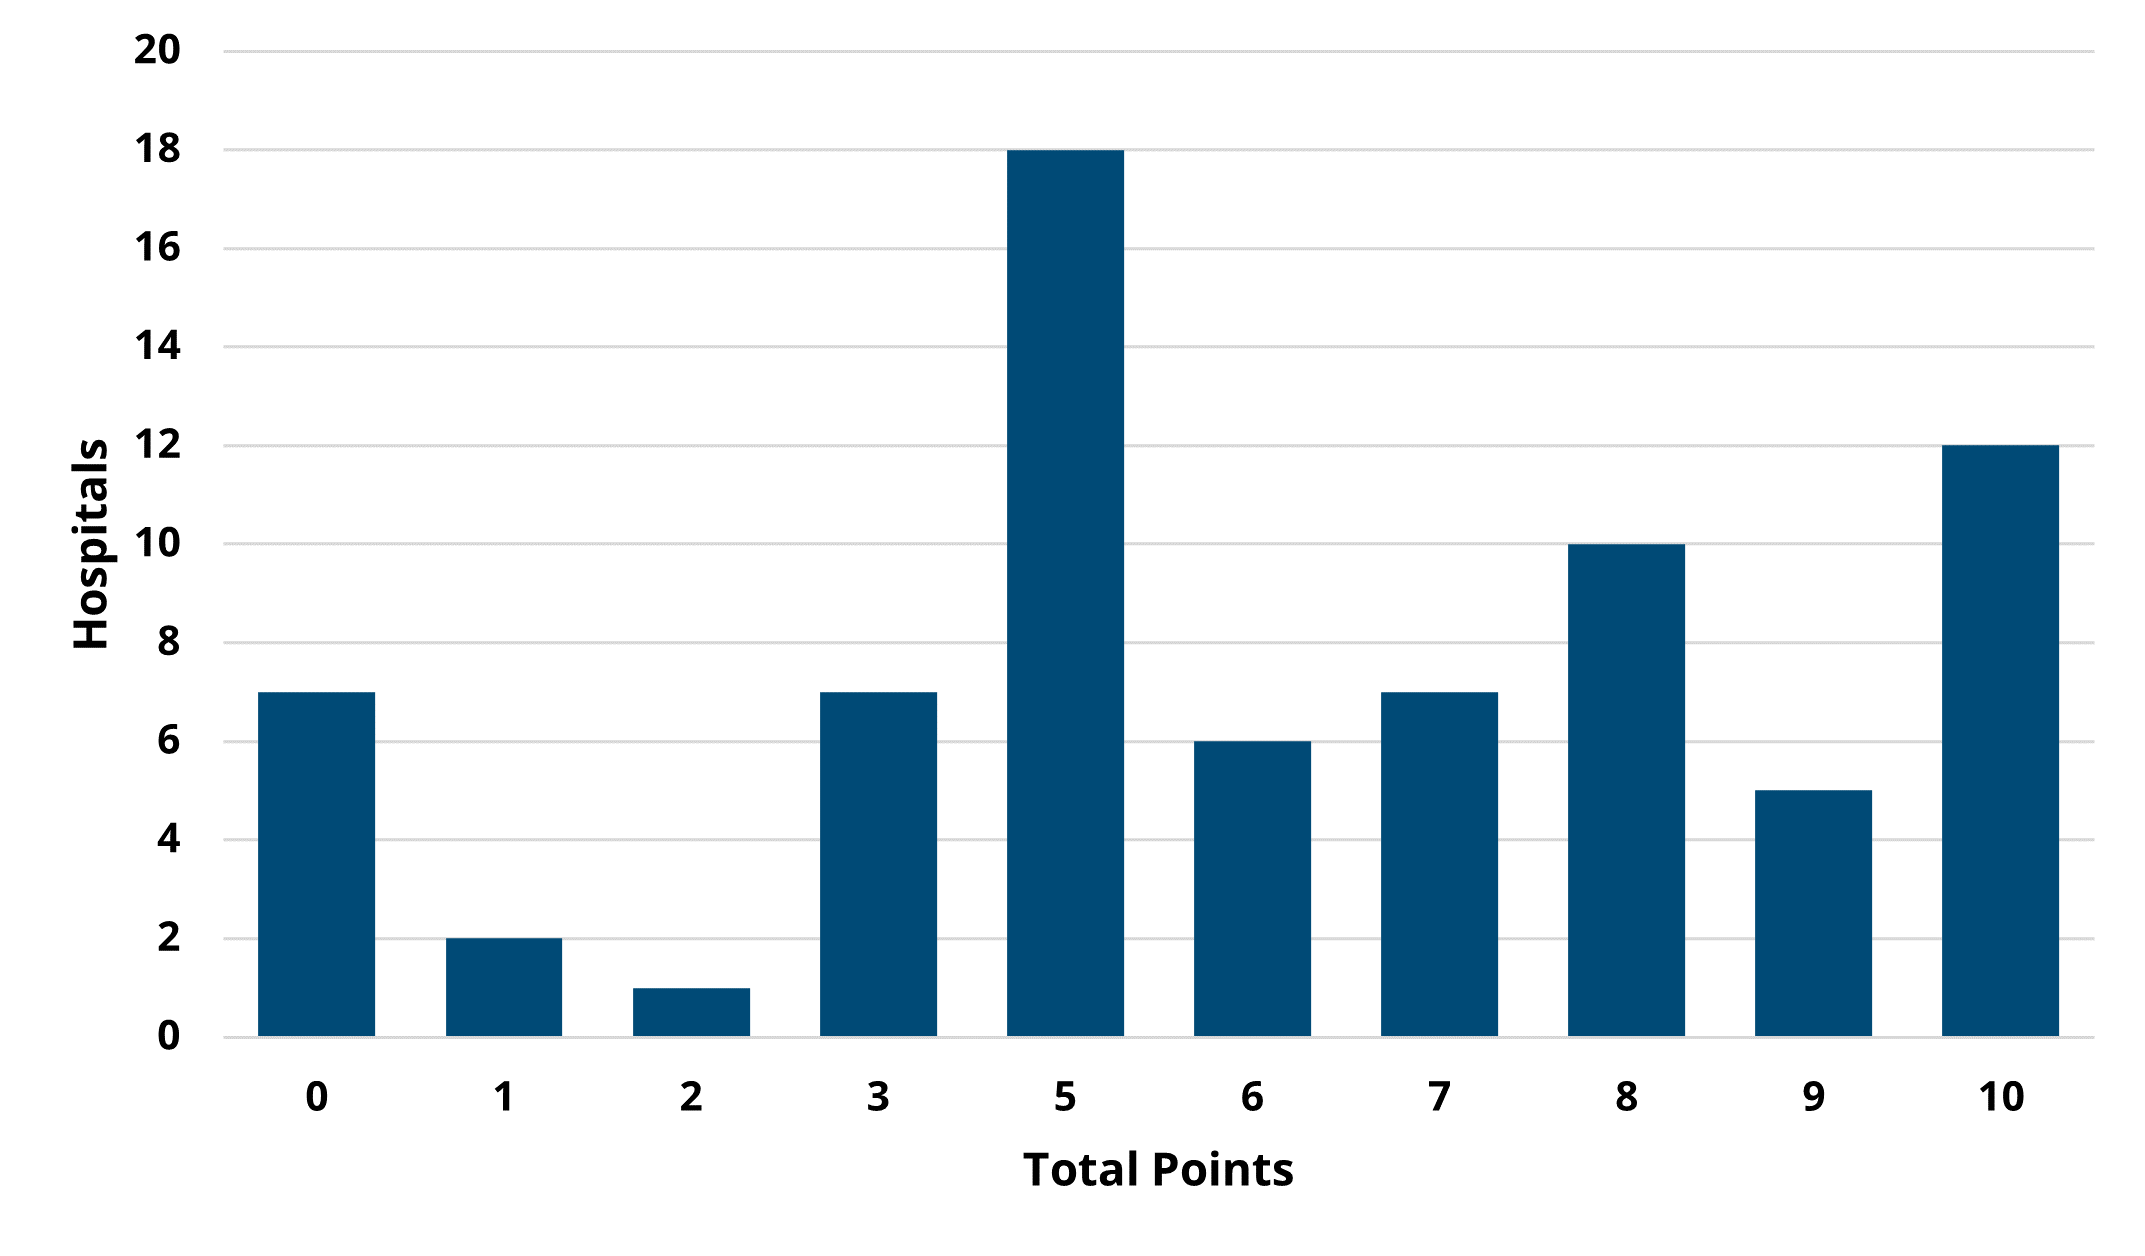
Figure 1 below illustrates the distribution of total hospital points out of 10. The average points scored for the Mid-Year Scorecards was 5.9/10 before including the survey bonus points. This is 0.9 points higher than the average points scored at the conclusion of PY21 excluding all bonus points.

Figure 1.

Figure 2 below illustrates the breakdown of average points by condition out of five. Consistent with previous years, joint replacement was the highest scoring condition with an average of 4.5 points earned. The success of the joint replacement condition can be attributed to the shift from post-acute care in skilled nursing facilities (SNF) to home health and the move towards outpatient surgeries. Pneumonia was the lowest scoring condition with hospitals earning less than one point on average. The MVC average payment for a 30-day pneumonia episode increased by $792 from the baseline in 2019 to the performance year in 2021. The largest contributors to this increase were the base payment and readmission payments.

Figure 2.

The Mid-Year P4P scores are subject to change as new data is added. The final scorecards will be distributed after all 2021 claims have been added to the data in quarter one of 2023. Hospitals can track their score through the new P4P PY2022-2023 reports on the MVC registry. These new reports provide all relevant scoring information for both improvement and achievement points in one place except for the survey bonus points. They can be filtered by selected conditions to make the tracking of P4P points easier. For a walkthrough of your hospital’s Mid-Year P4P Scorecard or P4P registry reports, please contact the MVC Coordinating Center.

0

Roll Up Your Sleeve to Save a Life

After declaring the nation’s first-ever blood crisis in early 2022 and the worst shortage in over a decade, the American Red Cross and other blood donation organizations continue to plea for blood donors. In Michigan, blood donations fell with the start of COVID-19 and continue to lag pre-pandemic levels.

Based on data from the Red Cross, someone in the United States needs blood or platelets every two seconds, resulting in approximately 29,000 units of red blood cells, 5,000 units of platelets, and 6,500 units of plasma required daily. And, while an estimated 6.8 million people in the U.S., or 3% of eligible individuals, donate blood each year, more donors are always needed!

Figure 1.

According to the Association for the Advancement of Blood and Biotherapies, donating blood is a safe, simple, and rewarding experience that usually only takes 45-60 minutes. During a typical whole blood donation, approximately 0.5 liters of blood is collected. For donations of other blood products, such as platelet or plasma, the amount collected is based on the donor’s height, weight, and platelet count.

Along with helping others in need, blood donation also has some surprising health benefits, including:

  • A free mini health screening: before donating, potential blood donors receive a brief physical exam that includes taking blood pressure, body temperature, and pulse to ensure they are fit for donation.
  • A healthier heart and vascular system: in hypertensive individuals, regular blood donation has been linked to lower blood pressure and may lower the risk for heart attacks.
  • A happier, longer life: people usually donate because it feels good to help others and altruism has been linked to positive health outcomes, including a lower risk for depression and greater longevity.

Figure 2.

Alternatively, to help protect the limited supply of blood, reduce costs associated with the collection and administration of blood products, and reduce patient complications of allergic, febrile, and hemolytic reactions, restrictive transfusion practice or conservative blood use can be considered. This practice, recommended by the National Institute for Health and Care Excellence and the Choosing Wisely campaigns, uses the two major clinical decision points of hemoglobin concentration when transfusion should be considered and the number of units being transfused.

Whilst evidence suggests there is no increase in morbidity or mortality by following restrictive transfusion practices, outcomes related to the quality of life, symptoms of anemia, and length of hospital stay are not as well studied.

Some examples of multimodal interventions to reduce unnecessary blood transfusions include the START (Screening by Technologists and Auditing to Reduce Transfusions) study which produced guideline development, education for clinicians, prospective order screening, and immediate feedback to physicians for potentially inappropriate orders, and monthly feedback to the clinical teams on appropriateness. Secondly, an Australian system-wide initiative focusing on education, practice audits, and feedback for individuals and a policy promoting single-unit red blood cell transfusions showed success. Other blood management approaches including anemia prevention, iron supplementation for iron deficiency, and a reduction in blood loss during procedures are other methods that can be used.

To implement strategies for reducing the unnecessary use of transfusions, individuals should assess their own practice against evidence-based standards. Additionally creating a multidisciplinary team to discuss and set guidelines and protocols based on evidence, auditing practices against identified evidence-based standards and tailoring interventions to the institutional setting and context can help with the implementation of restrictive transfusion practices.

Until we can find an alternative source or increase supply, we will continue to need people to step up and donate.

If you plan to donate blood, a few helpful tips can make for a better experience:

  • Drink plenty of water. Staying hydrated makes it easier to find your veins and prevents you from becoming light-headed after donating
  • Eat well beforehand and be sure to eat snacks offered to you.
  • Get a good night’s sleep and, if you are planning to exercise, do so before donating, not after.
  • Take iron tablets. The American Red Cross recommends individuals who donate blood frequently take an iron supplement or a multivitamin with iron.

Typically, donors are eligible to donate blood every 56 days or up to six times per year. To find a blood donation site near you, visit the American Red Cross or your local donation center. Every drop helps!

0

Ambulatory Surgical Centers Transforming Surgery Market

Surgery in the United States is transforming, with as many as 70% of surgeries currently performed in an outpatient setting. Ambulatory Surgical Centers (ASCs) have grown significantly over the past decade and are now a critical part of the healthcare system. The Ambulatory Surgery Center Association now represents more than 6,000 centers across the United States. ASCs account for more than half of the outpatient surgery market with roughly 23 million procedures per year. The growth of these centers has had a significant impact on hospitals. As the number of ASCs has grown and hospital outpatient departments (HOPDs) have taken on fewer cases, many hospitals have elected to set up ASCs as part of their business.

This growth has been driven in part by greater scheduling flexibility and lower costs. Since most surgeries performed in outpatient settings are elective, patients are enabled to “shop” for their facility of choice prior to treatment. ASCs exclusively provide same-day surgical services that do not exceed 24 hours or require hospitalization. They are often – but not always – specialty-specific. Some of the most common specialties serviced by ASCs are orthopedics, pain, and ophthalmology (see Figure 1).

Figure 1.

A recent study of Medicare patients evaluated the scope of practice, number of patients treated, number of procedures, and revenue for ASCs. The study found that across the United States there was a 7% increase in the number of ASCs certified to service Medicare patients. In 2018 there was an 11% increase in the number of services performed and a 6.5% increase in patients. The median number of surgeries performed at each ASC was 1,050 per year. Payments collected rose from $3.6 billion in 2012 to $5.1 billion in 2018, with cataract surgery accounting for 24% of all payments. The study concluded that the increased revenue was most likely due to the increasing complexity of procedures being performed and, thus, higher reimbursement.

The increase in more complex surgeries at ASCs can most likely be attributed to better anesthesiology methods that allow for improved pain control and reduced post-operative recovery time, as well as new technologies and techniques that make surgeries safer and more comfortable. The Leapfrog Group identified over 50 different procedures performed across 10 disciplines in their 2022 ASC outpatient surgery fact sheet (see Figure 2).

Figure 2.

Associated with this rise in complexity is the need for ASC staff to accurately identify high-risk patients who are not appropriate candidates for ASCs. Many ASCs have created their own methods for identifying these high-risk candidates since there are no universal or ready-to-use published criteria. Although no preoperative screening system is perfect, the average national ASC transfer rate to an inpatient facility is just 0.42%, and in one study the use of a criteria checklist (see Figure 3) helped the facility achieve a 0.17% transfer rate.

Figure 3.

To assist the growing number of patients in their selection of a surgical provider, several organizations now publish evaluations about the quality and safety of various ASC facilities. For example, Newsweek published their rankings of "America's Best Ambulatory Surgical Centers" earlier this year in partnership with the global research firm Statista. The list spotlights 470 facilities in the 25 states with the most ASCs, with up to 10 ranked centers by state. Michigan's highlighted ASCs (see Figure 4) received scores of 74% - 83%, which was based on a "reputation score" and KPI data score.

Figure 4.

As ASCs continue to have a transformative impact on the surgery market, the Michigan Value Collaborative is interested in learning more about the metrics and data being utilized by these stand-alone or hospital-affiliated centers. If you have any information to share, please reach out to the MVC Coordinating Center at michiganvaluecollaborative@gmail.com.

0

MVC Launches First Preoperative Testing Awareness Week

Prior to surgery, most Michigan patients will undergo a series of tests, such as blood draws, urinalysis, chest x-rays, or electrocardiograms (ECGs/EKGs). Many of these tests are unnecessary for healthy patients undergoing low-risk procedures, such as groin hernia repair or cholecystectomy. Routine preoperative testing is widely considered a low-value service, and yet a majority of hospitals continue to order these tests.

Last week the Michigan Value Collaborative (MVC) helped to increase awareness about low-value preoperative testing during its first-ever Preoperative Testing Awareness Week. MVC distributed press releases, published a daily cadence of social media content on Twitter and LinkedIn, and launched a new video (shown above) about preoperative testing – all in service of inspiring collaboration in this area.

MVC first focused on preoperative testing in 2020, when the Coordinating Center selected it as a priority area for its Value Coalition Campaigns. Since then, MVC has taken steps to reduce the use of unnecessary preoperative testing for surgical procedures to improve quality, reduce cost, and improve the equity of care delivery in Michigan. Throughout Preoperative Testing Week, the Coordinating Center’s goals were to describe the potential harm of unnecessary testing, showcase the variability in testing practices across the collaborative, and connect members with MVC resources that could help.

MVC primarily supports members via two key strategies. One is data analysis and reporting. MVC analysts utilize administrative claims data to calculate testing rates in the preoperative period, and then share these results with members as reports or as unblinded data at collaborative-wide meetings. More recently, MVC partnered with the Michigan Surgical Quality Collaborative (MSQC) to distribute these reports more widely, which enables both clinical and quality personnel to identify patterns, explore new strategies, and work together to reduce preoperative testing at each hospital.

These reports are an invaluable resource in benchmarking the extent of the issue statewide since MVC data can show members how their rates compare to other Michigan hospitals. By focusing on a homogeneous cohort of healthy patients undergoing common, low-risk surgical procedures, MVC benchmarks can help all hospitals understand where they have an opportunity to improve, regardless of facility size, resources, or patient population.

MVC data reveals large variability between hospitals—so much so that even high-performing hospitals have room to safely reduce testing rates. Across the collaborative, preoperative testing rates among young, healthy patients range from 10% to 97% in MVC hospitals. Even within hospitals, there is usually variation, with certain surgeries driving the overall rate.

The other key strategy MVC uses to support members is engagement events, which help facilitate collaboration and resource sharing among peer hospitals and physician organizations. The MVC team supports its member base of more than 100 hospitals and 40 physician organizations through events like stakeholder meetings and workgroups, where clinicians and quality improvement staff can discuss solutions to common challenges. Last week, MVC hosted a special, one-time workgroup on preoperative testing as part of its “Health in Action” workgroup series. The session featured guest presenter Dr. Michael Danic, DO, for a presentation titled, “Safe, Evidence-Based Reductions in Preoperative Testing: Why is it so hard to change?” Dr. Danic is a board-certified anesthesiologist at Ascension Genesys who has served in several leadership positions for quality and safety initiatives. A recording of the full workgroup is available here.

At the conclusion of the week, the MVC team helped its stakeholders connect to educational materials, data, specialists, and successful peers in this space. The Coordinating Center urges its members to take steps to understand their role in unnecessary preoperative testing and improve the patient experience.

The Coordinating Center is eager to continue this momentum in pursuit of a variety of goals for 2022 and beyond. If your hospital or physician organization would like support with reducing preoperative testing rates or has a success story that could help others, please reach out directly to MVC at michiganvaluecollaborative@gmail.com.

0
View Post
Semi-Annual Summary: Turning Data & Collaboration into Action

Semi-Annual Summary: Turning Data & Collaboration into Action

The Michigan Value Collaborative (MVC) held its first semi-annual meeting of 2022 last Friday. A total of 158 leaders joined the MVC Coordinating Center’s virtual meeting, representing 68 different hospitals and 15 physician organizations (POs) from across the state of Michigan. “Turning Data and Collaboration into Action” was the theme of this year’s first semi-annual, putting the spotlight on quality initiatives that successfully leveraged data or collaboration to bring about improvements in healthcare.

MVC’s Director, Dr. Hari Nathan, kicked off Friday’s meeting with an update from the MVC Coordinating Center. He welcomed two new collaborative members, McLaren Caro Region and UP Health System - Bell, as well as MVC’s newest team member, Engagement Associate Chelsea Andrews. Dr. Nathan also highlighted the successes delivered by the Coordinating Center during the first six months of 2022. This included the incorporation of Medicaid data into MVC’s suite of push reports to provide a more complete view of the collaborative’s patient population, the launch of three new push reports (colectomy, pneumonia, and P4P), and the incorporation of additional demographic data into MVC's reporting.

MVC’s recent Qualified Entity accreditation was also highlighted, representing a breakthrough for the collaborative that will allow the relaxation of certain data use agreement regulations and improve the granularity of data available to members. As part of extending this improved access, the Coordinating Center will reach out to site coordinators to have authorized representatives at each institution complete a new data use form. To align with the security requirements of the Qualified Entity program, the MVC registry will also begin requiring multi-factor authentication for users upon login. More information on each of these elements will be shared with the collaborative in the coming weeks. Chelsea Abshire Pizzo, MVC’s Manager of Analytics, rounded off the meeting welcome by sharing some highlights from Program Year 2021 of the MVC Component of the Blue Cross Blue Shield of Michigan Pay-for-Performance (P4P) Program.

Showcasing opportunities where MVC data can drive change was a focal point for the meeting. Utilizing unblinded data from the collaborative, MVC Analyst Jessica Yaser led attendees through a data session focused on MVC’s two Value Coalition Campaigns (VCCs): Preoperative Testing and Cardiac Rehab. This allowed attendees to see their preoperative testing and cardiac rehab utilization rates compared to their peers. Hospitals performing well were invited to offer insights as to how this was achieved and what mechanisms other hospitals could adopt to improve performance levels. Jessica also announced new collaborative-wide goals around cardiac rehab utilization rates (see Figure 1), which will continue to be promoted and highlighted in the months ahead.

Figure 1.

With the scene set, MVC welcomed guest speakers Mary Pool and Holly Gould from McLaren Port Huron hospital. Mary and Holly provided attendees with an overview of how they have used MVC data to help tackle high readmission rates for the congestive heart failure (CHF) and chronic obstructive pulmonary disease (COPD) patient populations at McLaren Port Huron. Specifically, data provided by the Coordinating Center helped confirm the suspicion that although follow-up rates were high across the institution, this wasn’t being translated into a reduction in readmissions. Stratifying these data further helped McLaren Port Huron introduce tailored initiatives in the form of their COPD and Heart Failure Navigator Programs, aimed at driving the effectiveness of follow-up visits (see Figure 2).

Figure 2.

After hearing from McLaren Port Huron, Michelle Marchese from BCBSM provided an overview of how their Physician Group Incentive Program (PGIP) platform supports value-based care. As part of this, Michelle provided a walk-through of the current state of BCBSM data and report sharing, outlining how these all fit together to provide valuable healthcare insights for physician organizations (POs) (see Figure 3). MVC’s ongoing partnership with BCBSM to identify PO-level opportunities for improvement was also highlighted – a collaboration that will continue moving forward to enhance the level of support available to POs across the state. Michelle then passed the baton to Dr. Shannon Martin from MyMichigan Health who shared how MyMichigan has used its internal data to develop, implement, and assess its “Health Aging Program.” This initiative is aimed at decreasing the use of high-risk medications in the elderly population, saving many seniors from the harm of adverse drug effects.

Figure 3.

The meeting concluded with a summary of the day and key upcoming activities, led by MVC Engagement Associate Chelsea Andrews. The recording from Friday’s meeting is available here. If you have questions about any of the topics discussed at the semi-annual or are interested in finding out more about MVC, please reach out to the Coordinating Center. MVC’s next semi-annual meeting will be in person on Friday, October 28 at the Radisson in Lansing – we look forward to seeing you all then!

0
View Post
MVC Integrates Surgeon-Level Data in Latest Preop Reports

MVC Integrates Surgeon-Level Data in Latest Preop Reports

In 2020, the Michigan Value Collaborative (MVC) introduced the Preoperative Testing Value Coalition Campaign (VCC) with the aim of reducing the use of unnecessary preoperative testing for surgical procedures. Preoperative testing, especially in low-risk surgical procedures, often provides no clinical benefits to patients but is ordered regularly at hospitals across Michigan. As part of MVC’s campaign to eliminate unnecessary and potentially harmful preoperative testing, the Coordinating Center developed a related push report, the latest version of which was shared earlier this week to help members benchmark data for common preoperative tests. MVC and the Michigan Surgical Quality Collaborative (MSQC) partnered to distribute these reports more widely and to encourage clinical and quality personnel to work together in identifying patterns and exploring new strategies.

This iteration of the report is the first to include blinded surgeon-level reporting, which will allow for a more nuanced understanding of variation within a given hospital. To include this, the Coordinating Center attributed one surgeon per episode based on condition-specific BETOS codes and NPI specialty information, with the understanding that the attributed surgeon may not be the individual ordering the preoperative test for that procedure. If their MVC data indicates wide variation between specific providers, hospitals may choose to drill down into their own data to investigate further. For hospitals that have several surgeons with enough cases for these procedures, there was significant variation in testing rates (see Figure 1).

Figure 1. Rate of Any Preoperative Test by Surgeon (Blinded Report)

Included in the report were patients undergoing elective and outpatient laparoscopic cholecystectomy, laparoscopic inguinal hernia repair, and lumpectomy. It incorporated index admissions between 1/1/2018 – 12/31/2020 for Blue Cross Blue Shield of Michigan (BCBSM) PPO Commercial, BCBSM Medicare Advantage, Blue Care Network (BCN) HMO Commercial, BCN Medicare Advantage, Medicare Fee-For-Service (FFS), and Michigan Medicaid. Hospitals only received a report if they had 11 or more cases in at least one of the three conditions and at least 11 cases per year in the three procedures combined. The analysis evaluated the use of the following tests using CPT codes: electrocardiogram, echocardiogram, cardiac stress test, complete blood count, basic metabolic panel, coagulation studies, urinalysis, chest x-ray, and pulmonary function.

In general, the report demonstrated significant variation in testing rates between members, with some testing rates ranging from 20% to over 90%. Due to the amount of variation, MVC suspects that preoperative testing is overused at the state level such that even hospitals that are average or below average may still have significant opportunities to safely reduce preoperative testing. The report included a table with each hospitals’ rates for each procedure and test, with accompanying comparisons to the rates of regional peers and the collaborative as a whole (see Figure 2).

Figure 2. Preoperative Testing Rates Table (Blinded Report)

The report also included figures for preoperative testing rates by specific tests, by payer, and by procedure. The variety of figures is meant to help hospitals better understand its variability in utilization, since specific procedures or tests may be driving their overall testing rate. One figure, for example, presents a hospital's three procedure-specific testing rates alongside their overall or “combined procedures” rate. To more easily identify areas of opportunity to reduce their overall testing rate, a hospital can compare their procedure-specific rates to determine which is driving their average, as well as compare their average to those of their regional peers and the collaborative as a whole (see Figure 3).

Figure 3. Rate of Any Preoperative Test by Procedure (Blinded)

In the case of the blinded example above, this hospital is more frequently ordering preoperative testing in cholecystectomy patients but is ordering fewer tests on average than their peers for all procedures combined. This finding is atypical since lumpectomy was found to have a higher testing rate in general; cholecystectomy testing rates were generally lower. In addition, MVC found that electrocardiography and blood tests (complete blood count, basic metabolic panel, coagulation studies) had the highest testing rates across all procedures.

Helping MVC members to make internal and external data comparisons is core to MVC reporting and is critical to its efforts to reduce unnecessary testing. As part of MVC's continued efforts in this area, the Coordinating Center will share hospital-level preoperative testing data at its upcoming semi-annual meeting in order to foster continued awareness of wide practice variation and encourage best practice sharing between members.

MVC is eager to drive improvement in this area. For more information on how MVC is working to reduce unnecessary preoperative testing, visit its Value Coalition Campaign webpage here. If you are interested in a more customized report or would like information about MVC’s preop testing stakeholder working group, please contact the MVC Coordinating Center at michiganvaluecollaborative@gmail.com.

0

MVC Shares New Pneumonia Push Report with Hospitals

The Michigan Value Collaborative (MVC) introduced its first ever pneumonia push report this week when the Coordinating Center shared individualized reports with 89 hospitals across Michigan. This report was created in response to member interest and incorporated 30-day claims-based episodes with index admissions from 1/1/18 – 12/31/20 for the following payers: Medicare FFS, Blue Cross Blue Shield of Michigan (BCBSM) PPO Commercial, Blue Care Network (BCN) Commercial, BCBSM MA, BCN MA, and Medicaid. Reports were created for all MVC member hospitals that had at least 11 pneumonia episodes per year in 2018, 2019, and 2020.

One goal for this report was to provide data that would be useful for a broad range of MVC’s increasingly diverse membership. Critical Access Hospitals (CAHs), for example, are some of MVC’s newest members and differ in several meaningful ways from other hospitals in the collaborative. Therefore, MVC distributed two different versions of the pneumonia report in order to refine comparison groups and provide a more tailored view of the data. As a result, 81 general acute care hospitals received a pneumonia report comparing their performance to 1) all other eligible general acute care hospitals in the collaborative and 2) acute care hospitals in their geographic region. The second version of the report was shared with eight eligible CAHs, which compared their performance to other MVC CAHs. By providing hospitals with tailored comparison groups when appropriate, MVC hopes to strengthen the usability of its claims-based data to inform quality improvement initiatives.

After much consideration, the MVC team decided to remove any pneumonia episodes containing a confirmed diagnosis of COVID-19 (U07.1) in the first three diagnosis positions of an inpatient facility claim from this report. Members can now replicate this approach on the MVC registry for episodes from April 2020 or later using the new COVID-19 filter, which allows users to include or exclude episodes that contained an inpatient facility claim with a confirmed COVID-19 diagnosis. For the purposes of this push report, the Coordinating Center further excluded all pneumonia episodes from March 2020 in order to remove COVID-19 hospitalizations that occurred in Michigan before an official COVID-19 diagnosis code was available and were coded as pneumonia.

Measures included in the pneumonia report were trends in average price-standardized risk-adjusted total episode payments, average index length of stay, index in-hospital mortality rates, trends in 30-day readmission rates, rates of 30-day post-acute care utilization, and rates of seven-day outpatient follow-up. Overall, the Coordinating Center found that the in-hospital mortality rate for both groups of hospitals was about 2%. One noticeable difference between the two report groups was that CAHs had a shorter average length of stay for index pneumonia hospitalizations (4.6 days, see Figure 1) than general acute care hospitals (5.8 days, see Figure 2).

Figure 1. Average Index Length of Stay at CAHs

Figure 2. Average Index Length of Stay at Acute Care Hospitals

Post-acute care utilization rates were stratified by emergency department (ED), home health, rehabilitation, and skilled nursing facility (SNF). In general, the most frequently utilized category of post-acute care for pneumonia episodes was home health at a rate of 20% for acute care hospitals (see Figure 3) and 24% for CAHs (see Figure 4). Furthermore, there was wide variability in seven-day outpatient follow-up rates for both types of hospitals, but the average for acute care hospitals was higher at 39.7% (see Figure 5) compared to 24.4% (see Figure 6) for CAHs.

Figure 3. 30-Day Post-Acute Care Utilization Rates at Acute Care Hospitals

Figure 4. 30-Day Post-Acute Care Utilization Rates at Critical Access Hospitals

Figure 5. Seven-Day Outpatient Follow-Up Rates at Acute Care Hospitals

Figure 6. Seven-Day Outpatient Follow-Up Rates at Critical Access Hospitals

By understanding the unique needs of its members, MVC can improve future reports for use in quality improvement activities. If your hospital is interested in sharing feedback about the new pneumonia report or has a specific follow-up request, please reach out to the Coordinating Center at michiganvaluecollaborative@gmail.com.