0

Health Equity Report Refreshed with New Data and Demographics

With an enhanced strategic focus on health equity, the MVC Coordinating Center was excited to share refreshed versions of its health equity push report this week. The health equity report was first launched in August 2021 in response to growing interest from members as well as widening gaps in health outcomes for patients with a lower socioeconomic status. The purpose of the report is to help members better understand their patient population, and the newest version re-examines some of the original findings. It also adds data to help providers identify the most impacted patients and understand how their care differs from patients with a higher socioeconomic status.

The report distributed this week provided a comparison of Medicaid patients to Blue Cross Blue Shield of Michigan (BCBSM) and Blue Care Network (BCN) patients, whereas the first iteration compared outcomes of dual-eligible versus non-dual-eligible Medicare patients. Therefore, one change from the previous report is that the patients included are much younger on average. This report incorporated index admissions from 1/1/2018 – 9/30/2021 for BCBSM PPO Commercial and BCN HMO Commercial and from 1/1/2018 – 12/31/2020 for Medicaid. Members who received reports will see comparisons between these two groups for total episode payments, length of stay, 30-day readmission rates, 30-day post-discharge emergency department utilization, and 30-day post-discharge office visit rates.

Despite utilizing different payer data, insurance type was still a good predictor of health outcomes in the report. The Coordinating Center continued to see poorer outcomes across the board for those patients who were publicly rather than privately insured – a finding that is consistent in the research literature as well. These disparities were most pronounced among medical conditions than surgical procedures.

This report continued to look at post-acute care trends but narrowed its focus to office visits specifically. This is because there were significant differences in office visit rates by insurance type in the previous report and skilled nursing facility use was much less relevant within this report's younger patient population. When looking at office visit utilization, the rates were significantly different between BCBSM/BCN and Medicaid patients for both medical conditions (see Figure 1) and surgical procedures. However, the disparity was more pronounced in medical conditions. MVC saw a decrease in office visits in early 2020 across the state that is believed to be related to the pandemic, but visits returned to pre-pandemic rates in the latter half of the year. Furthermore, episodes were excluded from this report if they contained a confirmed diagnosis code of COVID-19 in the first three diagnosis code positions of any inpatient facility claim.

Figure 1. Office Visit Trend Graph from Blinded Report

Another key change to the report was the addition of a patient population demographics table (see Figure 2), which provides the hospital with age, race, zip code, and comorbidity information for Medicaid versus BCBSM/BCN patients. Overall, the most common comorbidity across the state was diabetes, and the Medicaid population was younger on average.

Figure 2. Demographics Table from Blinded Report

Like the first version of the report, there was a conscious decision to exclude comparison groups. This is because the socioeconomic factors of a hospital’s patient population cannot be changed, and there is great diversity between hospitals throughout the state and within geographic regions. For those reasons, benchmarking was not the intention of this report. However, it is important to note that across the state, the data analyzed by the MVC Coordinating Center consistently indicates that Medicaid patients have poorer outcomes than privately insured patients, including longer lengths of stay, higher readmission rates, higher post-discharge emergency department utilization, and lower rates of office visits post-discharge.

The MVC Coordinating Center is eager to support members in improving health equity. Please consider sharing feedback on this report with the Coordinating Center, as well as attending MVC’s newest workgroup on health equity to learn and share with peers. If you have any questions, comments, or suggestions, please contact the Coordinating Center at michiganvaluecollabortative@gmail.com.

0
View Post
New Health Equity Workgroup Has Successful Launch

New Health Equity Workgroup Has Successful Launch

Health equity has captured the attention of healthcare. It was a top trend for healthcare providers in 2021, and surveys indicate it will be one of the main priorities for large healthcare employers in 2022. It is also a key strategic focus of the MVC Coordinating Center in the years ahead. As such, MVC is building out offerings for its members in this space, which began with the launch of its new health equity report and was followed by a semi-annual meeting dedicated to the topic in October 2021. Most recently, MVC launched a new health equity workgroup, which will continue to meet on a bimonthly basis in 2022.

The first health equity workgroup took place this week featuring speakers from the MSHIELD (Michigan Social Health Interventions to Eliminate Disparities) collaborative—one of the newer teams in the Blue Cross Blue Shield of Michigan Collaborative Quality Initiative (CQI) portfolio. MSHIELD Co-Director Dr. John Scott co-presented with MSHIELD Program Manager Carol Gray. They were joined by 72 attendees representing hospital teams, physician organizations, fellow CQIs, and other areas. The presentation focused on the role of MSHIELD in addressing social risk factors in healthcare as well as members’ approaches to health needs screening, referral, and linkage.

The social determinants of health (SDOH) have a tremendous impact on patient health outcomes, resulting in Healthy People 2030 naming it one of its five priorities. With thousands of journal articles confirming the impact of the SDOH, there is now a shared understanding across healthcare providers that this area is a priority. In fact, it affects patient health outcomes significantly more than clinical care (see Figure 1). MSHIELD’s presenters highlighted this fact and used it as an opportunity to define a common language for the discussion. They said health equity is achieved when every person can attain their full health potential and no one is disadvantaged from achieving this because of socially determined circumstances.

Figure 1. Graphic from MSHIELD Presentation

MSHIELD will serve as a link between the healthcare system, the community resources that can reliably serve patients’ social needs, and the communities that are home to those patients. To that end, MSHIELD will help establish partnerships with key healthcare and community entities and promote the exchange of data and services in a way that helps achieve health equity.

Unlike some of the “legacy” CQIs that are clinically focused, MSHIELD will fill a consulting role with other CQIs to help them set and meet goals related to health behaviors and social needs. Since health equity is a multi-faceted issue affecting all areas of health, MSHIELD also has an unlimited population and practice focus. For the time being, however, the speakers identified that MSHIELD is particularly interested in food access, housing instability, and transportation since those are areas with the strongest evidence for impact in a clinical setting.

MSHIELD’s presenters also summarized their findings from an environmental scan of the larger CQI portfolio. Last year they surveyed the other CQIs in the BCBSM Value Partnerships portfolio to identify what types of SDOH data they may collect and how. Of the 16 SDOH domains (see Figure 2), MSHIELD found that almost all CQIs collect data on demographics, insurance status, and health-related behaviors. However, only three CQIs currently collect data related to material hardship (e.g., food insecurity, housing insecurity, transportation, medication affordability, access to technology, childcare, etc.). MSHIELD hopes to help build on what has been collected so far and assist providers and CQIs alike in their pursuit of health equity initiatives.

Figure 2. Domains of the Social Determinants of Health from MSHIELD Presentation

The workgroup concluded with an active discussion about current practices and challenges experienced by providers in identifying, referring, linking, and following up with patients. Representatives from physician organizations and hospitals alike shared examples about how they integrate screening and capture this data, which led to conversations about the technologies used to assist with this process and the value of universal versus targeted screening strategies. Most of the participants who shared their experience expressed that whichever strategy they adopted, there were efforts to make the screening questions accessible for those with language or literacy barriers. Examples of this that were provided by members included translating materials to common languages from their local community and utilizing the professional abilities of social workers on site. There were also discussions about how to best identify resources within a given community for the purposes of referrals, with some thoughtful suggestions about partnering with community health needs assessment teams and social workers from within hospitals.

To hear the full discussion and learn more details about MSHIELD, the full recorded workgroup can be viewed here. MVC looks forward to continuing this health equity conversation on March 16. Register for the next MVC health equity workgroup here. If you would like to receive future MVC workgroup invitations or you have an idea for a future speaker, please contact the Coordinating Center at michiganvaluecollaborative@gmail.com.

Speaker Biographies:

Dr. Scott is an Assistant Professor of Surgery in the Division of Acute Care Surgery at the University of Michigan. His health policy and health services research interests are focused on improving access to timely, affordable, high-quality surgical care for the acutely ill and injured.

Carol Gray leads the overall management, performance, and coordination of the MSHIELD program and team. She has extensive experience managing public health research teams, communicating across and coordinating with multiple partnerships, and linking and engaging with community-based organizations.

0

Special Consideration Needed for Older Patients Using Telecare

When most people think about healthcare, the images that come to mind include a trip to their local provider’s office, lab, or hospital for services such as physicals, blood tests, and procedures. However, medical professionals and their patients are increasingly transitioning to more remote services that leverage our advances in communication technologies, resulting in the burgeoning “tele” world of healthcare. But are these services reaching everyone?

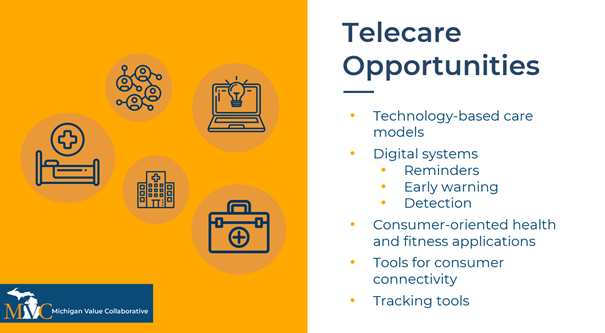
Telemedicine, telehealth, and telecare are three examples of remote, interactive services that allow patients to receive healthcare from within their own homes. Although these terms are often used interchangeably, they in fact refer to different aspects of healthcare delivery. Telemedicine applies to physicians who use technology to support the delivery of medical, diagnostic, or treatment-related services. Telehealth is like telemedicine but applies to a broader collection of providers, such as nurses or pharmacists. Telecare (see Figure 1) is generally more consumer-oriented by providing the patient with technology to manage their own care safely from home, such as health apps or digital monitoring devices.

Figure 1. Telecare Slide from MVC Workgroup Presentation

The adoption of “tele” services saw incredible growth in 2020 in response to the pandemic. A report found that Medicare telehealth visits increased 63-fold recently, from 840,000 in 2019 to 52.7 million visits in 2020. However, now that adoption of these services (and the platforms needed to host them) are more commonplace, providers are asking whether it benefits their most vulnerable patients and who may be left behind.

These questions drove the discussion of the most recent MVC workgroup on chronic disease management. Over the course of the session, attendees were particularly interested in how telecare improves elderly care, and whether patients over the age of 65 could adequately access such services. For those older adults utilizing telecare, evidence from the ongoing COVID-19 pandemic identified convenience and affordability as telecare’s primary strengths. In addition, research evidence suggests that the two most effective telecare interventions in this population are automated vital sign monitoring and telephone follow-up by nurses.

Some of the challenges often cited for this population include lack of appropriate internet access or devices, limited digital literacy, medical conditions that may impede participation (i.e., hearing or vision impairments, dementia, etc.), and the need to regularly monitor vitals in very high-risk patients. Although the authors compiling these challenges specifically reference older adults, they could just as easily apply to people experiencing poverty, people with disabilities, and people with more limited language and literacy skills.

Some recommended strategies to address common challenges include tablet delivery services, “mobile medical assistants” who perform video set-up for the patient, assistance from an on-site caregiver, practice or “mock” video visits prior to the appointment date, partnerships with community health workers to support or train patients in their homes, and providing self-monitoring devices. Other simple considerations include the size of the text displayed on the page (use larger text to enhance readability), providing adequate instructions in advance and in multiple languages, and engaging experts in user experience design.

In addition to these considerations, some researchers suggest that, in general, the adoption of new technologies can be predicted in part by Everett Rogers’ Diffusion of Innovation Theory. One study incorporating this theory found that the chances of telecare adoption were highest for three types of older adults: those already receiving long-term or nursing care, those living alone, and those who have fixed daily telecare points of contact.

Increased integration of technology in healthcare is inevitable as advancements continue and we shift to a more digital world. Since the number of people in the U.S. who are age 65 or older will more than double over the next 40 years, it is imperative that older adults are not left behind when transitioning to such services. Rather than fear the challenges, researchers and practitioners are seeking ways to find solutions and help all patients benefit from healthcare access within their own homes.

The MVC Coordinating Center encourages its members to collaborative with one another to benefit from peers’ success stories and lessons learned. If your hospital or physician organization has developed an age-friendly telecare protocol, please consider sharing your story with the MVC Coordinating Center at michiganvaluecollaborative@gmail.com. To catch up on the recent MVC workgroup discussion about telecare, watch the chronic disease management workgroup recording here.

0
View Post
Patient-Reported Outcomes Improve Quality, Equity of Care

Patient-Reported Outcomes Improve Quality, Equity of Care

For several years, patient-reported outcomes (PROs) have been a topic of interest, in part due to increased utilization of electronic data and the integration of delivery systems. PROs are defined by the Food and Drug Administration (FDA) and National Quality Forum as "any report of the status of a patient's health condition that comes directly from the patient, without interpretation of the patient's response by a clinician or anyone else." In short, PRO tools ask patients questions to measure how they feel and what they are experiencing. With patient-reported outcome measures (PROMs), patients provide information about their health, quality of life, and functional status, either in absolute terms (e.g., pain severity rating) or in response to treatment changes (e.g., new nausea onset). The goal of gathering this information from the patient’s perspective without any interpretation from a healthcare provider is to improve both the quality of care being delivered and health outcomes.

The use of PROs has a variety of potential benefits. They can elicit enhanced patient engagement, be used to clarify the patient’s priorities and thus improve shared decision-making between patients and providers, and can bring to light any benefits or harms of interventions. The potential impact of PROs, therefore, is substantial because involving patients in their healthcare is linked to a myriad of positive patient outcomes. For example, based on a review of studies investigating patient participation, some of the benefits to patients include:

  • increased satisfaction and trust,
  • empowerment,
  • greater self-efficacy to manage health,
  • higher quality of life,
  • better understanding of condition and personal requirements,
  • improved adherence to medical treatment plans,
  • improved communication about symptoms with positive and lasting effects on health.

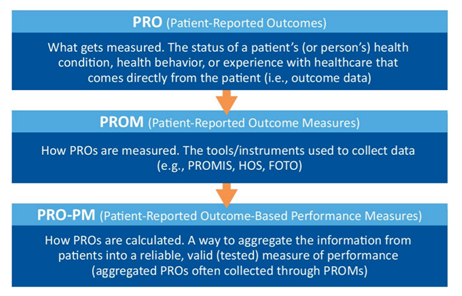
Ever increasing in its availability, the use of PROs is included in clinical investigations, healthcare practice, healthcare management, and various regulatory or reimbursement areas. As the patient continues to become more central to healthcare, they are in the best position to determine if their healthcare objectives have been achieved. PROMs are not the same as measures reported by patients on their experience of the healthcare system, such as being treated with dignity or waiting too long; however, patient-reported outcome-based performance measures (PRO-PMs) are beginning to find their way into healthcare and may integrate such measures. To help understand the relationship between PROs, PROMs, and PRO-PMs, see Figure 1, which was designed by the Centers for Medicare and Medicaid Services (CMS) in their supplemental guide on PROMs.

Figure 1.

To gather PROs, the tools and instruments known as PROMs must measure criteria that are identifiable, valid, and reliable. Most often these are general or disease-specific self-completed questionnaires, scales, or single-item measures that provide a score for any of the following:

  • functional status,
  • health related quality of life,
  • symptom and/or symptom burden,
  • personal experience of care,
  • health-related behaviors.

Generic PROMs often delve into areas covered by a variety of different conditions, allowing for comparisons across multiple medical conditions. These PROMs help with evaluation and implementation of care provision methodology and equality of service delivery. Some may even provide a cost-effectiveness component. Disease-specific PROMs identify the impact of definitive symptoms on the condition. PROMs can be used as either the primary or secondary outcome measure of a study or trial, and most studies use a combination of disease-specific and generic PROMs.

Measurement tools integrate other existing data (biological, genetic, clinical, and physical) to assess how a patient is functioning regarding their overall health, quality of life, mental well-being, or satisfaction with a healthcare process. Using all these data sources provides a more complete picture of the patient’s health journey and allows for patients and their providers to share decision-making and define individualized care. They also provide a unique opportunity to identify inequalities in healthcare access and treatment.

When utilizing PROMs, practitioners must plan for how the information will be collected and utilized. PROMs can be collected in a variety of ways, including face-to-face interviews, online or paper questionnaires, telephone interviews, or diaries. When deciding which PROMs to utilize, it is important to consider the preferences of patients, providers, and any other involved decision-makers. It is also essential to consider the cognitive, physical, demographic, and socioeconomic barriers that may exist for the patient to ensure they have adequate accommodations to participate. The length, schedule, and timeframe of assessments should also be appropriately assessed, along with any permissions needed to use the information. Lastly, the PROMs should be easy to score and interpret, actionable, and able to facilitate clinical decisions.

The use of PROs is here to stay. The hope is that improvements in interoperability, data governance, security, privacy, and ethics will allow greater integration of PROs. In turn, PROs will allow patient preferences, needs, and health outcomes to further drive value-based healthcare.

0

MVC Coordinating Center Launches Health Equity Report

As hospitals begin to identify lessons learned since the start of the pandemic, providers are keenly aware of the prevalence and exacerbation of existing health inequities. Despite the fact that many providers are increasingly interested in addressing the social determinants of health (SDOH) and equitable access to care, communities of color and other minorities that are statistically more impacted by SDOH and socioeconomic status (SES) have endured even wider gaps in health outcomes and care this past year. For many hospitals and physician organizations, the way forward requires the application of a health equity or social risk lens across the board, so that basic healthcare and quality improvement decision-making can be maximized for all patient populations, not just those with fewer social risk factors. The MVC Coordinating Center is, therefore, proud to have released its first MVC Health Equity Report to its membership on Wednesday morning.

MVC began developing metrics for its membership in this area over the past year so providers might better understand where inequities are materializing within the four walls of their hospitals and beyond. One popular method for identifying low-SES patients is by determining where someone lives and applying population-level metrics to the individual. Examples of this would be using the Area Deprivation Index (ADI) or Social Vulnerability Index (SVI). Both indexes are based on census tract data and provide SES characteristics about a population within a specific geographic location (i.e., a census tract), including risk factors such as poverty, education level, transportation access, and housing security. However, in developing the MVC Health Equity Report, the MVC Coordinating Center elected to utilize a patient-level metric of SES that is compatible with MVC claims data. As a result, the report identifies low-SES patients using dual-eligibility status.

Dual-eligible beneficiaries are patients that are eligible for both Medicare and Medicaid. In the MVC Health Equity Report, dual eligibility is defined as having been eligible for both Medicare and Medicaid at any point during the year of the index admission and is limited to patients that were at least 65 years old at the time of admission. Medicaid eligibility is a good indicator of SES when using claims data since it is income-based, and studies have shown that there is a strong association between low-income status and adverse health outcomes. Dual eligibility allows MVC analysts to identify Medicaid-eligible patients within its more extensive Medicare data set for analyses. Medicare data on the MVC registry currently includes claims data from 1/1/2015 through 9/30/2020. The resulting reports prepared for members focuses on episodes occurring between 2017 and 2020, or between 2017 and 2019 if the circumstances of 2020 resulted in unusual case counts by facility.

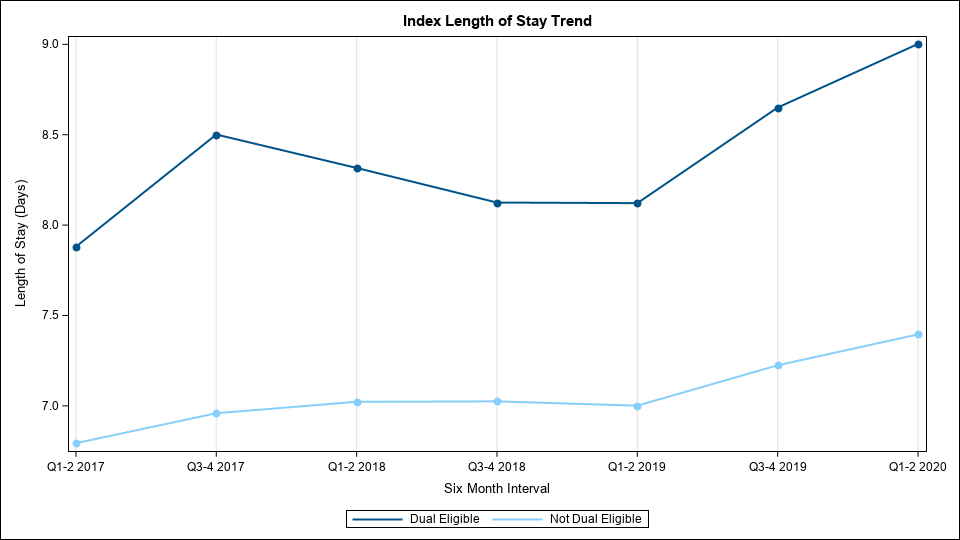
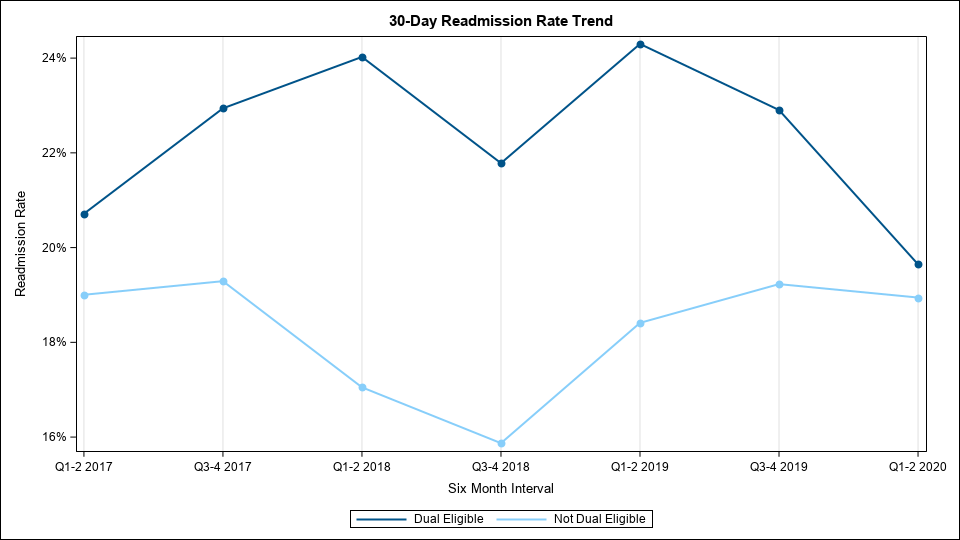
In developing this report, there was a conscious decision to exclude any sort of comparison group alongside each individual hospital's metrics. This is because the socioeconomic factors of a hospital’s patient population cannot be changed, and there is great diversity between hospitals throughout the state and within geographic regions. For those reasons, benchmarking was not the intention of this report. However, it is important to note that across the state, the data analyzed by the MVC Coordinating Center consistently indicates that dual-eligible patients have poorer outcomes than their non-dual-eligible counterparts, including longer lengths of stay, higher readmission rates, higher post-discharge emergency department utilization, lower rates of office visits post-discharge, higher rates of post-discharge outpatient procedures, and higher utilization of skilled nursing facilities. Blinded sample graphs for length of stay (Figure 1) and readmission rates (Figure 2) were created using data from three distinct, large hospitals in order to showcase some of these differences.

Figure 1.

Figure 2.

Members receiving reports will see a variety of graphs depicting, for example, total episode payment trends, 30-day readmission rate trends, and post-acute care utilization. Also provided is a table outlining a hospital or region’s highest volume of conditions within its dual-eligible population (see Figure 3 for a blinded sample). The purpose of this table is to help members better understand the proportion of dual-eligible patients at their hospital and the prevalence of various conditions within that population. It will also help members to better understand their report overall by identifying the conditions and procedures driving the various metrics included within it.

Figure 3.

MVC is eager to do more in this space in the months ahead. With the recently added Michigan Medicaid data on the MVC registry, the Coordinating Center has a new opportunity to more closely examine the types of disparities that are prevalent in healthcare. Additionally, with the addition of 13 rural or critical access hospitals to the collaborative in the past 12 months, the Coordinating Center aims to expand its metrics outside of the episode structure to examine population health metrics. This will allow for better understanding about healthcare delivery and how outcomes differ in rural regions compared to urban.

The MVC Coordinating Center wants to hear feedback from its members. With the addition of Medicaid data, we are working hard to develop more metrics and reports that focus on health equity. If you have any questions, comments, or suggestions, please contact the MVC Coordinating Center at michiganvaluecollabortative@gmail.com.