0
View Post
Members to Receive Refreshed Preoperative Testing Reports

Members to Receive Refreshed Preoperative Testing Reports

MVC hospital members will soon receive their second preoperative testing push report of 2023, providing an opportunity to benchmark progress on reducing low-value testing rates within their facility. MVC first introduced its preoperative testing push reports in 2021 to support members in reducing this low-value practice. Ordering these tests before low-risk elective and outpatient procedures often provides no clinical benefits to patients but is ordered regularly at hospitals across Michigan.

Similar to the report distributed earlier this year, members will continue to see their rates across various tests for three elective and outpatient procedures: laparoscopic cholecystectomy, laparoscopic inguinal hernia repair, and lumpectomy. Claims were evaluated in the 30 days before the procedures for the following common tests: electrocardiogram (ECGs), echocardiogram, cardiac stress test, complete blood count, basic and comprehensive metabolic panel, coagulation studies, urinalysis, chest x-ray, and pulmonary function with index admissions from 1/1/2021 through 12/31/2022. This refreshed push report exclusively utilizes claims from the Blue Cross Blue Shield of Michigan (BCBSM) and Blue Care Network (BCN) plans. Members will receive reports if they have at least 11 index admissions in one of the three conditions and at least 20 admissions across all three conditions during the reporting period.

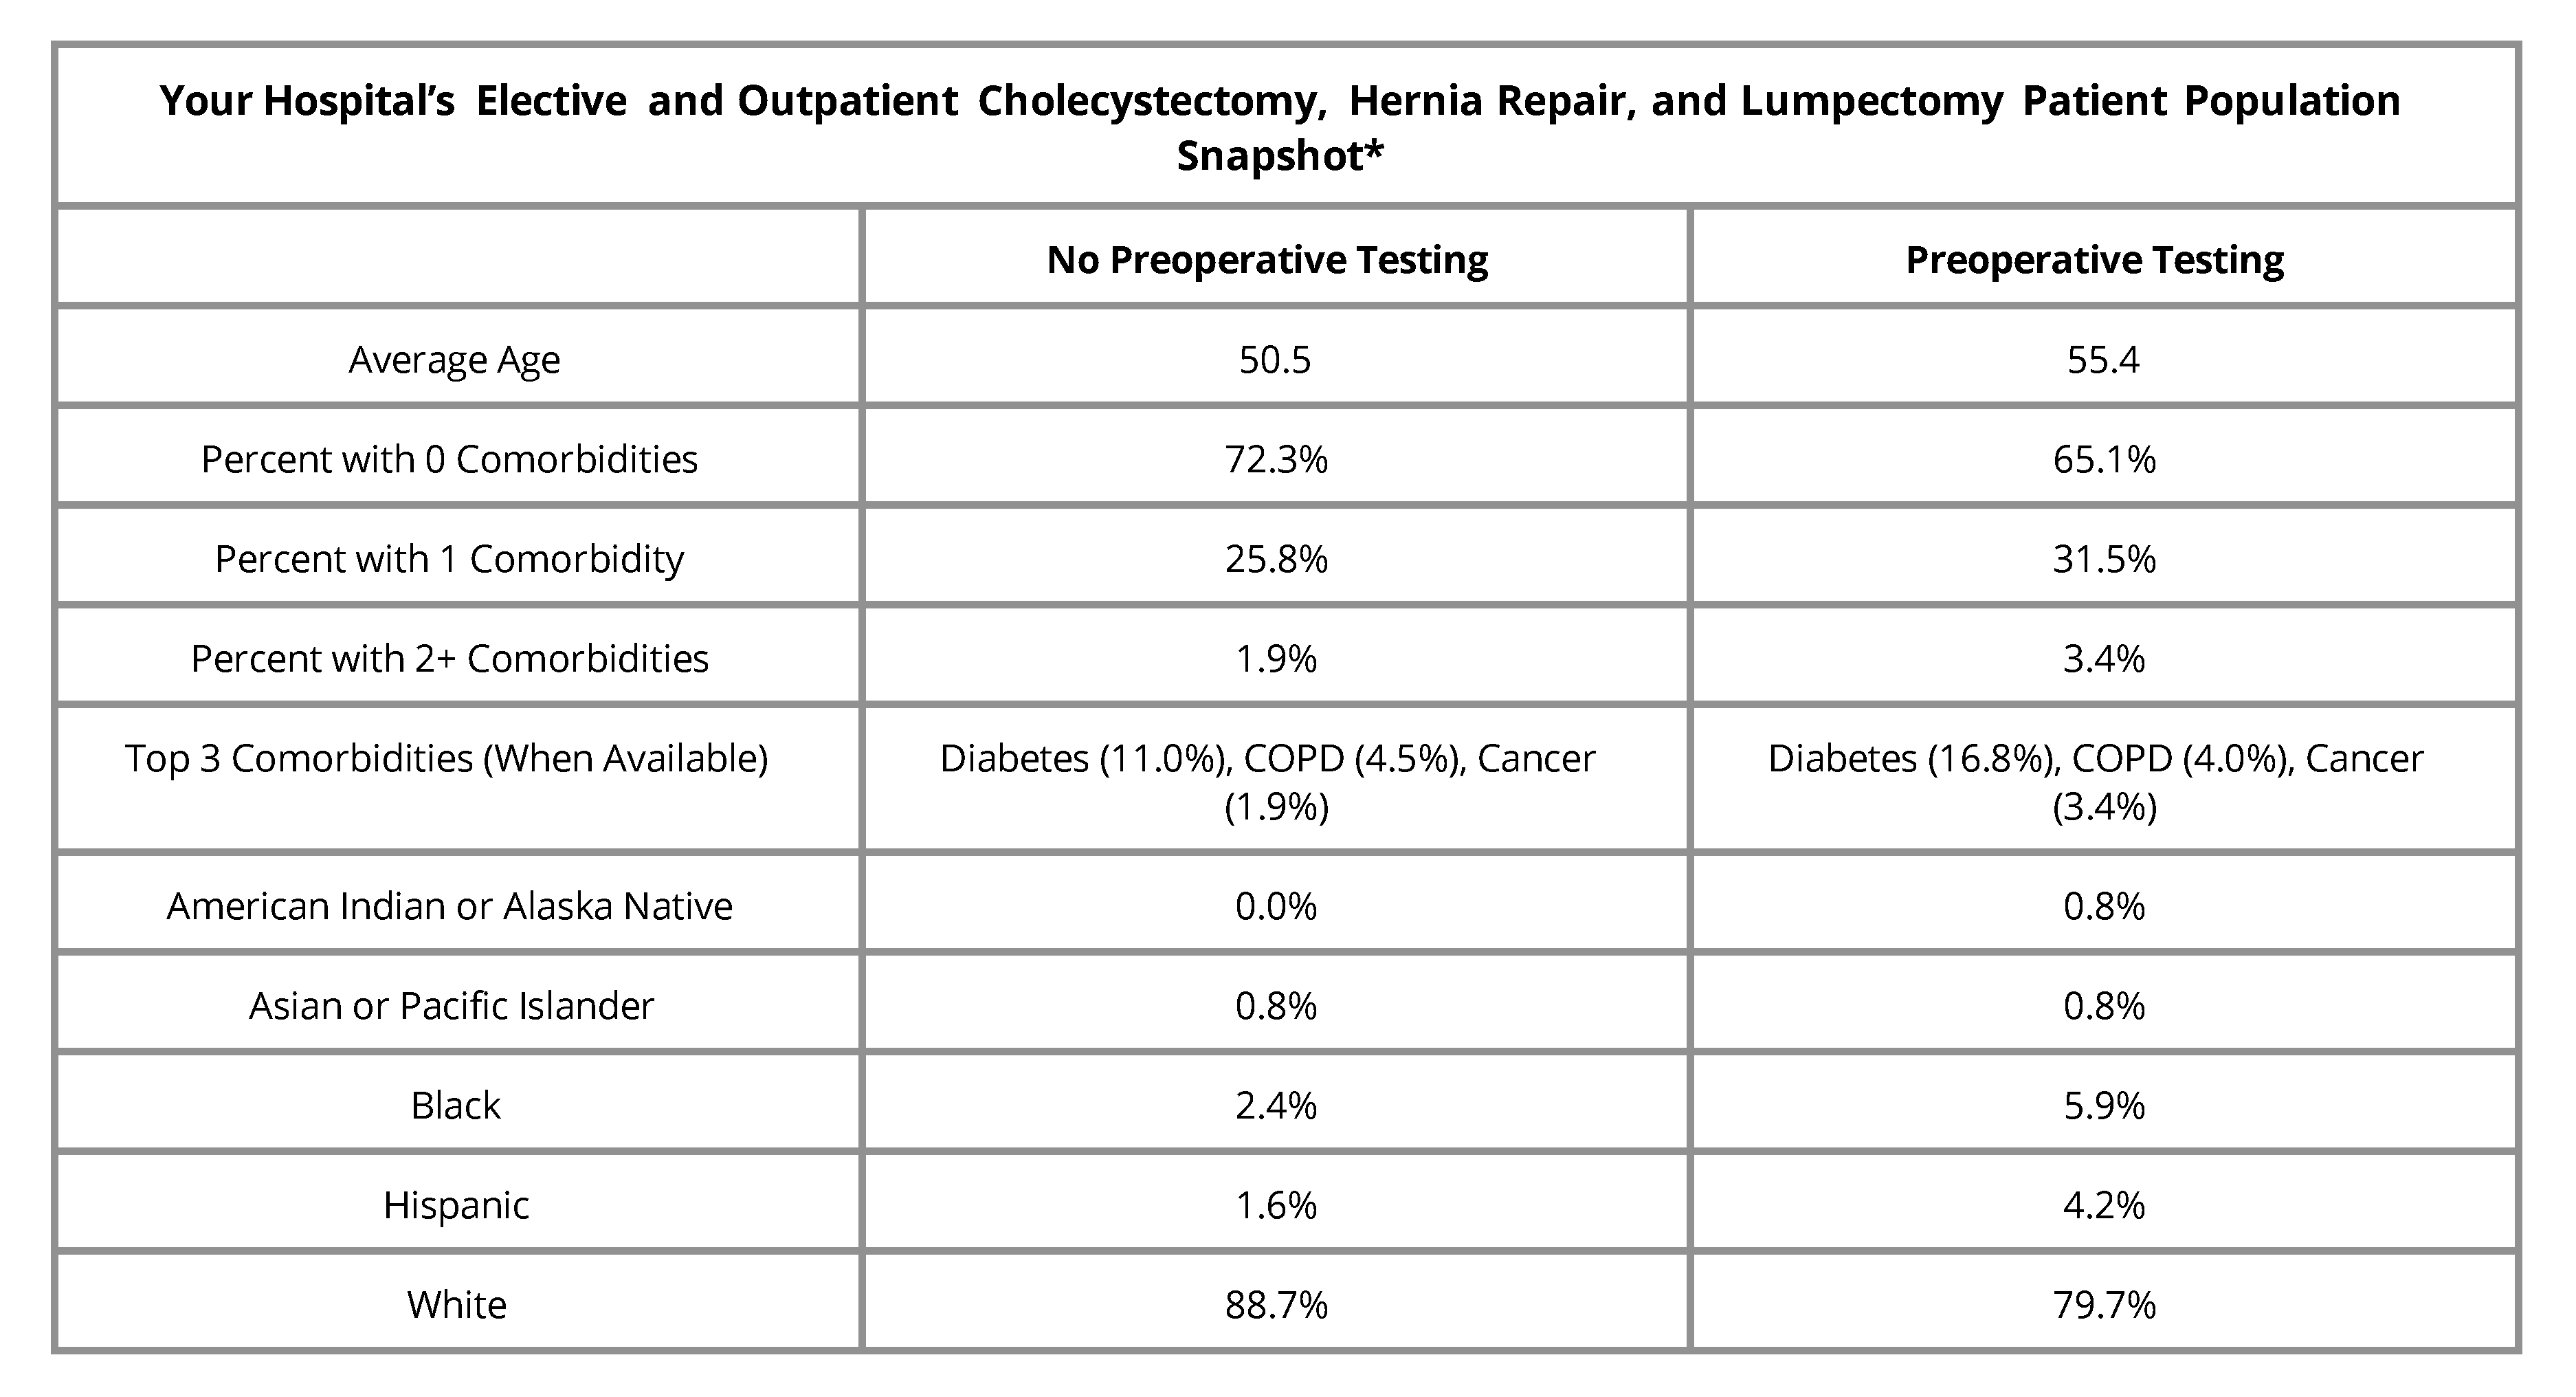
Like other MVC push reports, members will see a patient population snapshot table that identifies rates for preoperative testing and no preoperative testing in patients with varying demographic characteristics (Figure 1). Compared to the version received by hospitals this summer, the latest version of this report now also includes testing rates among patients who identified as Hispanic or American Indian/Alaska Native. On average, patients who had preoperative testing were older and had more than one comorbidity than patients who had no preoperative testing.

Figure 1.

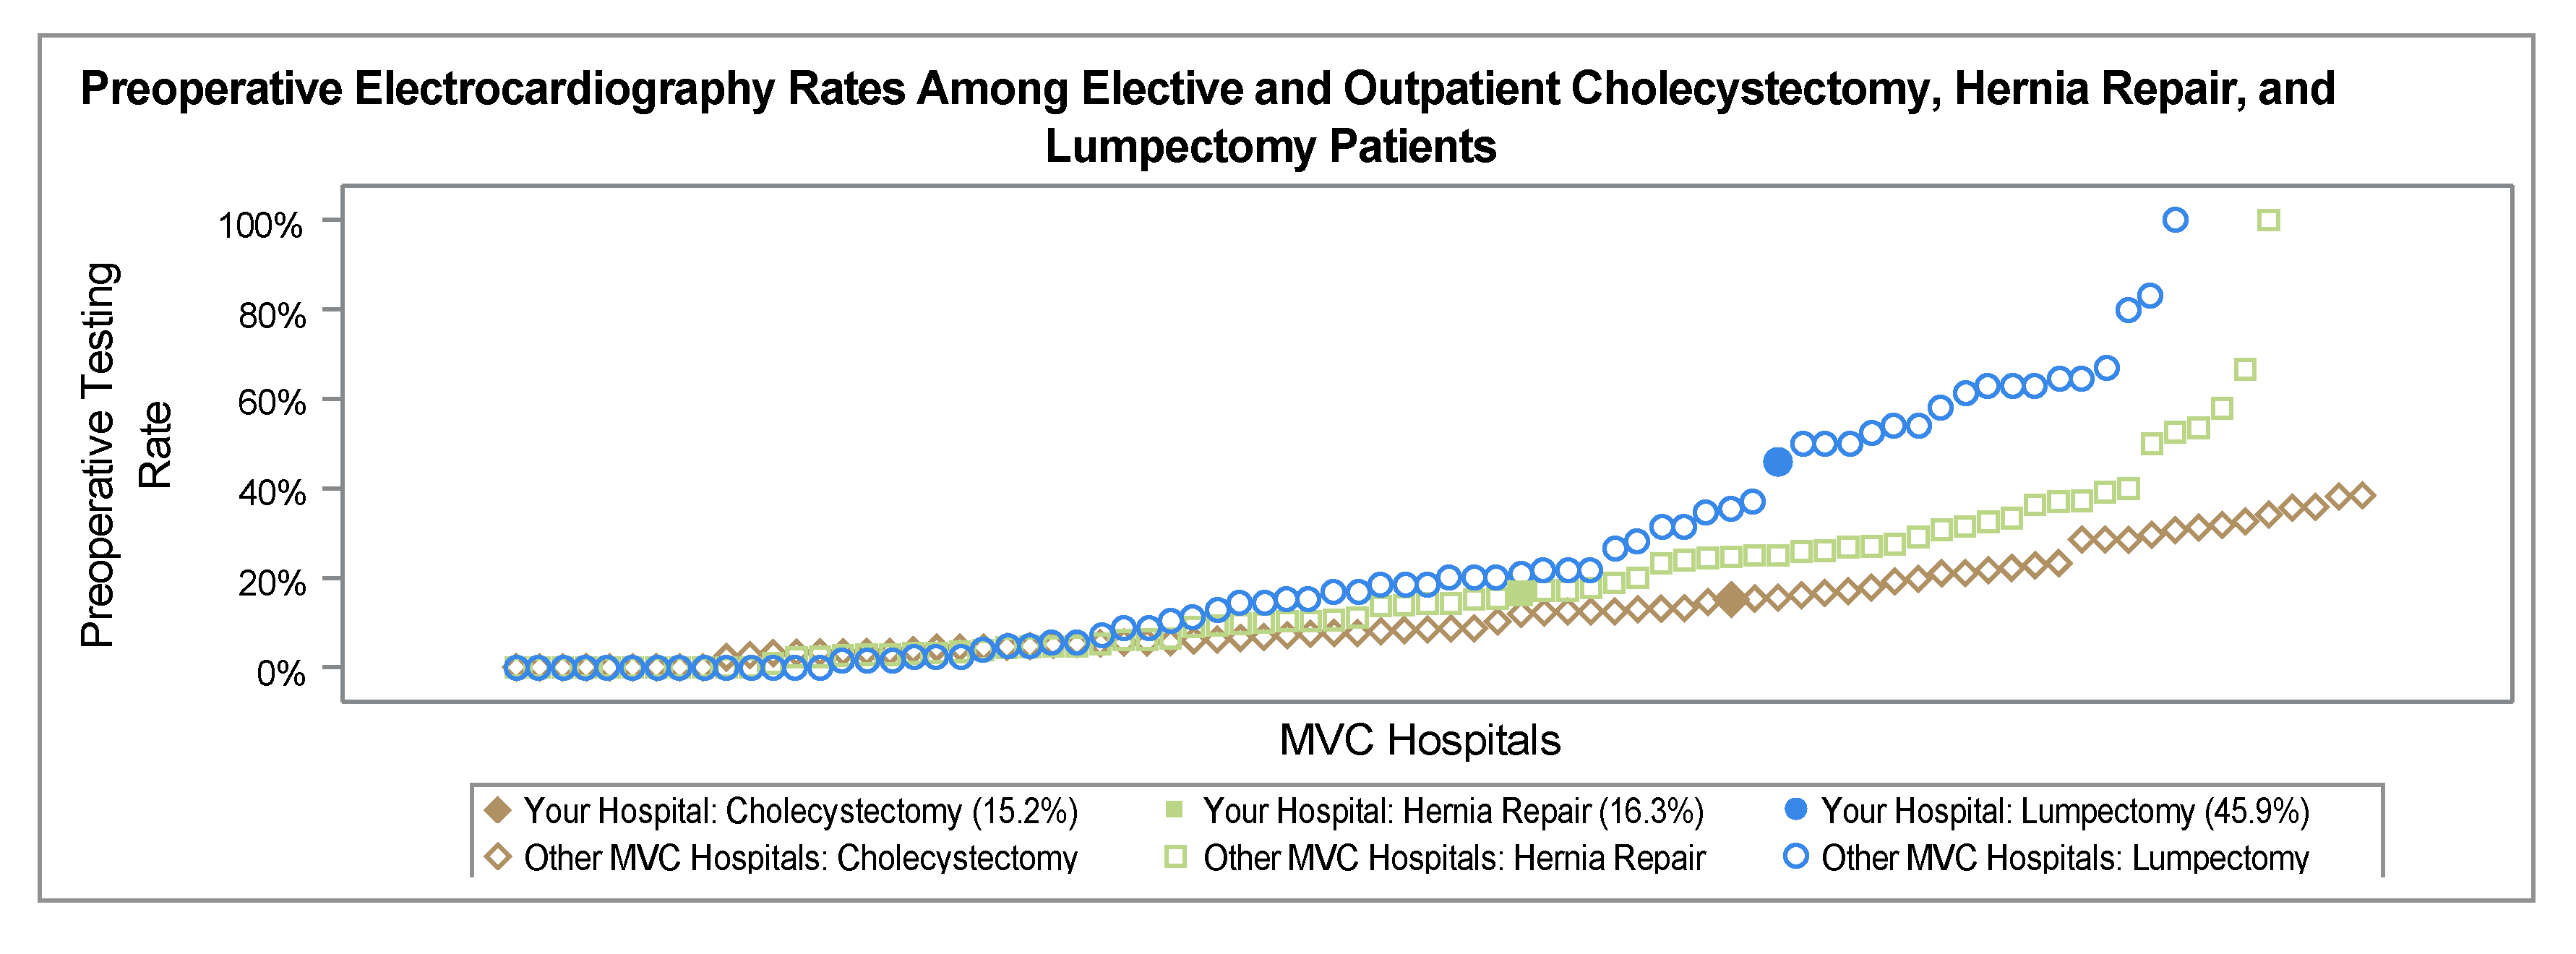
Members will see their average testing rate across all three procedures, as well as their rate for each specific procedure (Figure 2). A hospital’s combined rate can easily be compared with the average for that hospital’s geographic region within the state of Michigan as well as the collaborative-wide average. This figure showcases the wide variability across the collaborative in average testing rates across procedures—some in the collaborative have an average testing rate close to 10% and some nearly 100%.

Figure 2.

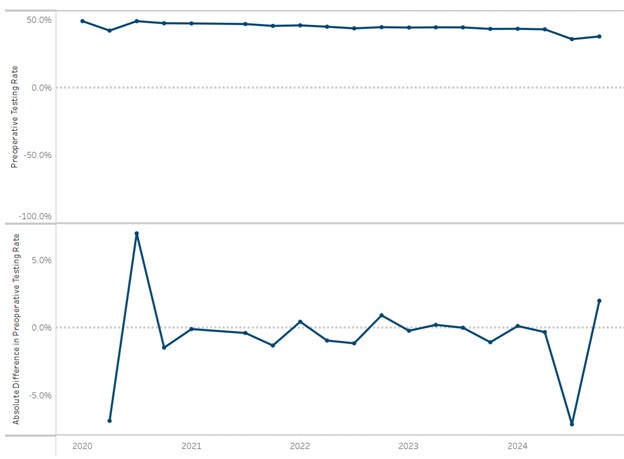
The next figure in the report showcases overall preoperative testing rates by six-month intervals for 2021 and 2022. It includes data points for the MVC average and regional comparison groups (Figure 3), with evidence of very little change in overall testing rates over time when looking at all three procedures combined.

Figure 3.

Although the overall rate across the collaborative has been steady, MVC has identified shifts in testing rates for individual members. To support members in tracking these changes, a caterpillar plot is also included that depicts the absolute change in any preoperative testing from 2021 to 2022 (Figure 4). Members can see the percentage change—positive or negative—in their annual testing rate from 2021 to 2022 for a specific procedure, as well as how their absolute change compares to the rest of the collaborative. This figure showcases that although the collaborative is not seeing much change in its overall rates for any testing over time, individual members might see greater variability over time for specific tests or procedures, especially in instances of low case counts. Overall, MVC observed slight reductions in the average collaborative-wide procedure-specific testing rates from 2021 to 2022 for all three surgical procedures, with the highest reduction observed among lumpectomy episodes (-6.2%).

Figure 4.

Members will also be able to take deeper dives into their rates for specific tests (Figure 5) in the figures that make up the remaining pages of the report. Viewing one’s preoperative testing rates for each specific test can help members understand if any specific tests are driving their overall testing rate or are ordered more frequently than the majority of their peers.

Figure 5.

MVC is eager to drive improvement in this area and encourages members to visit the Waive the Workup resource website developed in partnership with the Michigan Surgical Quality Collaborative (MSQC) and the Michigan Program on Value Enhancement (MPrOVE). If you are interested in a more customized report, please contact the MVC Coordinating Center at Michigan-Value-Collaborative@med.umich.edu.

0
View Post
MVC Calls Attention to Research, Resources During Week-Long Preoperative Testing Campaign

MVC Calls Attention to Research, Resources During Week-Long Preoperative Testing Campaign

Prior to surgery, most Michigan patients will undergo a series of tests, such as blood draws, urinalysis, chest x-rays, or electrocardiograms (ECGs/EKGs). Many of these tests are unnecessary for healthy patients undergoing low-risk procedures such as groin hernia repair. Routine preoperative testing is widely considered a low-value service, and yet a majority of hospitals continue to order these tests. In an effort to drive improvement in this area, MVC hosted its second annual preoperative testing awareness campaign this week.

“For a patient, it is key they get the right amount of preoperative assessment,” said Dr. Michael Englesbe, professor of surgery at the University of Michigan, director of the Blue Cross Blue Shield of Michigan-funded Collaborative Quality Initiatives, director of the Michigan Surgical Quality Collaborative (MSQC), and co-director of the Michigan Opioid Prescribing and Engagement Network (Michigan OPEN). “Too little testing and important risks may be missed, too much and patients may be exposed to critical risks of unnecessary testing and delays in care.”

MVC’s Coordinating Center supports preoperative testing de-implementation in several ways. One is providing opportunities for MVC’s members to collaborate and learn from one another. This year MVC launched a workgroup series focused on preoperative testing, the first of which took place in March. As part of its campaign this week, MVC promoted the next session in this workgroup series, set to take place Tues., Aug. 1, from 1-2 p.m. featuring guest speaker Nick Berlin, MD, MPH, MS. Those interested in this topic should register to attend here.

Another key strategy MVC uses to support preoperative testing de-implementation is through data analysis and reporting. MVC analysts utilize administrative claims data to calculate testing rates in the preoperative period, and then share these results with members as reports or as unblinded data at collaborative-wide meetings. More recently, MVC partnered with MSQC to distribute these reports more widely to support cross-collaboration between clinical and quality personnel at a given site.

These reports are an invaluable resource in benchmarking the extent of the issue statewide, says Dr. Hari Nathan, MVC’s director and the chief of hepato-pancreato-biliary surgery at Michigan Medicine. “MVC data can be used by hospitals and providers to understand how their rates of preoperative testing compare to those of other hospitals in Michigan,” he said. “By focusing on a homogeneous cohort of healthy patients undergoing common, low-risk surgical procedures, MVC benchmarks can help all hospitals understand where they have an opportunity to improve, regardless of facility size, resources, or patient population.”

Across the collaborative, MVC sees wide variation in preoperative testing for low-risk elective surgeries like hernia repairs and lumpectomies, with testing rates among young, healthy patients ranging from 10% to 97% across MVC hospitals. This level of interhospital variation is evidence that many hospitals in Michigan are safely performing low-risk surgeries without widespread preoperative testing and that even those hospitals with average rates likely have room to safely reduce their testing further.

MVC also sees quite a bit of intrahospital variation, with certain surgeries driving the overall preoperative testing rate at a given site. Based on the findings of its latest report, one potential area of focus for sites may be reducing the rate of cardiac testing; the rate of ECGs is quite variable across the collaborative and could lead to a cascade of care.

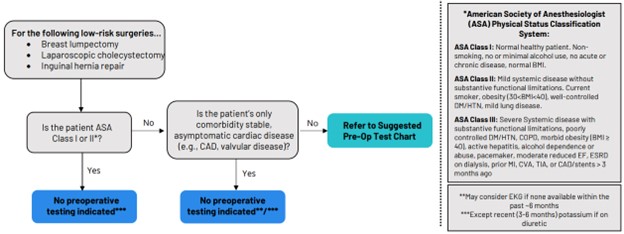
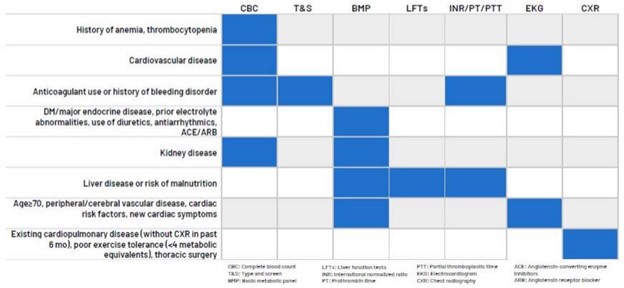
MVC shared its refreshed preoperative testing push report with members in April and also held a report review webinar in June to review the measures included. This webinar also included advice from Dr. Nathan about how to take action using this data. Dr. Nathan promoted several new resources developed in partnership by MSQC, the Michigan Program on Value Enhancement (MPrOVE), and MVC. These include a customizable decision aid (Figure 1), which sites can download to add their branding or modify. It is accompanied by a similarly customizable preoperative testing reference chart (Figure 2).

Figure 1.

Figure 2.

Both of these resources are currently housed on a new Waive the Workup de-implementation resource website managed by MPrOVE, MSQC, and MVC. In addition to pages for the decision aid and chart, the site also offers talking points for debunking common myths about preoperative testing. For instance, one common counterargument to reducing preoperative testing prior to low-risk surgery is a perception that there’s no harm in ordering them, either because they are relatively inexpensive or because they are not invasive tests.

On the contrary, research has established substantial financial costs and risks to patient harm because of preoperative testing, which can and should be safely reduced. Mihir Surapaneni, BBA, a medical student at the University of Michigan Medical School, has been conducting research with MVC on preoperative testing and its impact. “One of the major theories for why there’s so much variability—and indeed just a high utilization rate—for preoperative testing is that there’s no perceived downside,” Surapaneni said. “Many of these tests are relatively cheap compared to the total cost of healthcare and indeed most of them cost no more to the patient than a stick of blood, but we really have to consider that there are costs. Preoperative testing costs billions of dollars in the United States healthcare system annually, and when you consider how strained the healthcare system is and how much of an onus there is on payers and the government to decrease costs, this really adds up. And secondly, we have to consider the possibility of testing cascades—which has been well-documented—in that a patient comes in having an abnormal lab value or test that actually had nothing to do with their intended surgery, and this leads to more and more tests which are expensive and potentially invasive. And finally, we have to consider that there’s established literature showing that even when an abnormality is found in a routine preoperative test, these abnormalities: 1) rarely impact the clinical course of the patient, and 2) rarely lead to actual substantive change in that patient’s care. And I think that we really have to consider these when we’re deciding whether or not we want to test our patients routinely.”

In addition to registering for the Aug. 1 workgroup, MVC has a third preoperative testing workgroup session scheduled for Oct. 26, 11 a.m. - 12 p.m. The Oct. session will be a forum for sharing current successes or initiatives underway across the collaborative. If your hospital has a current initiative underway on preoperative testing de-implementation or has a low average testing rate, MVC would love to learn from you. Please reach out to the MVC team if you’d be interested in sharing your site’s story on Oct. 26.

0
View Post
Latest MVC Push Reports and Resources Draw Attention to Low-Value Preoperative Testing

Latest MVC Push Reports and Resources Draw Attention to Low-Value Preoperative Testing

This week MVC distributed its first of two preoperative testing push reports of 2023, providing members with an opportunity to benchmark their testing practices. MVC first introduced its preoperative testing push reports in 2021 to help members reduce the use of unnecessary testing for surgical procedures. Preoperative testing for low-risk surgeries, especially for young and healthy patients, often provides no clinical benefits yet is ordered regularly at hospitals across Michigan.

The report distributed this week had many similarities to versions distributed last year, namely that members continued to see their rates across a variety of tests for three elective, low-risk procedures performed in outpatient settings: laparoscopic cholecystectomy, laparoscopic inguinal hernia repair, and lumpectomy. Claims were evaluated for the index event as well as 30 days prior to the procedures for the following common tests: electrocardiogram (ECGs), echocardiogram, cardiac stress test, complete blood count, basic metabolic panel, coagulation studies, urinalysis, chest x-ray, and pulmonary function.

The latest report utilizes claims from Blue Cross Blue Shield of Michigan (BCBSM) and Blue Care Network (BCN) plans exclusively, including both the commercial and Medicare Advantage plans. This allows members to see MVC’s most up-to-date data, which includes episodes with index admissions from 7/1/2020 through 6/30/2022. Members only received reports if they had 11 or more cases in at least one of the three conditions and at least 20 cases across all three conditions.

The reports received by members this week included a patient snapshot table that defined rates for preoperative testing and no preoperative testing in patients of varying races as well as those with zero, one, or two or more comorbidities. Generally speaking, patients with no comorbidities were more likely to have no preoperative testing than patients with one or more comorbidities. There were also observed differences in testing by age; patients who had preoperative testing were older on average than patients who had no preoperative testing.

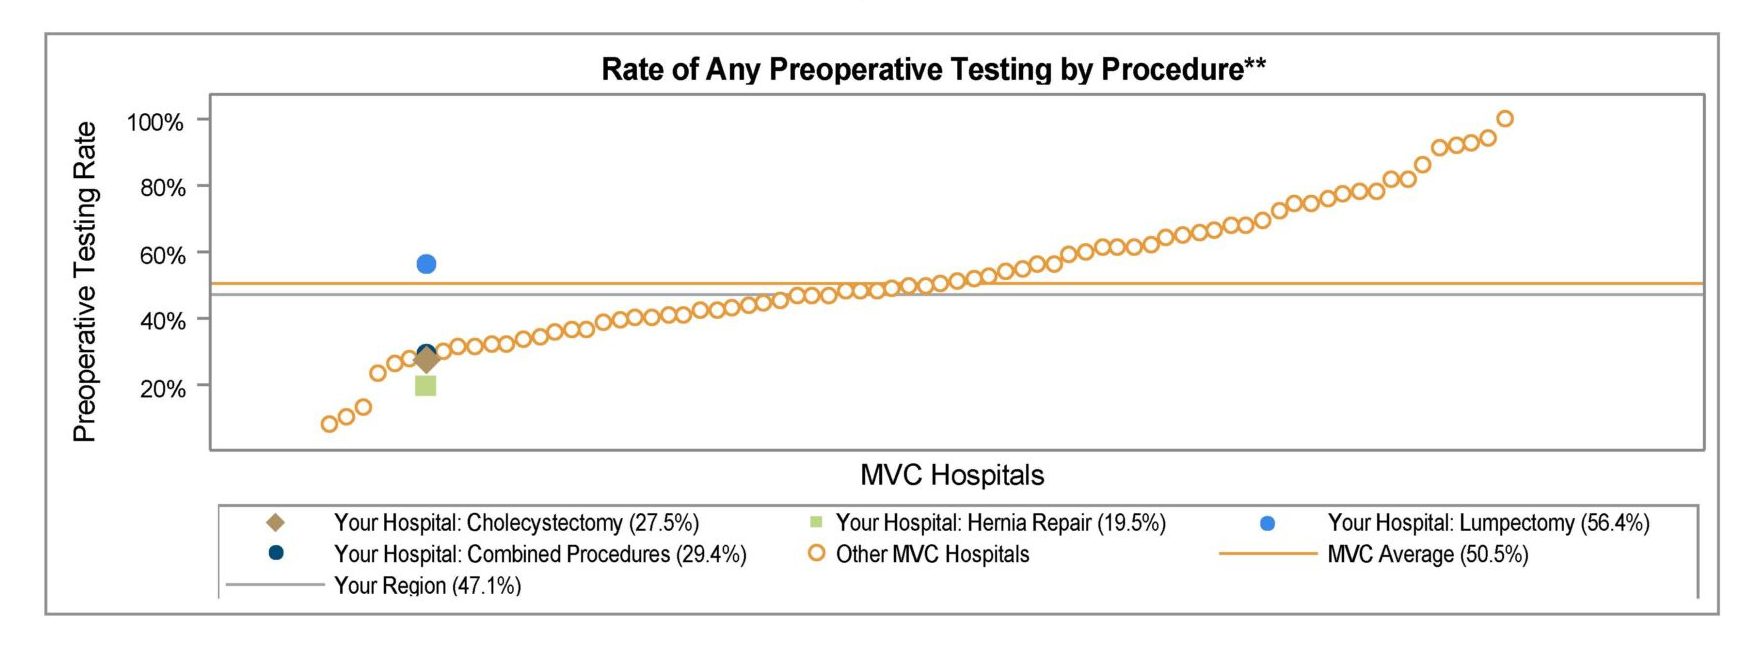
A key finding in the report is the average testing rate for all three procedures combined for the entire collaborative, which continues to showcase the wide variability across hospitals in Michigan. Some in the collaborative have an average testing rate close to 10% and some nearly 100% (Figure 1). Individual hospitals receiving a report will see on this figure where they fall compared to other hospitals in the collaborative, as well as their average rate for the three separate procedures to help deduce which procedure is driving their average rate.

Figure 1.

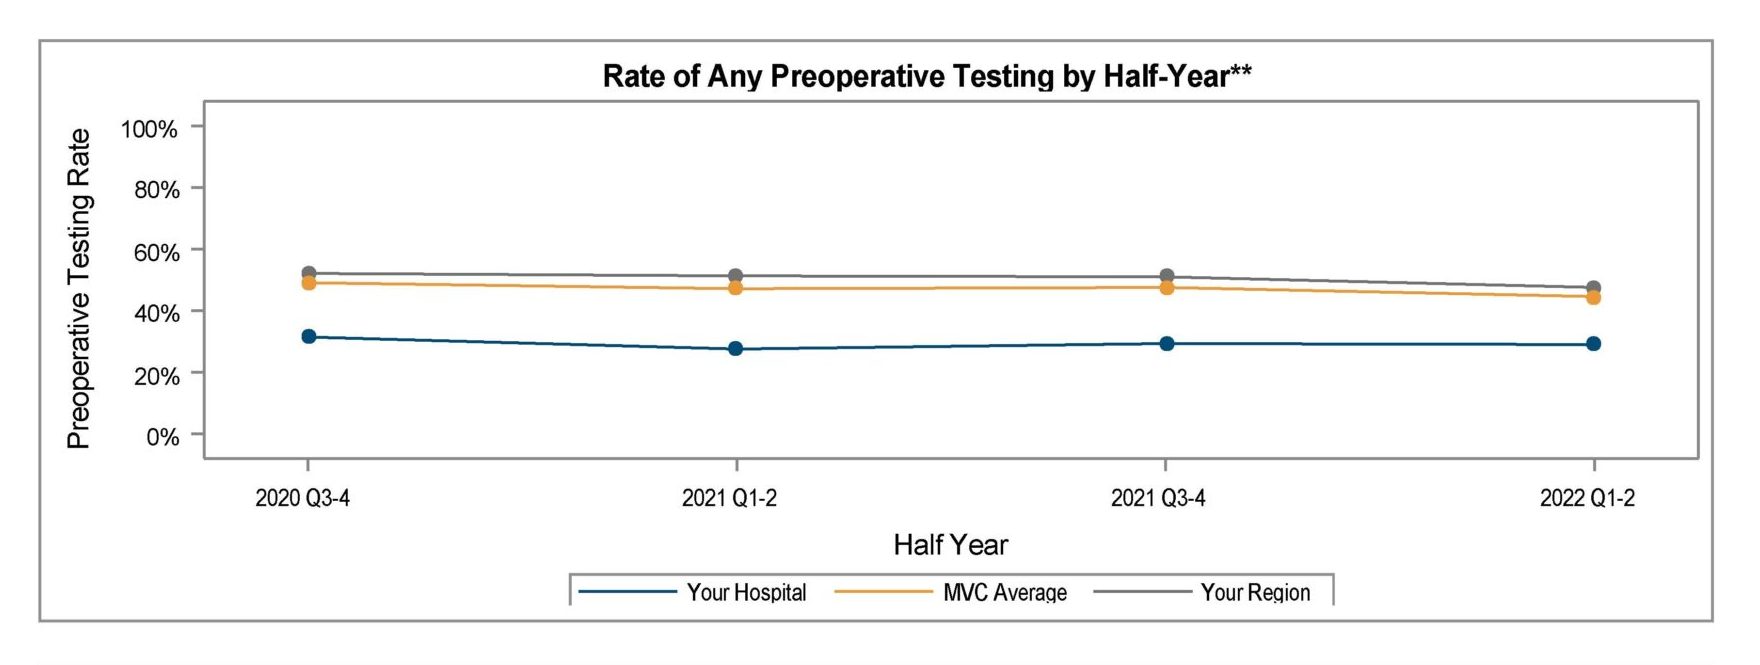
Another trend that continued in this April 2023 report is the consistency of average testing rates for combined procedures over time. A trend graph showed members how their overall rate for any preoperative testing compared in 2020, 2021, and the first half of 2022, with data points for their hospital, the MVC average, and their regional comparison group (Figure 2). There continues to be very little change in testing rates over time when looking at aggregated preoperative testing practices. The prevalence of low-value preoperative testing has remained high on average across the collaborative for three years and likely longer.

Figure 2.

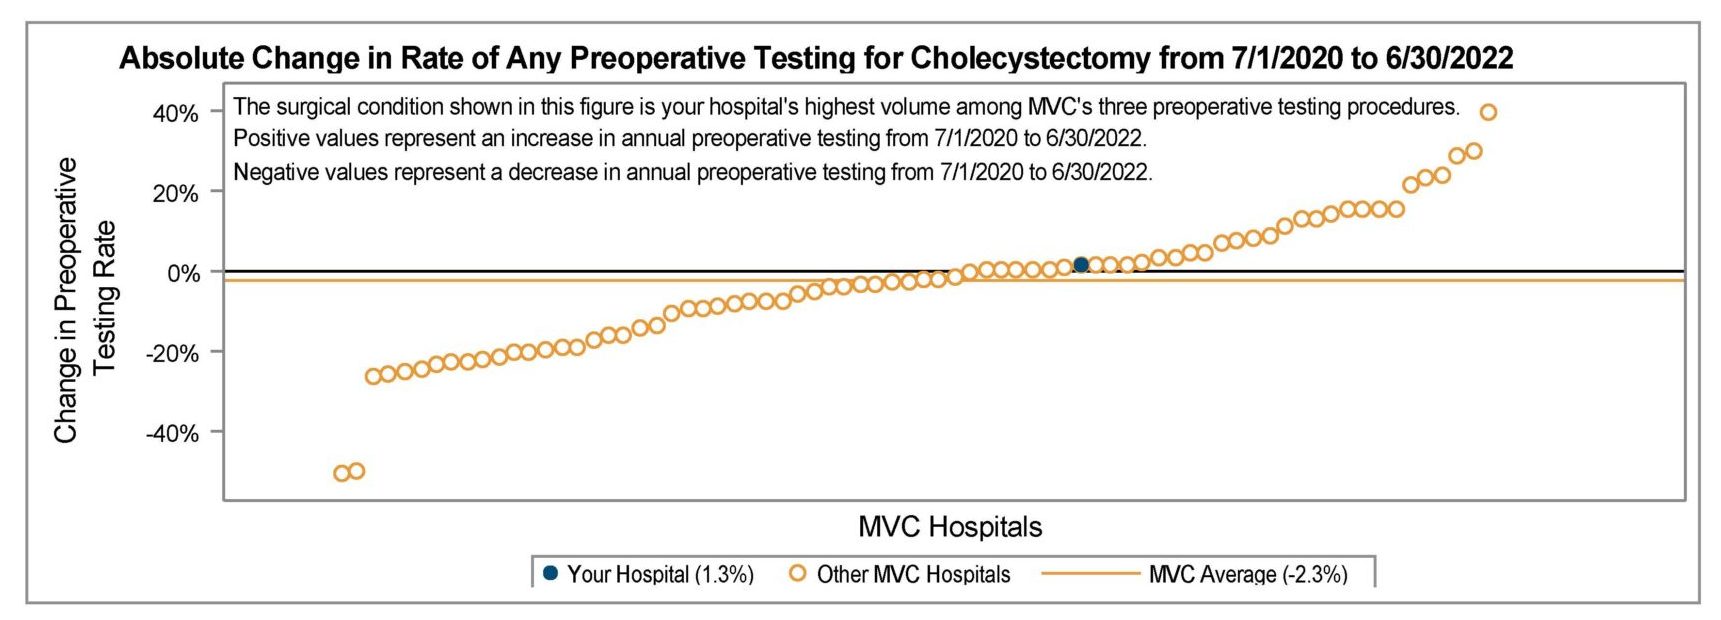
A third figure included in this report shows the absolute change in the rate of any preoperative testing for their hospital’s highest volume surgical condition among laparoscopic cholecystectomy, laparoscopic inguinal hernia repair, and lumpectomy (Figure 3). In this figure, positive values represent an increase in annual preoperative testing from 7/1/2020 to 6/30/2022, and negative values represent a decrease. The MVC average for this metric was -2.3%, so there was a small net decrease in the average rate of any testing in that time period. Once again, the variation across the collaborative was notable, with some hospitals seeing greater than 40% swings in either direction – though some sites may see drastic changes to their rates if case counts are smaller.

Figure 3.

The remaining figures in the report provide preoperative testing rates for specific types of tests, with caterpillar plots for each condition to help benchmark performance to other hospitals across the state. The types of tests with the highest average testing rates across conditions are blood tests—which include complete blood count, basic metabolic panel, and coagulation tests—and electrocardiography tests. For a majority of hospitals, their testing rates are highest within the lumpectomy patient population regardless of test type, with the exception of urinalysis testing rates that are heavily driven by the cholecystectomy population.

The last time MVC shared preoperative testing reports was in July 2022, and since then MVC contributed to and launched resources to help healthcare providers implement changes. MVC members now have access to a sample preoperative testing decision aid for low-risk surgeries, developed in partnership with the Michigan Surgical Quality Collaborative (MSQC) and the Michigan Program on Value Enhancement (MPrOVE), and MVC (Figure 4). The decision aid also comes with a supplemental suggested preoperative testing chart that identifies which tests are recommended for patients who are classified by the American Society of Anesthesiologists (ASA) as Class III or above and undergoing low-risk surgery (Figure 5). Both resources are intended as guides and can be downloaded in their original file formats so hospitals may edit and adapt them within their institution. These resources were developed with input from one institution’s surgery, anesthesiology, and preoperative clinic teams, and based on clinical recommendations put forth by a number of professional societies.

Figure 4.

Figure 5.

These resources were added to a new resource website developed in partnership with MPrOVE, MSQC, and MVC. The goal of the site is to help providers safely “waive the workup” by providing the latest research, national recommendations, arguments against common myths, and frequently asked questions.

In addition, the MVC team is holding several workgroups in 2023 dedicated to preoperative testing. The first took place on March 15 and was heavily attended by MSQC and MVC members working to reduce preoperative testing as part of their P4P programs. A full recording of the workgroup is available here. MVC also has a preoperative testing workgroup scheduled for August 1, from 1-2 p.m., featuring guest presenter Nick Berlin, MD, MPH, MS, who has published several papers on patterns and determinants of low-value preoperative testing. A third preoperative testing workgroup is tentatively scheduled for October 26, from 11 a.m. to 12 p.m. Sites are encouraged to attend these events in order to learn best practices and collaborate with peers on common barriers.

For additional analysis or consultation on your hospital’s preoperative testing rates or practices, reach out to the MVC team for assistance at Michigan-Value-Collaborative@med.umich.edu.

0
View Post
Follow-Up After CHF, Cardiac Rehab Top New Value Metric Selections for P4P PYs 24-25

Follow-Up After CHF, Cardiac Rehab Top New Value Metric Selections for P4P PYs 24-25

In the final months of 2022, the MVC team distributed metric selection reports for Program Years 2024 and 2025 of the MVC Component of the Blue Cross Blue Shield of Michigan (BCBSM) Pay-for-Performance (P4P) Program. These reports were provided in conjunction with details pertaining to the selection process as well as changes to the program structure, scoring methodology, and cohort assignments for the upcoming two-year cycle.

Eligible hospital members were tasked with reviewing these reports and returning their selections in recent months. MVC has now received metric selections for PYs 2024 and 2025. This program cycle will award a maximum score of 10 points, made up of a maximum of four points from an episode spending metric, a maximum of four points from a value metric (a new component), and a maximum of two points from engagement activities completed in the program year (the calendar year following the performance year). Each participating hospital selected one of the six available conditions for the 30-day episode payment component: chronic obstructive pulmonary disease (COPD), colectomy (non-cancer), congestive heart failure (CHF), coronary artery bypass graft (CABG), joint replacement, and pneumonia. The episode spending metric that the most hospitals selected was joint replacement (32), followed by CHF (20). No sites selected colectomy. See Figure 1 for a depiction of the total selections for each condition.

Figure 1.

The distribution in episode spending selections was consistent when stratified by MVC region of Michigan; joint replacement was the top choice within all four MVC regions, and CHF was generally the next most common. However, Region 1 (which constitutes Northern Michigan) had a smaller percentage of sites select CHF, with a slight preference for pneumonia. In addition, hospitals located in Region 4 (southeast Michigan) were more likely to select COPD (Figure 2).

Figure 2.

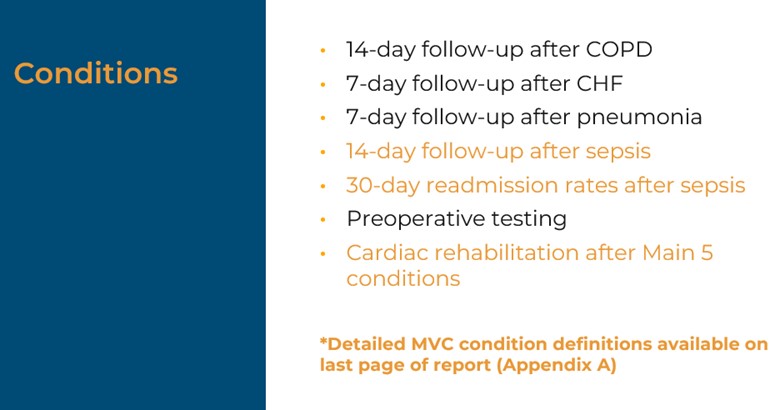
Brand new in PYs 2024-2025 will be value metrics, which are evidence-based, actionable measures with variability across the state. Hospitals will be rewarded for high rates of high-value services or low rates of low-value services. Seven value metrics were available for hospitals to choose from: cardiac rehabilitation after CABG, cardiac rehabilitation after percutaneous coronary intervention (PCI), seven-day follow-up after CHF, 14-day follow-up after COPD, seven-day follow-up after pneumonia, preoperative testing, and risk-adjusted readmission after sepsis. The preoperative testing value metric is composed of a group of three low-risk procedures: cholecystectomy, hernia repair, and lumpectomy. Each preoperative testing procedure will be scored separately, and points for that value metric will be awarded based on the highest points achieved for a hospital’s eligible procedures.

In its first year offering a value metric, MVC found that seven-day follow-up after CHF was selected by the most participants (25). Metrics related to cardiac rehabilitation participation accounted for 23 selections; 17 sites selected cardiac rehabilitation after PCI and five selected cardiac rehabilitation after CABG (Figure 3).

Figure 3.

There was more variation by MVC region for value metric selections than for episode spending selections (Figure 4). In Region 1 (Northern Michigan), seven-day follow-up after pneumonia was the most common selection. Nearly all the sites located in Region 2 (west Michigan) selected seven-day follow-up after CHF—this metric accounted for 71% of selections in this part of the state. Region 3 (mid-Michigan and the thumb region) had more sites select risk-adjusted readmission after sepsis, but Region 3 had a more even distribution of selections across the available metrics than Regions 1 or 2. Finally, Region 4 (southeast Michigan) had selections for all the available value metrics. Region 4 also had the most interest in 14-day follow-up after COPD.

Figure 4.

Two of MVC’s new value metrics align with existing value campaigns for which MVC is offering additional support. MVC established campaigns for both cardiac rehabilitation and preoperative testing in October 2020. Since then, MVC has developed reports on these two areas of healthcare utilization, which have historically been shared biannually. In addition, beginning in 2023, MVC is offering workgroups tailored to these value metrics. MVC’s first cardiac rehabilitation workgroup of 2023 took place on Feb. 16 during cardiac rehabilitation week featuring guest presentations by Haley Stolp of Million Hearts and Mike Thompson, PhD, MPH, Co-Director of MVC and Co-Director of the Michigan Cardiac Rehabilitation Network. A full recording of this session is available here. MVC’s first preoperative testing workgroup of 2023 will take place next week on Wed., March 15, from 1-2 p.m., featuring MVC Director Hari Nathan, MD, PhD. Those interested in learning about ready-to-use tools and strategies for the de-implementation of low-value testing may register here. Attending hospital sites will be encouraged to share their experience thus far with quality improvement related to preoperative testing, such as resources in use or in development and common barriers to change.

P4P cohorts were reassigned for PYs 2024 and 2025. Those cohort assignments and the new technical document have been published on the MVC website’s P4P page. The cohorts were not intended to group hospitals that are exactly alike; rather, they create a reasonably comparable grouping from which MVC can complete statistical analyses.

MVC’s P4P measure began in 2018 when BCBSM allocated 10% of its P4P program to an episode of care spending metric based on MVC data. If you would like to receive notices about the MVC workgroups or have questions about any aspect of the MVC Component of the BCBSM P4P Program, please contact the MVC Coordinating Center at Michigan-Value-Collaborative@med.umich.edu.

0
View Post
PY 2024-2025 Selection Reports Sent for MVC Component of BCBSM P4P Program

PY 2024-2025 Selection Reports Sent for MVC Component of BCBSM P4P Program

Beginning in 2018, Blue Cross Blue Shield of Michigan (BCBSM) allocated 10% of its Pay-For-Performance (P4P) Program to a metric based on Michigan Value Collaborative (MVC) claims data. In 2022, the BCBSM P4P Quarterly Workgroup approved changes to how hospitals are evaluated in future program cycles. The upcoming two-year cycle including Program Years (PYs) 2024 and 2025 will be the first impacted by these changes, with performance years in 2023 and 2024, respectively (see Figure 1). Hospitals received selection reports for the next cycle this week to aid in their decision-making on metrics within the new program structure.

Figure 1.

What is staying the same?

The program will continue to be scored out of 10 points maximum, and hospitals will continue to be evaluated on their risk-adjusted, price-standardized total episode payment, though this will make up a smaller component of the overall program. In addition, most conditions hospitals could select previously for episode payment scoring will still be available for that component of the program. Those include chronic obstructive pulmonary disease (COPD), colectomy (non-cancer), congestive heart failure (CHF), coronary artery bypass grafting (CABG), joint replacement, and pneumonia. Additionally, a hospital’s metric selections will continue to be scored on improvement compared to the hospital’s own past performance and scored on achievement related to an MVC cohort. Each hospital will continue to be awarded the greater of the two scores, either improvement or achievement, which are calculated using Z-scores. Cohort designation is still based on bed size, critical access status, and case mix index.

What is changing?

The PY 2022-2023 program was scored out of 10 points, but 12 points could be earned (10 points from episode spending plus two bonus points). In PYs 2024-2025, the overall program structure (Figure 2) will change so that the maximum score will be 10 points, made up of a maximum of four points from an episode spending metric, a maximum of four points from a value metric (a new component), and a maximum of two points from engagement activities completed in the program year (the calendar year following the performance year). This means that rather than selecting two conditions as in previous program cycles, hospitals will now select one condition for the episode spending metric and select one value metric. In order to be eligible to select a payment condition or value metric, a hospital must be projected to have at least 20 cases in the full baseline year of 2021. No bonus points will be available for PYs 2024-2025.

Figure 2.

Brand new in PYs 2024-2025 will be value metrics, which are evidence-based, actionable measures that show variability across the state. Hospitals will be rewarded for high rates of high-value services or low rates of low-value services. Seven value metrics are available for hospitals to choose from: cardiac rehabilitation after CABG, cardiac rehabilitation after percutaneous coronary intervention (PCI), seven-day follow-up after CHF, 14-day follow-up after COPD, seven-day follow-up after pneumonia, preoperative testing, and risk-adjusted readmission after sepsis. The preoperative testing value metric is composed of a group of three low-risk procedures: cholecystectomy, hernia repair, and lumpectomy. Each procedure will be scored separately, and points for this value metric will be awarded based on the highest points achieved for a hospital’s eligible procedures.

Finally, engagement in MVC activities will be built into the program’s scoring structure, rather than being offered as “bonus” points. Hospitals will be eligible to earn up to two points by attending and participating in MVC activities throughout each program year. These points are intended to increase engagement with other hospitals and the MVC Coordinating Center. Hospitals may select their own combination of activities but must include at least one activity from each of the attendance and participation categories to earn any points.

The P4P selection reports distributed this week include tables for the various episode spending and value metrics that identify projected case counts, the hospital’s average payment or rate of utilization, the cohort and MVC All average payments or rates, and the projected changes necessary for the hospital to earn 1 – 4 points. Accompanying the reports was an interpretation guide to walk recipients through a blinded sample report. It includes guidance on how to interpret the tables with suggestions for how this data could be used to inform a hospital’s P4P selections. The guide can be viewed here.

A complete summary of changes to PYs 2024 and 2025 is available here. These changes will not be retroactively applied to PYs 2022-2023. For complete details about PYs 2024-2025, please refer to the P4P Technical Document. Contact the MVC Coordinating Center with any questions. MVC requests that member hospitals complete and submit their PY 2024-2025 selections by December 23, 2022.

0
View Post
Latest MVC Preop Testing Report Features New Figures and Data

Latest MVC Preop Testing Report Features New Figures and Data

This week MVC distributed its second preoperative testing push report of 2022, providing members with another opportunity to benchmark their testing practices. MVC first introduced its preoperative testing push reports in 2021 to help members reduce the use of unnecessary testing for surgical procedures. Preoperative testing, especially for low-risk surgeries, often provides no clinical benefits to patients but is ordered regularly at hospitals across Michigan.

The report distributed this week had many similarities to the version distributed earlier this year in April, namely that members continued to see their rates across a variety of tests for three elective, low-risk procedures performed in outpatient settings: laparoscopic cholecystectomy, laparoscopic inguinal hernia repair, and lumpectomy. Claims were evaluated for the index event as well as 30 days prior to the procedures for the following common tests: electrocardiogram (ECGs), echocardiogram, cardiac stress test, complete blood count, basic metabolic panel, coagulation studies, urinalysis, chest x-ray, and pulmonary function.

The latest report has a few key differences from the spring version, the most significant of which is that it utilizes claims from Blue Cross Blue Shield of Michigan (BCBSM) and Blue Care Network (BCN) plans exclusively. This allows members to see MVC’s most up-to-date data; the report includes index admissions from 1/1/2019 through 12/31/2021. In addition, since the report contains BCBSM/BCN data only, there is no case count suppression, whereas members would only see their data in the spring version if they had at least 11 cases in each year of data for the three combined conditions.

The reports received by members this week included several new figures. Similar to other MVC push reports, members will now see a patient snapshot table that provides additional information about the report’s patient population. For this, MVC chose to include patient characteristics such as age, zip code, and comorbidities. Generally speaking, there were more comorbidities among patients who underwent preoperative testing compared to patients with one or no comorbidities (see Figure 1). However, the majority of patients who complete a preoperative test do not have multiple comorbidities. There were also observed differences in testing rates by age. In general, patients who had preoperative testing were older on average than patients who had no preoperative testing.

Figure 1.

Another new figure showcased the overall preoperative testing rates by year. This trend graph showed members how their overall rate for any preoperative testing compared in 2019, 2020, and 2021, and it included data points for the MVC average and regional comparison groups (see Figure 2). The key finding for this figure was that there has been very little change in testing rates over time when looking at overall preoperative testing practices. This means that, in general, the prevalence of low-value preoperative testing has remained consistently high overall across the collaborative for three years and likely longer.

Figure 2.

The latest report also included a new figure for absolute change in any preoperative testing from 2019 to 2021. For each hospital, this appears as a caterpillar plot of absolute change percentages for their highest-volume procedure among the three low-risk surgeries in the report. Members can see the percentage change—positive or negative—in their testing rate for that surgical condition, as well as how their absolute change compares to the rest of the collaborative. For example, hospitals that perform more cholecystectomies than hernia repairs or lumpectomies saw a wide range of both increases and decreases in preoperative testing rates from 2019 to 2021 (see Figure 3).

Figure 3.

The blinded hospital in this example observed very little change in its testing rate for cholecystectomy (-1.6%), and the MVC average was similar (-2.2%). This showcases that although the collaborative is not seeing much change to overall rates for any testing over time, individual members might see greater variability over time for specific tests or procedures, especially in instances of low case counts.

Members will be able to take those deeper dives into their rates for specific tests in the figures that make up the remaining pages of the report. Viewing one’s preoperative testing rates for each specific test can help members understand if any specific tests are driving their overall testing rate. One area of opportunity, for example, could be to reduce one's rate of cardiac testing, specifically ECGs; the rate of ECGs is very variable across the collaborative (see Figure 4) and could lead to a cascade of care.

Figure 4.

MVC is eager to drive improvement in this area. For more information on how MVC is working to reduce unnecessary preoperative testing, visit its Value Coalition Campaign webpage here. If you are interested in a more customized report or would like information about MVC’s preop testing stakeholder working group, please contact the MVC Coordinating Center at michiganvaluecollaborative@gmail.com.

0
View Post
MVC Integrates Surgeon-Level Data in Latest Preop Reports

MVC Integrates Surgeon-Level Data in Latest Preop Reports

In 2020, the Michigan Value Collaborative (MVC) introduced the Preoperative Testing Value Coalition Campaign (VCC) with the aim of reducing the use of unnecessary preoperative testing for surgical procedures. Preoperative testing, especially in low-risk surgical procedures, often provides no clinical benefits to patients but is ordered regularly at hospitals across Michigan. As part of MVC’s campaign to eliminate unnecessary and potentially harmful preoperative testing, the Coordinating Center developed a related push report, the latest version of which was shared earlier this week to help members benchmark data for common preoperative tests. MVC and the Michigan Surgical Quality Collaborative (MSQC) partnered to distribute these reports more widely and to encourage clinical and quality personnel to work together in identifying patterns and exploring new strategies.

This iteration of the report is the first to include blinded surgeon-level reporting, which will allow for a more nuanced understanding of variation within a given hospital. To include this, the Coordinating Center attributed one surgeon per episode based on condition-specific BETOS codes and NPI specialty information, with the understanding that the attributed surgeon may not be the individual ordering the preoperative test for that procedure. If their MVC data indicates wide variation between specific providers, hospitals may choose to drill down into their own data to investigate further. For hospitals that have several surgeons with enough cases for these procedures, there was significant variation in testing rates (see Figure 1).

Figure 1. Rate of Any Preoperative Test by Surgeon (Blinded Report)

Included in the report were patients undergoing elective and outpatient laparoscopic cholecystectomy, laparoscopic inguinal hernia repair, and lumpectomy. It incorporated index admissions between 1/1/2018 – 12/31/2020 for Blue Cross Blue Shield of Michigan (BCBSM) PPO Commercial, BCBSM Medicare Advantage, Blue Care Network (BCN) HMO Commercial, BCN Medicare Advantage, Medicare Fee-For-Service (FFS), and Michigan Medicaid. Hospitals only received a report if they had 11 or more cases in at least one of the three conditions and at least 11 cases per year in the three procedures combined. The analysis evaluated the use of the following tests using CPT codes: electrocardiogram, echocardiogram, cardiac stress test, complete blood count, basic metabolic panel, coagulation studies, urinalysis, chest x-ray, and pulmonary function.

In general, the report demonstrated significant variation in testing rates between members, with some testing rates ranging from 20% to over 90%. Due to the amount of variation, MVC suspects that preoperative testing is overused at the state level such that even hospitals that are average or below average may still have significant opportunities to safely reduce preoperative testing. The report included a table with each hospitals’ rates for each procedure and test, with accompanying comparisons to the rates of regional peers and the collaborative as a whole (see Figure 2).

Figure 2. Preoperative Testing Rates Table (Blinded Report)

The report also included figures for preoperative testing rates by specific tests, by payer, and by procedure. The variety of figures is meant to help hospitals better understand its variability in utilization, since specific procedures or tests may be driving their overall testing rate. One figure, for example, presents a hospital's three procedure-specific testing rates alongside their overall or “combined procedures” rate. To more easily identify areas of opportunity to reduce their overall testing rate, a hospital can compare their procedure-specific rates to determine which is driving their average, as well as compare their average to those of their regional peers and the collaborative as a whole (see Figure 3).

Figure 3. Rate of Any Preoperative Test by Procedure (Blinded)

In the case of the blinded example above, this hospital is more frequently ordering preoperative testing in cholecystectomy patients but is ordering fewer tests on average than their peers for all procedures combined. This finding is atypical since lumpectomy was found to have a higher testing rate in general; cholecystectomy testing rates were generally lower. In addition, MVC found that electrocardiography and blood tests (complete blood count, basic metabolic panel, coagulation studies) had the highest testing rates across all procedures.

Helping MVC members to make internal and external data comparisons is core to MVC reporting and is critical to its efforts to reduce unnecessary testing. As part of MVC's continued efforts in this area, the Coordinating Center will share hospital-level preoperative testing data at its upcoming semi-annual meeting in order to foster continued awareness of wide practice variation and encourage best practice sharing between members.

MVC is eager to drive improvement in this area. For more information on how MVC is working to reduce unnecessary preoperative testing, visit its Value Coalition Campaign webpage here. If you are interested in a more customized report or would like information about MVC’s preop testing stakeholder working group, please contact the MVC Coordinating Center at michiganvaluecollaborative@gmail.com.

0

Reports Identify Opportunity to Reduce Preoperative Testing

MVC distributed its final push report of 2021 this week when the Coordinating Center distributed preoperative testing reports to members. It provided recipients with refreshed data using only Blue Cross Blue Shield of Michigan claims in order to provide the most up-to-date and granular preoperative testing information available.

In general, the report demonstrated significant variation in testing rates between members, with preoperative testing rates ranging from 20% to over 90%. The average overall testing rate was 56% when looking at only the BCBSM payers, whereas the rate was 62% when looking at all payers in the earlier version of the report from February of 2021. The report included overall testing rate (Figure 1), preoperative testing rate trends over time (Figure 1), and rates for specific tests and procedures.

Figure 1. Blinded Preoperative Testing Push Report Graphs

Due to the amount of variation, MVC suspects that preoperative testing is overused at the state level such that even hospitals that are average or below average may still have significant opportunities to safely reduce preoperative testing.

Preoperative testing, especially in low-risk surgical procedures, often provides no clinical benefits to patients. Despite this, these services continue to be ordered regularly at hospitals across Michigan. Eliminating unnecessary and, in some cases, potentially harmful preoperative testing represents a clear opportunity to improve value in surgery. The MVC Coordinating Center uses administrative claims data and engagement with MVC members to try and reduce the use of unnecessary preoperative testing for surgical procedures to improve quality, reduce cost, and improve equity of care delivery throughout Michigan. The MVC Coordinating Center’s work on this issue is supported by a stakeholder working group to advise ongoing activity and provide insights on the best approaches to improve member awareness and practices.

This latest preoperative testing report also marked the conclusion of one year’s worth of activity in support of MVC’s Preoperative Testing Value Coalition Campaign. As part of MVC’s commitment to improve the health of Michigan through sustainable, high-value healthcare, the Coordinating Center developed specific focus areas to drive improvement. These are termed ‘Value Coalition Campaigns’ (VCCs).

In an effort to communicate progress on its Preoperative Testing VCC, the Coordinating Center recently compiled a 2021 Preoperative Testing Progress Report (see Figure 2) and included it as an attachment with the most recent report communications. Accomplishments included the development of educational flyers and resources, a published manuscript, partnerships with fellow Collaborative Quality Initiatives (CQIs), and custom analytics prepared for members. In addition, the Coordinating Center set several goals for 2022, such as developing provider-level reporting and hosting a dedicated symposium or workgroup, among others.

Figure 2. MVC 2021 Preoperative Testing VCC Progress Report

The Michigan Value Collaborative is eager to reduce unnecessary preoperative testing. If you are interested in a more customized report on preoperative testing practices at your hospital or physician organization or you want to learn more about the stakeholder working group, please contact the MVC Coordinating Center at michiganvaluecollaborative@gmail.com.