0
View Post
Refreshed Hospital-Level, ED-Based Episode Push Reports Coming Soon to Members

Refreshed Hospital-Level, ED-Based Episode Push Reports Coming Soon to Members

The MVC Coordinating Center will soon distribute refreshed hospital-level versions of its push report utilizing emergency department-based episodes (“ED-based episodes”). MVC generated separate versions for acute care hospitals and Critical Access Hospitals (CAHs) with tailored comparison groups. In addition to reflecting more recent data across all included payers, these refreshed hospital-level reports differ from prior versions due to the addition of three high-volume ED conditions and the incorporation of Michigan Medicaid claims.

Each page of the report is dedicated to a specific condition with the same metrics throughout, such as risk-adjusted, price-standardized 30-day total episode spending, inpatient admission rates, and rates of post-ED utilization. Reports feature each hospital’s own attributed ED-based episode data for eight high-volume ED conditions: abdominal pain, cellulitis, chest pain (nonspecific), congestive heart failure (CHF), chronic obstructive pulmonary disease (COPD), diabetes with long-term complications (including renal, eye, neurological, or circulatory), diabetes with short-term complications (including ketoacidosis, hyperosmolarity, or coma), and urinary tract infection (UTI). The three new conditions included in this year’s refresh include diabetes with long-term complications, diabetes with short-term complications, and UTI.

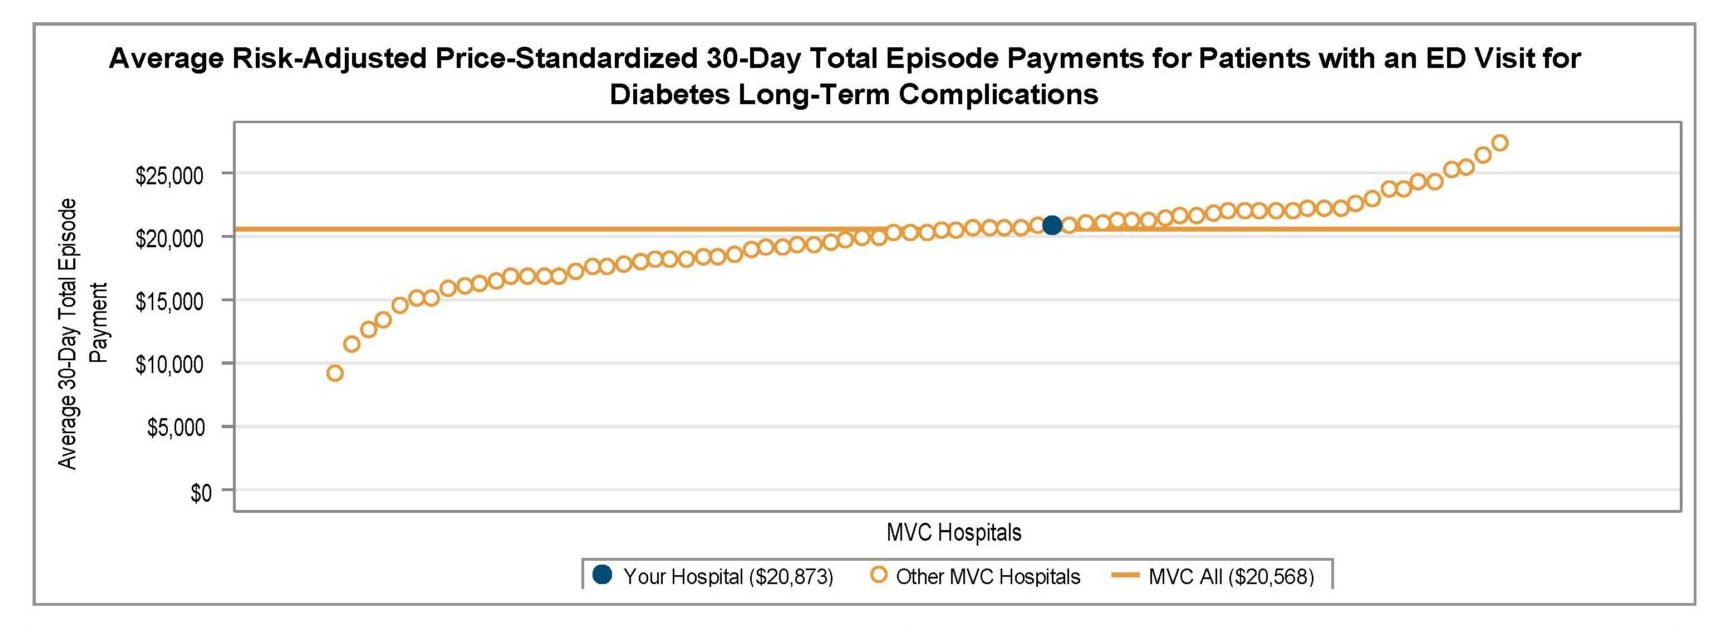
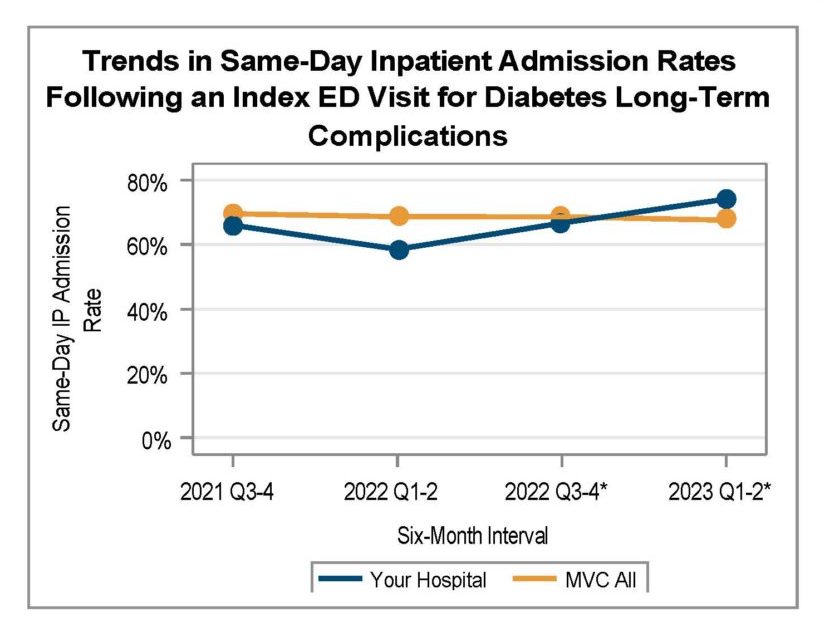
Among general acute care hospitals receiving a report, the average risk-adjusted, price-standardized 30-day total episode payment (Figure 1) for the reported conditions is highest for diabetes with long-term complications ($20,568), CHF ED-based episodes ($17,245), diabetes with short-term complications ($12,087), and COPD ED-based episodes ($10,289). The collaborative-wide average is lowest for chest pain ($3,111) and abdominal pain ($3,123) ED-based episodes. Within each condition, MVC 30-day total episode payments are consistently higher for episodes in which the patient had a same-day inpatient admission compared to episodes in which the patient did not have an inpatient stay beginning on the date of their ED visit. With that information in mind, hospital members can also use their individualized reports to track their same-day inpatient admission rate at six-month intervals using trend graphs for each included ED-based condition (Figure 2).

Figure 1.

Figure 2.

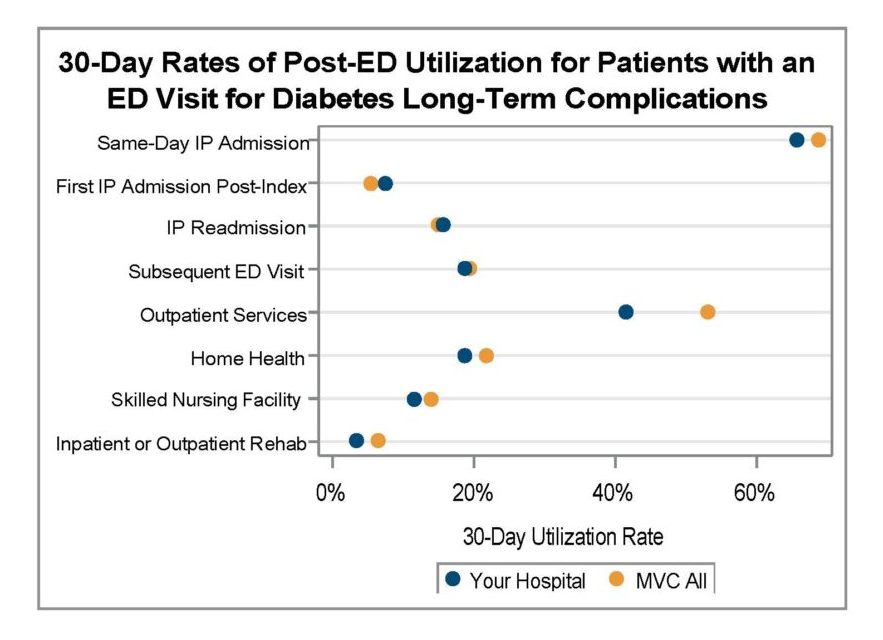
A key goal for these ED-based episode reports is to provide insight into healthcare utilization following index ED visits. Therefore, reports continue to include a dot plot (Figure 3) comparing patient post-ED utilization at a member hospital against their peer comparison group. Dot plots provide information on what percent of episodes had a same-day inpatient admission, what percent did not have a same-day inpatient admission but did see the patient admitted in the 1 to 30 days following the index ED visit, and the percent of patients who had two or more inpatient admissions (thus, at least one readmission) during the episode of care. Also provided are rates of subsequent ED visits, receipt of outpatient services, home health, skilled nursing facility care, and inpatient or outpatient rehab.

Figure 3.

These ED-based episodes are built using MVC’s most recent medical claims data from Medicare FFS, Blue Cross Blue Shield of Michigan PPO Commercial and Medicare Advantage plans, Blue Care Network HMO Commercial and Medicare Advantage plans, and Michigan Medicaid.

ED-based episodes utilize MVC’s newest episode of care data structure, which was developed last year in collaboration with the Michigan Emergency Department Improvement Collaborative (MEDIC), a BCBSM-funded Collaborative Quality Initiative with the goal of improving care and patient outcomes in Michigan emergency departments. MVC and MEDIC team members worked closely to develop 30-day episodes of care initialized by a patient’s visit to the ED and including all claims-documented care received in the 30 days following a patient’s index ED visit.

Please share your feedback with the MVC team if certain report measures are helpful or if you wish to see additional ED-based episode reporting for certain conditions and metrics. MVC is now also accepting custom report requests using its new ED-based data. Contact MVC to learn more.

0
View Post
MVC Uses New ED-Based Episode Data in Latest Push Report

MVC Uses New ED-Based Episode Data in Latest Push Report

The MVC Coordinating Center recently distributed its first-ever report based on new emergency department-based episodes (“ED-based episodes”), sharing versions with site coordinators and quality improvement staff at 102 participating MVC member hospitals across Michigan. Reports featured each hospital’s own attributed ED-based episode data for five high-volume ED conditions: chest pain, abdominal pain, chronic obstructive pulmonary disease (COPD), congestive heart failure (CHF), and cellulitis.

ED-based episodes are a new episode of care data structure developed this past year by MVC in collaboration with the Michigan Emergency Department Improvement Collaborative (MEDIC), a BCBSM-funded Collaborative Quality Initiative with the goal of improving care and patient outcomes in Michigan emergency departments. MVC and MEDIC team members worked closely to develop 30-day episodes of care initialized by a patient’s visit to the ED and including all claims-documented care received in the 30 days following a patient’s index ED visit. MEDIC program director Dr. Keith Kocher, MD, talks more about the collaboration as well as advice on leveraging this data from an emergency medicine perspective in the video below.

These ED-based episodes are built using medical claims data from Medicare Fee-for-Service, Blue Cross Blue Shield of Michigan PPO Commercial and Medicare Advantage plans, and Blue Care Network HMO Commercial and Medicare Advantage plans. MVC’s ED-based episodes of care include both adult and pediatric patients, providing new opportunities for quality improvement insights at Michigan hospitals. Though this report provides metrics for five specific index conditions, MVC currently offers data for 15 ED-based index conditions, including abdominal pain, asthma, atrial fibrillation, cellulitis, unspecified chest pain, COPD, CHF, deep venous thrombosis, diabetes mellitus (short- and long-term complications), gastrointestinal bleed, pneumonia, pulmonary embolism, pyelonephritis/urinary tract infections, and syncope.

For each of the five index conditions included in the recent reports, hospitals received information on risk-adjusted and price-standardized 30-day total episode payments, same-day inpatient admission rates over time, utilization of healthcare services across the patient’s 30-day episode of care, and each hospital’s most frequent reasons for inpatient readmissions. Patient claims data were included for adult patients aged 18 and older who had an ED visit at a given hospital between 1/1/21 and 8/31/22, were insured by one of the insurance plans mentioned above, and had a primary diagnosis on their index claim matching standardized definitions for the five included conditions.

Among general acute care hospitals receiving a report, the average risk-adjusted, price-standardized 30-day total episode payments (Figure 1) for the five reported conditions were highest for CHF ED-based episodes ($17,455) followed by COPD ED-based episodes ($11,001), and lowest for unspecified chest pain ($3,792). Within each condition, MVC 30-day total episode payments were consistently higher for episodes in which the patient had a same-day inpatient admission compared to episodes in which the patient did not have an inpatient stay begin on the date of their ED visit. With that information in mind, hospital members can also use their individualized reports to track their same-day inpatient admission rate by six-month intervals using trend graphs for each included ED-based condition (Figure 2).

Figure 1.

Figure 2.

A key goal for these ED-based episode reports was to provide insight into healthcare utilization following index ED visits. Therefore, reports included a dot plot (Figure 3) comparing their own hospital’s patient post-ED utilization to that of the appropriate general acute care hospital or Critical Access Hospital MVC comparison group. Dot plots provided information on what percent of episodes had a same-day inpatient admission, what percent did not have a same-day inpatient admission but did see the patient admitted in the 1 to 30 days following the index ED visit, and what percent of patients had two or more inpatient admissions (thus, at least one readmission) during the episode of care. Also provided are rates of subsequent ED visits, receipt of outpatient services, home health, and skilled nursing facility care.

Figure 3.

Please share your feedback with the MVC team if certain report measures were helpful or if you’d be interested in seeing future ED-based episode reporting for certain conditions and metrics. MVC is now also accepting custom report requests using its new ED-based data. Contact MVC to learn more.

0
View Post
MVC Announces Speakers, Breakout Sessions for Spring Collaborative-Wide Meeting

MVC Announces Speakers, Breakout Sessions for Spring Collaborative-Wide Meeting

The MVC Coordinating Center is excited to announce the agenda for its Spring Collaborative-Wide Meeting on Friday, May 19, 2023, from 10 a.m. – 3 p.m., at the Vistatech Center in Livonia, MI. This meeting’s theme of “connecting the dots” reflects a focus on interdisciplinary collaboration, care transitions, and alternative sites of care. This meeting also serves as the official launch of MVC’s 10-year anniversary celebration, which will highlight MVC’s achievements in promoting high-value healthcare throughout the last decade.

Presentations will highlight unblinded MVC data, inter-organizational partnerships, care team collaboration to improve patient outcomes, and supporting care transitions. Attendees will learn to utilize MVC’s claims data more effectively and efficiently to inform patient-centered quality improvement opportunities at their respective healthcare organizations. After this meeting, attendees will have insights and tools to help improve the following patient outcomes: care transitions and post-discharge support, readmissions, patient experience, treatment adherence, and patient education.

MVC’s Director Hari Nathan, MD, PhD, and Co-Director Mike Thompson, PhD, MPH, will kick off the day with Coordinating Center updates, announcements about the MVC Component of the Blue Cross Blue Shield of Michigan (BCBSM) Pay-for-Performance (P4P) Program, and success stories that celebrate MVC’s 10-year anniversary. This will be followed by the unveiling of new MVC episodes based on care initiated in the emergency department (ED), which were developed in partnership with the Michigan Emergency Department Improvement Collaborative (MEDIC). This presentation will include an unblinded data presentation using new ED-based episodes for congestive heart failure (CHF) patients.

The guest presentations will feature two MVC partners, a physician organization and a fellow Collaborative Quality Initiative (CQI). Speaking in the morning will be the Trinity Health IHA Medical Group. Caitlin Valley, MHA, Senior Population Health Project Manager at IHA, will present on transitional care collaboration and management for healthcare improvement. In the afternoon, attendees will hear from the INHALE (Inspiring Health Advances in Lung Care) team, a new population health CQI focused on the quality of care for adults with chronic obstructive pulmonary disease (COPD) and adults and children with asthma. Speaking about COPD care transitions and post-discharge support on behalf of INHALE will be Co-Director Michael Sjoding, MD, MSc, who is also an Associate Professor of Internal Medicine at Michigan Medicine.

In addition to traditional presentations, attendees will have multiple opportunities to network with and learn from their peers. The meeting includes a mid-day poster session that will highlight success stories and research across the collaborative and the broader CQI portfolio. MVC is still actively accepting poster submissions. Posters should feature first-hand experiences with quality improvement, related research, or the implementation of interventions and best practices. They can be on topics unrelated to MVC conditions or data, authored by clinicians and non-clinicians alike, or presentations already shared at a recent conference or event. Instructions for submitting a poster are available on MVC’s events page.

There will also be breakout sessions in the afternoon that focus on the new value metrics for Program Years 2024-2025 of the MVC Component of the BCBSM P4P Program. Attendees were asked to select one of four breakout sessions upon registering, including cardiac rehabilitation, post-discharge follow-up (focus on CHF, COPD, pneumonia), preoperative testing, and sepsis readmissions. MVC members interested in referencing the value metrics selected by specific hospitals participating in P4P can refer to MVC's value metric selection document located here.

Those interested in attending MVC's spring collaborative-wide meeting may register here. MVC hosts two collaborative-wide meetings each year to bring together healthcare quality leaders and clinicians from across the state. The fall collaborative-wide meeting will take place in October with a focus on health equity.

CME CREDITS AVAILABLE

The University of Michigan Medical School is accredited by the Accreditation Council for Continuing Medical Education (ACCME) to provide continuing medical education for physicians. The University of Michigan Medical School designates this live activity for a maximum of 4.25 AMA PRA Category 1 Credit(s)™. Physicians should claim only the credit commensurate with the extent of their participation in the activity.

Activity Planners

Hari Nathan, MD, PhD; Erin Conklin, MPA; Chelsea Pizzo, MPH; Chelsea Andrews, MPH; Kristy Degener, MPH

0

MVC Launches New Push Report on ED and Post-Acute Care Use

The emergency department (ED) is a unique and critical component of the healthcare system in the U.S., treating acute injuries or illnesses and acting as a safety net for patients who are uninsured or low income. ED visits are also very expensive, and that spending is growing according to a recent retrospective study of ED trends. This week the Michigan Value Collaborative (MVC) is distributing its newest push report on ED and post-acute care (PAC) utilization to support members' efforts in this space.

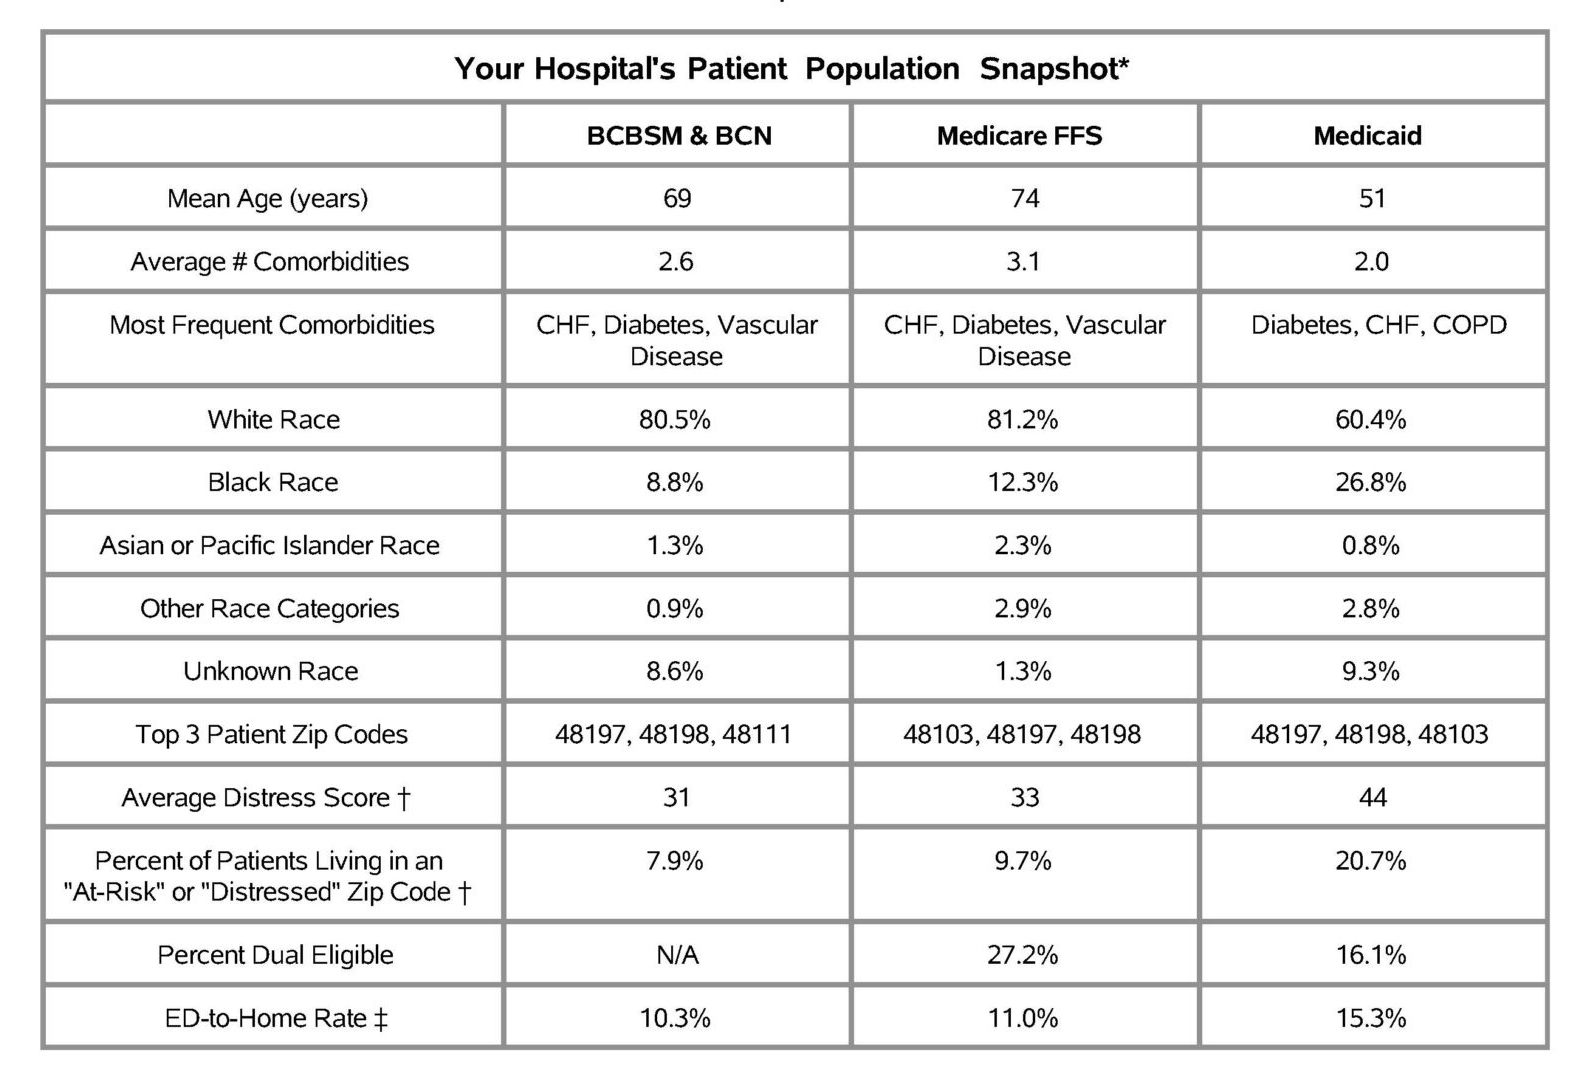
Since the ED serves as a safety net for patients experiencing barriers to healthcare access, the Coordinating Center report purposefully integrates measures tied to social determinants of health and health equity. Reports contain a patient population snapshot table showcasing several patient characteristics by payer (see Figure 1), including age, race, comorbidities, zip code, dual-eligibility status, and economic distress scores. Dual-eligible patients are those who qualify for both Medicaid and Medicare; these patients tend to have a higher prevalence rate for chronic conditions, disabilities, and other care needs that substantially increase healthcare utilization.

Figure 1.

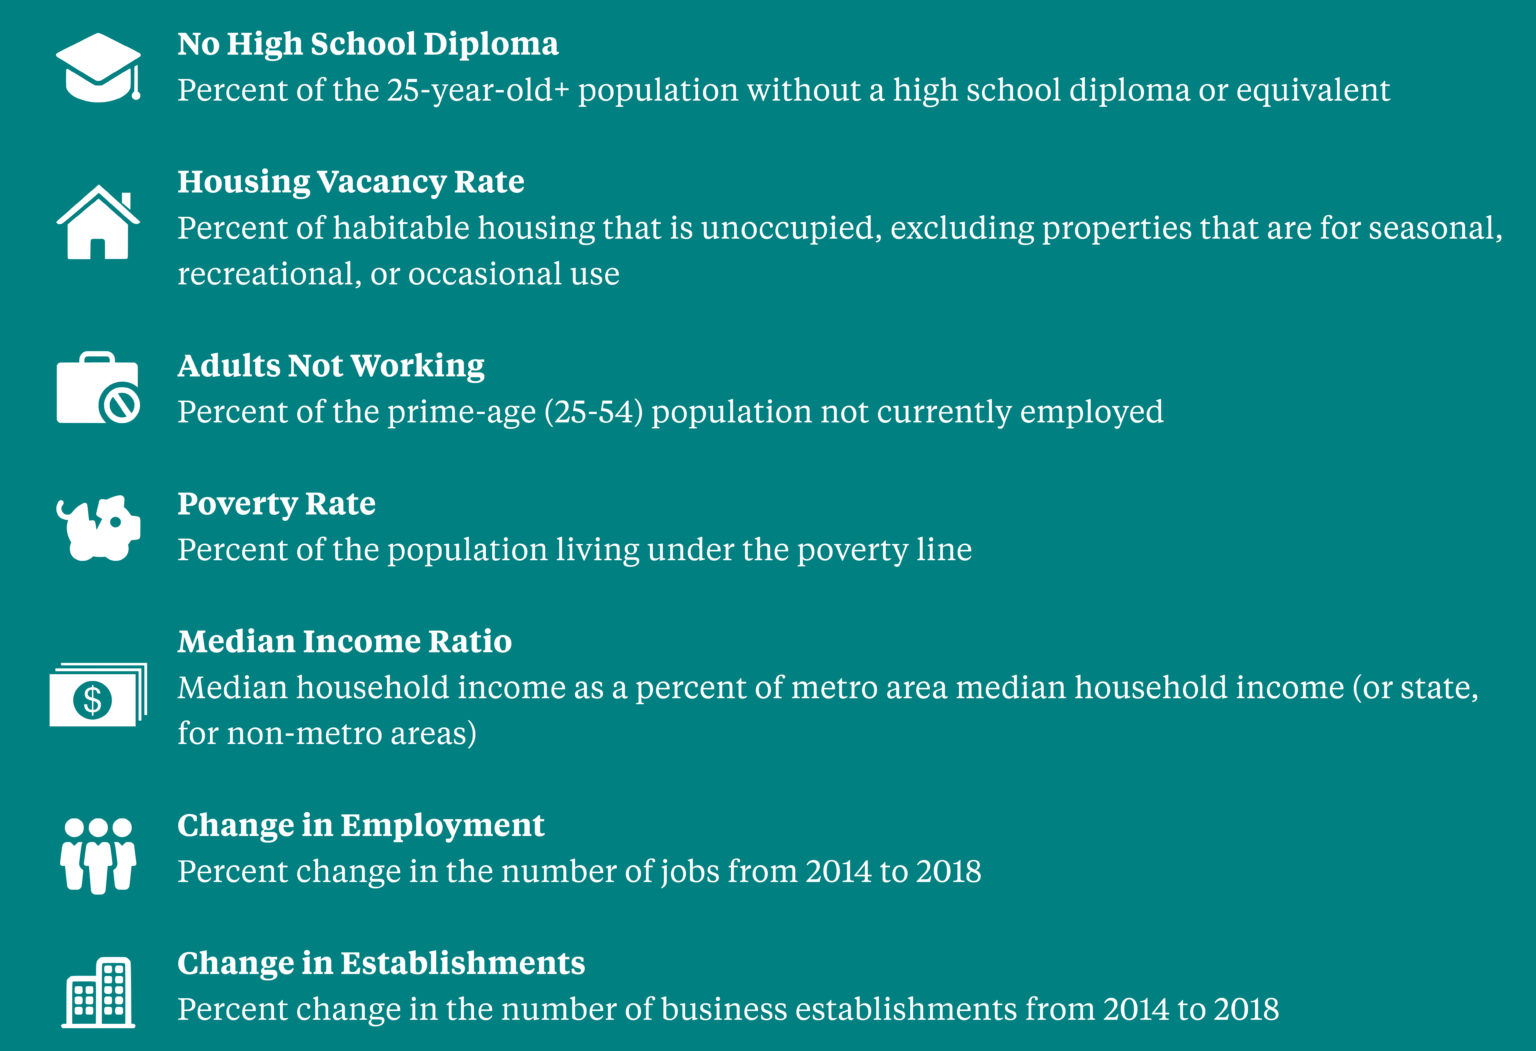
Economic distress scores range from 0-100 with a higher score indicating greater economic distress. These scores come from the Economic Innovation Group’s Distressed Communities Index (DCI), which is derived from the U.S. Census Bureau’s Business Patterns and American Community Survey. The DCI combines seven complementary economic indicators (see Figure 2) to provide a single, holistic, and comparative measure of economic well-being across communities in the U.S. In MVC’s report, there is a proportion of patients living in an “at-risk” or “distressed” zip code across all payers, as classified by the DCI. However, as the literature often indicates, the Medicaid population has the highest average distress score and a larger proportion of patients living in an “at-risk” or “distressed” zip code.

Figure 2.

The bulk of MVC’s latest report aims to provide its members with more granular insights into PAC utilization in the 30-day post-discharge period than is available on the MVC registry. Using index admissions for medical conditions from 1/1/18 through 12/31/20, the report focuses predominantly on ED utilization, which is categorized as either “ED to Home” or “ED to Readmission.” ED to Home represents ED visits that do not occur on the same day as readmission, and ED to Readmission refers to those visits occurring on the same day as readmission.

The report includes figures illustrating trends in 30-day ED to Home rates between 2018 and 2020, top reasons for ED visits at a given hospital, the number of ED to Home visits within 30 days post-discharge, the number of days until the first ED visit post-discharge, the ED to Home rate and the breakdown of total PAC spending for a hospital’s three highest-volume conditions, and the average ED facility payment. MVC included the following payers in this report: Blue Cross Blue Shield of Michigan (BCBSM) PPO Commercial, BCBSM Medicare Advantage (MA), Blue Care Network (BCN) HMO Commercial, BCN MA, Medicare Fee-for-Service, and Medicaid.

Overall, the MVC report confirms published findings that Medicaid patients utilize the ED at a higher rate than patients insured by other payers. The Coordinating Center also finds that ED use differs between types of providers. For acute care hospitals, for example, over half of ED visits occur on the same day as readmission, whereas these visits account for 40% at Critical Access Hospitals (CAHs).

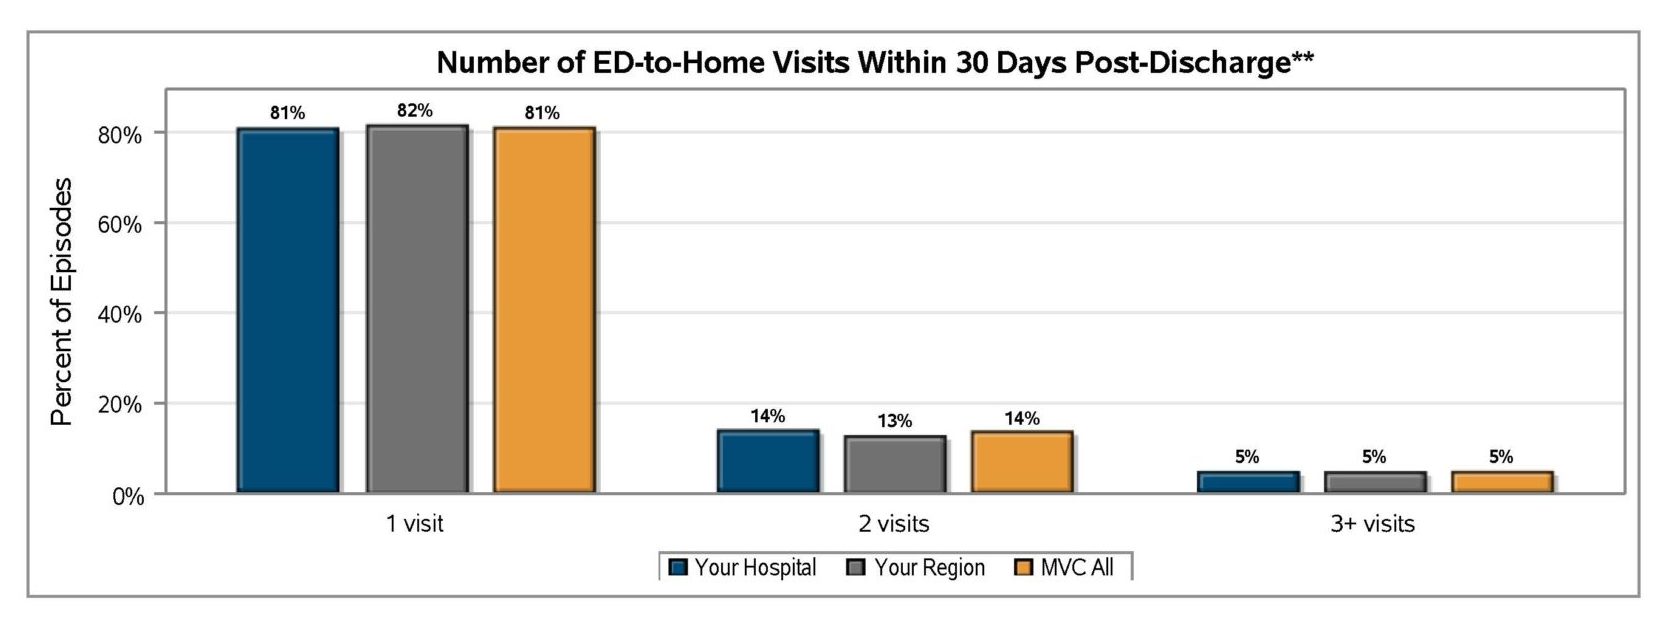
MVC also finds that ED to Home visits most often occur once in the 30 days following discharge for most of the collaborative (see Figure 3). There are some members, however, with three or more ED to Home visits within the 30-day post-discharge period.

Figure 3.

The Coordinating Center envisions this report being of particular importance to its CAH members, whose structures, services, and patient populations make the ED and PAC a top priority. As such, MVC prepared versions of this report for both CAHs and acute care hospitals using their respective comparison groups throughout. In other words, the CAH version of the report includes comparison points for all other CAHs in the collaborative. Acute care hospitals can see their traditional collaborative-wide and regional comparison data, not including hospitals with a CAH designation.

As members review and discuss the findings in their report(s), MVC encourages providers to utilize the Michigan Emergency Department Improvement Collaborative (MEDIC), which is dedicated to improving the quality of ED care across the state of Michigan. In addition, if members wish to discuss additional custom analyses on ED and PAC utilization, please contact the MVC Coordinating Center at michiganvaluecollaborative@gmail.com.

0
View Post
MVC Semi-Annual Meeting May 2021 – Virtual Meeting Recap

MVC Semi-Annual Meeting May 2021 – Virtual Meeting Recap

The Michigan Value Collaborative (MVC) held its first virtual semi-annual meeting of 2021 on Friday, May 7th. A total of 221 leaders from a variety of healthcare disciplines attended Friday’s virtual meeting, representing 74 different hospitals and 30 physician organizations (POs) from across the State of Michigan. These participants came together to hear about the planned adjustments to the MVC Component of the BCBSM P4P Program for Program Years (PY) 2022/23 and to discuss variations in transitions of care and ED utilization practices across Michigan.

MVC’s Director, Dr. Hari Nathan, started Friday’s meeting with an update from the MVC Coordinating Center, welcoming the eleven new hospital members who have joined the collaborative since the turn of the year and highlighting recent improvements to MVC data sources and push reporting. This included the “soft launch” of Medicaid data. MVC has now added Medicaid data to our data portfolio, meaning that MVC data sources now comprise over 80% of Michigan’s insured population. The Coordinating Center is in the final stages of validation and will have this new data source live for use by members in the coming months.

Dr. Mike Thompson, MVC’s Co-Director, then shared information on the MVC Component of the BCBSM P4P Program with attendees. An overview of PY20 was first provided, showing that participants earned an average of six points during this program year, an increase of around one point from the 2019 program year average. In an effort to continually improve the MVC Component, the Coordinating Center has introduced two methodological changes for the next two-year cycle (PY22 & PY23). Dr. Thompson walked through each of these changes, which include placing “Improvement” and “Achievement” on the same scoring scale, and introducing a new qualitative questionnaire for earning bonus points. The MVC Coordinating Center will be sharing further information on these changes and disseminating service line selection reports for the next program cycle with members in early June. Two dedicated P4P webinars will also be held around this time to assist members with selection.

Attention was then turned to looking at transition variations in Michigan hospitals, highlighting payment and ED utilization differences across MVC members, as well as the top reasons for readmission within the collaborative. To expand on this further, we were joined by guest speakers from the hospital, physician organization, and CQI setting to share their insights and learning. Dr. Robert Nolan and Michael Getty from Spectrum Health Lakeland were the first guest speakers of the day, discussing their organization’s efforts to reduce the cost of ED utilization and readmission rates. This highlighted the importance of real time data visuals, integrating documentation tools with best practices, and ensuring an effective longitudinal plan of care that is blended into natural work flows to enable physician buy-in. Dr. Nolan and Mike Getty were also able to spotlight the use of MVC data in these efforts, a custom option available to all MVC members.

Representing Professional Medical Corporation (PMC) and the Consortium of Independent Physician Associations (CIPA), Dr. Kyle Enger then shared how both entities have worked to promote appropriate emergency care in recent years. Again, this emphasized the importance of monthly data report cards to provide physicians with actionable data to guide activity, as well as the need to continue promoting urgent care as a viable alternative in certain situations. Our last guest speaker of the day was Dr. Keith Kocher, Director of the Michigan Emergency Department Improvement Collaborative (MEDIC). As well as providing a brief overview of the purpose of MEDIC and sharing some vital statistics relating to ED utilization across the US, Dr. Kocher discussed how best to approach the “ED readmission problem” and how local solutions can be used to minimize its impact.

To conclude Friday’s meeting, MVC’s Site Engagement Coordinator, Jeff Jameel, provided a synopsis of the day and highlighted key upcoming activities. The slides from Friday’s meeting are available here and a recording of the meeting can also be viewed here. If you have any questions on anything that was discussed at Friday’s semi-annual or are interested in finding out more about MVC’s offering, please reach out to the MVC Coordinating Center (michiganvaluecollaborative@gmail.com.) In the meantime, we look forward to seeing you all in-person again soon.