0
View Post
Push Report Details New MVC Measure that Quantifies Gaps in Patient Outcomes

Push Report Details New MVC Measure that Quantifies Gaps in Patient Outcomes

MVC distributed a new push report on Aug. 28, highlighting the components and methods for MVC’s newest measure: health outcome variation for all-cause readmissions. The goals of the recently distributed push reports are to familiarize hospital members with the measure methodology as well as provide a first look at their hospital’s performance.

This measure was developed with the goal of addressing common challenges by MVC’s members in identifying and addressing gaps in health outcomes within their patient populations. A survey distributed to the MVC collaborative in 2024 identified barriers such as insufficient data and insufficient financial investments as key causes for lingering variation across their patient population. With the introduction of MVC’s health outcome variation measure, MVC seeks to quantify the magnitude of hospital-level variation in all-cause readmission rates between payer groups using an index of variation calculation. Readmission rates are risk adjusted for patient demographic and comorbidity data, as well as for non-medical drivers of health.

The first two pages of the push report provide a step-by-step walkthrough of the index calculation, beginning with the calculation of absolute differences in hospital-level readmission rates by payer group compared to the hospital-level average readmission rate. The five payer groups included in these calculations are BCBSM and BCN Commercial, BCBSM and BCN Medicare Advantage, Medicaid only, Medicare FFS only, and patients dual-eligible for Medicaid and Medicare; dual-eligible patients have been pulled out of the Medicaid only and Medicare only categories. This initial step helps to highlight which payer group(s) have a higher readmission rate than the hospital’s average rate (Figure 1).

Figure 1.

The next step in the methodology is to calculate a hospital’s index of variation using absolute differences in payer-specific risk-adjusted readmission rates compared to the hospital’s risk-adjusted average readmission rate. These payer-specific absolute differences are multiplied by the respective payer population proportion to yield weighted differences (Figure 2). The sum of those weighted differences across all five payer groups yields the hospital’s index of variation. This index calculation indicates the magnitude of payer-specific differences in risk-adjusted readmission rates within a hospital. A higher value indicates a larger spread in a hospital’s payer-specific risk-adjusted readmission rates as well as opportunities to develop strategies that reduce gaps in care across patient groups. A lower value is desired and indicates less variation in a hospital’s risk-adjusted readmission rates across payers.

Figure 2.

MVC first announced this measure at its fall 2024 collaborative-wide meeting, where Senior Advisor Jim Dupree, MD, MPH, announced its inclusion in the next cycle of the MVC Component of the BCBSM Pay-for-Performance (P4P) Program. Scoring on this measure will be offered in the Program Year (PY) 2025 scorecards with no points attached and thereafter will be worth one point in the PY 2026-2027 cycle.

Similar index or composite measures have been utilized by other health organizations, and MVC’s risk-adjusted measure can help identify hospital-level preventable differences in readmissions. Hospitals will earn the health outcome variation point by improving relative to their own baseline index or by performing well relative to their peers (i.e., having an index at or below the collaborative-wide median index).

As hospitals review their provided push report and become familiar with this new health outcome variation measure, they are encouraged to reach out to MVC with any questions.

0
View Post
MVC’s Updated Common Conditions Report Now Available to Hospital Members

MVC’s Updated Common Conditions Report Now Available to Hospital Members

Last week, the Coordinating Center distributed a refreshed version of MVC’s common conditions report. This report delivers a comprehensive analysis of care episodes for eight prevalent medical and surgical conditions frequently targeted for quality improvement initiatives within MVC hospitals. It assesses hospital performance and highlights potential areas for growth. The report’s current conditions include atrial fibrillation (A-Fib), chronic obstructive pulmonary disease (COPD), colectomy (non-cancer), congestive heart failure (CHF), coronary artery bypass graft (CABG), percutaneous coronary intervention (PCI), pneumonia, and sepsis. Notably, total knee and hip (joint) replacement, which was previously included, has been replaced by A-Fib in the latest report.

MVC generated reports for 96 eligible hospitals. General acute care hospital (GACH) and Critical Access Hospital (CAH) members received tailored versions of the report, which included benchmark data specific to their respective hospital categories and tailored comparison groups. A blinded version of the general acute care hospital report is available here.

Although the provided metrics and figures vary by condition and case count, report pages generally focus on 30-day total episode payments, post-acute care and post-discharge ED utilization, readmission rates, and common reasons for readmissions. The report has been updated to feature data covering the period of January 1, 2023, through December 31, 2024, for Blue Cross Blue Shield of Michigan (BCBSM)/Blue Care Network (BCN) Commercial, BCBSM/BCN Medicare Advantage (MA), and Michigan Medicaid; Medicare FFS data covers the period of January 1, 2023, through June 30, 2024.

Upon opening the latest report, MVC members will first find a summary of patient population demographic data for each condition/procedure category their hospital was eligible to receive, facilitating a comprehensive and effective comparison across service lines for a variety of non-medical drivers of health.

On subsequent condition or procedure pages, most hospitals will have a figure displaying the breakdown of 30-day risk-adjusted, price-standardized post-acute care payments by payer categories (see Figure 1). The categories available included BCBSM/BCN Commercial, BCBSM/BCN Medicare Advantage, Medicare Only, Medicaid Only, and Dual Eligible; hospitals received data points for those payer categories with at least 11 episodes during the reporting period. As a reminder, the “Dual-Eligible” category represents patients eligible for both Medicare and Medicaid coverage, and the separate Medicare and Medicaid categories do not include those patients when the separate Dual-Eligible category is included.

Figure 1.

Bar graph of breakdown by payor of 30-day risk adjusted, price standardized, total post-acute care payments among patients hospitalized for COPD at a hospital

**Information is presented only for those payer categories that have at least 11 episodes during reporting period. Missing data labels represent less than 9% of the total.

Beyond offering insights into payments by payer and post-acute care categories, this figure can offer additional insights and context compared to the report figure that follows it for post-acute care utilization rates (see Figure 2). The two figures together serve to provide a clearer understanding of the relationship between rates of utilization and percent of episode spending for each post-acute care category, illustrating whether spending aligns with utilization frequency. The post-acute care categories for both figures includes home health care, skilled nursing facility (SNF) care, inpatient rehab, outpatient rehab, emergency department care, long-term acute care hospitals (LTACH) and outpatient services.

Figure 2.

Dot matrix of 30-day post acute care utilization among patients hospitalized for COPD

The remaining figures focus largely on ED utilization and readmissions, with some service line pages including figures for common reasons for readmission. Readmissions were generally observed to be highest across the collaborative at about 20% for patients hospitalized for CHF, followed by patients hospitalized for sepsis or COPD. Readmission rates were lowest across the collaborative at about 6% among patients who underwent a PCI procedure. There is also a visible decrease over time in 30-day readmission rates across the collaborative for all eight common conditions (see Figures 3 and 4); however, it is important to note that the 2024 Q3-Q4 data point does not include Medicare FFS patients, which is likely impacting the rate for that time interval.

Figure 3: 30-Day Readmission Rate Among Patients Hospitalized for Atrial Fibrillation, COPD, Colectomy, and CHF*

Graph of 30-Day Readmission Rate Among Patients Hospitalized for Atrial Fibrillation, COPD, Colectomy, and CHF*

Figure 4: 30-Day Readmission Rate Among Patients Hospitalized for CABG, PCI, Pneumonia, and Sepsis*

Graph of 30-Day Readmission Rate Among Patients Hospitalized for CABG, PCI, Pneumonia, and Sepsis*

*Data points are only shown for six-month intervals with 11 or more episodes. Data from 2024 Q3-Q4 excludes Medicare episodes.

MVC is dedicated to regularly updating its commons conditions report, aiming to equip collaborative partners with insightful data that can drive and reinforce meaningful advancements in healthcare quality. We hope these reports prove beneficial and welcome MVC members to contact MVC with any questions or analytic requests.

0
View Post
MVC Updates Registry with New Claims Across All Payers

MVC Updates Registry with New Claims Across All Payers

This week MVC updated its registry with new claims from its included payers. This most recent update included the addition of three new months of Blue Cross Blue Shield of Michigan (BCBSM) and Blue Care Network (BCN) claims, one new quarter of Medicaid claims, and one new quarter of Medicare Fee-for-Service (FFS) claims. Following these updates, the MVC registry now has the following data ranges for its data:

  • BCBSM PPO (Commercial and Medicare Advantage): 01/01/2015 – 03/31/2025 (index events through 12/31/2024)
  • BCN (Commercial and Medicare Advantage): 01/01/2015 – 03/31/2025 (index events through 12/31/2024)
  • Medicaid: 01/01/2015 – 03/31/2025 (index events through 12/31/2024)
  • Medicare FFS: 01/01/2015 – 09/30/2024 (index events through 06/30/2024)

Anytime MVC publishes new data on its registry, the newest claims for each payer are incorporated throughout the various reports and dashboards where that payer’s data is present, including the interactive multi-payer reports for cardiac rehabilitation utilization and preoperative testing.

Refreshed Multi-Payer Cardiac Rehabilitation Reports

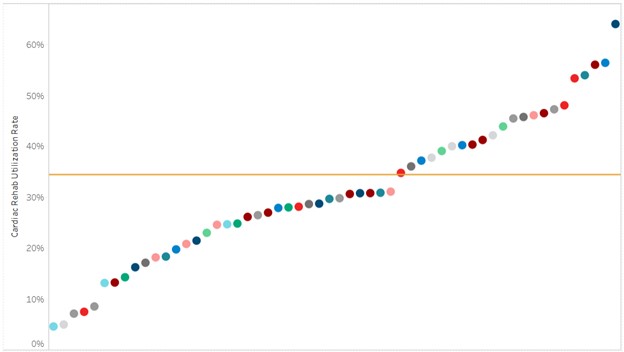
The multi-payer cardiac rehabilitation utilization reports were added to the registry in the first half of 2024 and have replaced the static PDF hospital-level push reports MVC previously distributed biannually to its members as well as BMC2 and MSTCVS contacts. The regular release of new data on the registry, therefore, gives members opportunities throughout the year to check progress on cardiac rehabilitation metrics more regularly and find opportunities for improvement. For example, available 2024 data on cardiac rehabilitation enrollment for all eligible patients (excluding heart failure patients) with episode start dates between Jan. 1, 2024, and Dec. 31, 2024, indicates wide variability among hospitals; the statewide average utilization rate is 34%, with the majority of sites observing rates below the Million Hearts recommended 70% rate as well as below the Michigan Cardiac Rehab Network goal rate of 40% (Figure 1).

Figure 1. Statewide Rankings for Cardiac Rehab Utilization within 90 Days After Discharge from AMI, CABG, PCI, SAVR, and TAVR, 1/1/2024-12/31/2024*

*Index events 1/1/24-12/31/24 for BCBSM Commercial and Medicare Advantage (MA), BCN Commercial and MA, and Medicaid; index events 1/1/24-6/30/24 for Medicare FFS

Similarly, there is significant variation between hospitals in their mean days to a patient’s first cardiac rehab appointment, with some hospital patients attending their first session 31 days after discharge and some waiting as long as 68 days. However, MVC has observed a steady yearly decrease over time in this metric, with a collaborative-wide average of 59 days in 2020 compared to 47 days in 2024.

These data along with metrics for mean number of visits and utilization rates for specific service lines and payers can be accessed via the multi-payer tab on the registry under the cardiac rehab heading.

Refreshed Multi-Payer Preoperative Testing Reports

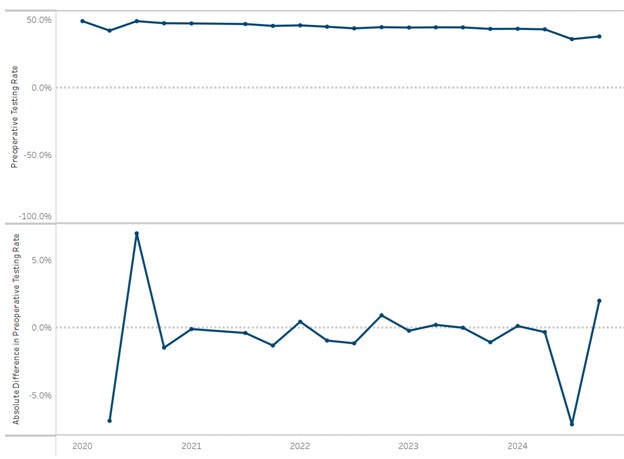
The multi-payer preoperative testing utilization reports were added to the registry at the end of 2024 and have also replaced static hospital-level push reports that were previously distributed as biannual PDF reports to members as well as MSQC contacts. Looking at all available 2024 claims across payers, there is evidence of a small decrease in the MVC All rate of preoperative testing prior to low-risk surgery beginning in late 2022 through 2024 (Figure 2). The average testing rate in 2020 was 46.8% and the average rate in 2024 was 39.9%. Members whose rates are 40% overall or higher are eligible to participate in the RIght-sizing Testing before Elective Surgery (RITE-Size) program, which offers participating sites consultation and coaching, templates, best practice guidance, and other resources to help coordinate decreases in unnecessary testing across their institutions. MVC is also able to supplement registry data with custom analytics by an MVC analyst to meet the needs of members. One such site recently utilized MVC’s custom analytics to identify differences in preoperative testing rates by physician NPI to support conversations about intra-hospital variation by provider and service line.

Figure 2. Statewide Rate of Preoperative Testing and Relative Difference in Preoperative Testing by Quarter, 01/01/2020-12/31/2024*

*Index events 1/1/24-12/31/24 for BCBSM Commercial and Medicare Advantage, BCN Commercial and MA, and Medicaid; index events 1/1/24-6/30/24 for Medicare FFS

MVC’s registry contains an extensive collection of report views for multi-payer, P4P, and payer-specific metrics with select patient-level drilldown capabilities. If you are newer to the registry or would like a refresher on how best to leverage the information, reach out to the MVC Coordinating Center for information about a tailored registry training.

0
View Post
Refreshed Hospital-Level, ED-Based Episode Push Reports Released April 2025

Refreshed Hospital-Level, ED-Based Episode Push Reports Released April 2025

The MVC Coordinating Center distributed refreshed hospital-level versions of its push report utilizing emergency department-based episodes (“ED-based episodes”) in April, preparing versions for acute care hospitals and Critical Access Hospitals to include different comparison groups. The report leverages data focused specifically on patient episodes first initiated by a visit to the emergency department and follows those episodes to determine common metrics such as episode payments, post-ED care utilization, and outpatient service rates.

In addition to reflecting more recent data across all included payers, these refreshed hospital-level reports provide additional social risk data than was offered previously with the addition of several metrics based on patient Zip code to the patient population snapshot table. This allows hospitals to better understand the patients represented in various service line cohorts presented within the ED-based episodes report and the types of social risk factors that may be present, such as low median household income, SNAP usage, vehicle ownership, and homeownership.

Each page of the report is dedicated to a specific condition with mostly the same metrics throughout, such as risk-adjusted, price-standardized 30-day total episode spending, inpatient admission rates, and rates of post-ED utilization. Reports feature each hospital’s own attributed ED-based episode data for eight high-volume ED conditions: abdominal pain, cellulitis, chest pain (nonspecific), congestive heart failure (CHF), chronic obstructive pulmonary disease (COPD), diabetes with long-term complications (including renal, eye, neurological, or circulatory), diabetes with short-term complications (including ketoacidosis, hyperosmolarity, or coma), and urinary tract infection (UTI).

Among general acute care hospitals receiving a report, the average risk-adjusted, price-standardized 30-day total episode payment (Figure 1) for the reported conditions is highest for diabetes with long-term complications ($21,031), followed by CHF ($18,363), diabetes with short-term complications ($12,571), and COPD ($11,145). The collaborative-wide average total episode payment is lowest for chest pain ($3,327) and abdominal pain ($3,405). These rankings are consistent with the 2024 ED-based episode reports.

Figure 1.

A key goal of these reports is to provide insights into healthcare utilization following index ED events; therefore, the latest reports continue to include a dot plot (Figure 2) comparing patient post-ED utilization at a member hospital against their peer comparison group. Dot plots provide information on what percent of episodes had a same-day inpatient admission, what percent did not have a same-day inpatient admission but did see the patient admitted in the 1 to 30 days following the index ED visit, and the percent of patients who had two or more inpatient admissions (thus, at least one readmission) during the episode of care. Rates of subsequent ED visits, outpatient services, home health, skilled nursing facility care, and inpatient or outpatient rehab are also provided.

Figure 2.

MVC uses its most recent medical insurance claims data from Medicare FFS, Blue Cross Blue Shield of Michigan PPO Commercial and Medicare Advantage plans, Blue Care Network HMO Commercial and Medicare Advantage plans, and Michigan Medicaid to build these ED-based episodes reports.

MVC recently presented data on the incidence of behavioral health co-diagnoses on ED-based episodes at its May collaborative-wide meeting. This presentation highlighted the presence of behavioral health ICD-10 codes on index ED visits for patients with a primary diagnosis code matching one of MVC’s ED conditions. MVC reported 13% of ED index events statewide contained a behavioral health code. The most common codes observed were for anxiety disorder (36.7%), major depressive disorder (10.6%), and dementia (8.7%). The recent ED-based episode reports include a row for “most frequent comorbidities” by condition, which will help members determine service lines where psychological disorders or substance abuse disorders are a common consideration for specific service lines at their hospital.

MVC’s ED-based episode structure was developed in collaboration with the Michigan Emergency Department Improvement Collaborative (MEDIC), a BCBSM-funded Collaborative Quality Initiative with the goal of improving care and patient outcomes in Michigan emergency departments. MVC and MEDIC team members worked closely to develop 30-day episodes of care initialized by a patient’s visit to the ED and including all claims-documented care received in the 30 days following a patient’s index ED visit.

Please share your feedback with the MVC team if certain report measures are helpful or if you wish to see additional ED-based episode reporting for certain conditions and metrics. MVC is now also accepting custom report requests using its ED-based data. Contact MVC to learn more.

0
View Post
MVC Refreshes Registry Reports with New Data & Methods

MVC Refreshes Registry Reports with New Data & Methods

At the end of February, MVC updated its registry with new payer data. MVC adds new data to the registry monthly upon receipt of new claims from included payers. This most recent update included the addition of two new months of Blue Cross Blue Shield of Michigan (BCBSM) and Blue Care Network (BCN) claims, one new quarter of Medicaid claims, and one new quarter of Medicare claims. Following these updates, the MVC registry now has the following data ranges for its data:

  • BCBSM PPO (Commercial and Medicare Advantage): 01/01/2015 – 12/31/2024 (index events through 09/30/2024)
  • BCN (Commercial and Medicare Advantage): 01/01/2015 – 12/31/2024 (index events through 09/30/2024)
  • Medicaid: 01/01/2015 – 12/31/2024 (index events through 09/30/2024)
  • Medicare FFS: 01/01/2015 – 06/30/2024 (index events through 03/31/2024)

Anytime MVC publishes new data on its registry, the newest claims for each payer are incorporated throughout the various reports and dashboards where that payer’s data is present, including the interactive multi-payer reports for cardiac rehabilitation utilization and preoperative testing.

Refreshed Multi-Payer Cardiac Rehabilitation Reports

The multi-payer cardiac rehabilitation utilization reports were added to the registry in the first half of 2024 and have replaced the static PDF hospital-level push reports MVC previously distributed biannually. The regular release of new data on the registry, therefore, gives members opportunities throughout the year to check progress on cardiac rehabilitation metrics more regularly and find opportunities for improvement. For example, current data on cardiac rehabilitation enrollment for CABG patients with episode start dates between Jan. 1, 2024, and Sept. 30, 2024, indicates wide variability among hospitals, with many sites observing rates below the recommended 70%. Across the collaborative, enrollment in cardiac rehab after CABG procedures was as low as 28% at one MVC member hospital and as high as 83% at another with a statewide average of 61% (Figure 1). Similarly, cardiac rehab utilization is much lower on average among PCI patients over the same time period (32%), and there is wide inter-hospital variation with rates ranging between 6% and 86% (Figure 2).

Figure 1. Statewide Rankings for Cardiac Rehab Utilization within 90 Days After Discharge from CABG, 1/1/2024-9/30/2024

Figure 2. Statewide Rankings for Cardiac Rehab Utilization within 90 Days After Discharge from PCI, 1/1/2024-9/30/2024

This latest registry update also included a methodological change impacting cardiac rehabilitation reporting for attendance. These methodological improvements were meant to increase the accuracy of MVC’s reported mean number of visits attended within a selected time period. MVC noted that this change resulted in increases in the average number of completed cardiac rehabilitation visits overall, and especially among BCN and Medicaid beneficiaries. This increase in the average number of visits reflects the fact that MVC improved the capture of multiple cardiac rehabilitation visits over a longer time period billed on a single claim.

Refreshed Multi-Payer Preoperative Testing Reports

The multi-payer preoperative testing utilization reports were added to the registry at the end of 2024 and have also replaced static hospital-level push reports that were previously distributed as biannual PDF reports to members. Looking at all available 2024 claims across payers, there is evidence of a small decrease in the MVC All rate of preoperative testing prior to low-risk surgery beginning in late 2022 and continuing throughout 2023 and into 2024 (Figure 3). Those members who are working to reduce unnecessary preoperative testing are encouraged to check their updated data. MVC is also able to supplement registry data with custom analytics by an MVC analyst to meet the needs of members. One such site recently utilized MVC’s custom analytics to identify differences in preoperative testing rates by physician NPI to support conversations about intra-hospital variation by provider and service line.

Figure 3. Statewide Rate of Preoperative Testing and Relative Difference in Preoperative Testing by Quarter, 2020-2024

MVC’s registry contains an extensive collection of multi-payer, P4P, and payer-specific views and metrics. If you are newer to the registry or would like a refresher on how best to leverage the information, reach out to the MVC Coordinating Center for information about a custom registry review.

0
View Post
Hospitals Receive PY24 Mid-Year Scorecards for MVC Component of BCBSM P4P Program

Hospitals Receive PY24 Mid-Year Scorecards for MVC Component of BCBSM P4P Program

Last week the Michigan Value Collaborative (MVC) distributed mid-year scorecards for Program Year (PY) 2024 of the MVC Component of the Blue Cross Blue Shield of Michigan (BCBSM) Pay-for-Performance (P4P) Program. This report provided hospitals with their current standing for PY 2024.

Each hospital received a mid-year score out of a total of 10 points, including 0 to 4 points for their selected total episode payment metric, 0 to 4 points for their selected value metric, and 0 to 2 points for completed eligible engagement activities thus far in calendar year 2024. PY 2024 scores achievement and improvement points for each hospital’s selected episode spending conditions and value metrics using index admissions from 2023 as the performance year against admissions in 2021 as the baseline year. Hospitals are awarded the higher of their achievement and improvement point scores.

The performance data timeframes included in mid-year PY 2024 scoring were index events 1/1/2023-12/31/2023 for BCBSM PPO Commercial, BCBSM Medicare Advantage, BCN HMO Commercial, and BCN HMO MA, and index events 1/1/2023-9/30/2023 for Medicare FFS. The engagement points accrued represent all completed activities from 1/1/2024-9/30/2024. This is the first year of a two-year (PY24-25) P4P cycle. The full methodology for this program cycle can be found in the PY2024-2025 technical document.

Figure 1 illustrates the current distribution of total points out of 10 across the collaborative. The average points scored across the mid-year scorecards was 6.2/10. This average is 0.2 points lower than the average points scored at the conclusion of PY23.

Figure 1.

Figure 2 illustrates the breakdown of scoring on average by each program component (i.e., episode spending metric, value metric, engagement points). Hospitals could earn up to four points each for their episode spending and value metric selections, and up to two points for engagement activities. Across the collaborative, the average points scored was higher for value metrics (2.7) than for episode spending (2.5).

Figure 2.

Figure 3 illustrates the breakdown of average points by episode spending condition. Consistent with previous years, joint replacement was the highest scoring condition with an average of 3.1 points. Much of the recent success observed for the joint replacement condition could be attributed to the shift from post-acute care in skilled nursing facilities (SNF) to home health and the move towards outpatient surgeries; however, with most joint replacements now occurring in outpatient settings there is less savings to be achieved from such shifts going forward. Congestive heart failure and pneumonia were the lowest scoring conditions with hospitals earning less than two points on average for each.

Figure 3.

Figure 4 illustrates the breakdown of average points by value metric. The highest scoring value metric was preoperative testing with 3.4 points followed by 90-day cardiac rehab utilization after percutaneous coronary intervention (PCI) with 2.8 points. For both of these value metrics, hospitals have access to additional support and resources via MVC’s value-based improvement initiatives, including the RITE-Size (Right-Sizing Testing before Elective Surgery) initiative and the Michigan Cardiac Rehab Network (MiCR) offerings. The lowest scoring value metric was 7-day follow-up rates after pneumonia (2.1).

Figure 4.

These mid-year P4P scores are subject to change as new data is added. The final scorecards will be distributed after all 2023 claims are incorporated. Hospitals can track their score through the P4P PY24-25 reports on the MVC registry, which provides all relevant scoring information for both improvement and achievement points in one place. These registry reports can be filtered by selected conditions/metrics to make the tracking of P4P points easier. Contact the MVC Coordinating Center [EMAIL] for a walkthrough of your hospital’s PY24 mid-year scorecard or P4P registry reports.

0
View Post
MVC, BMC2, HBOM Announce New Cardiac Rehab Materials & Opportunities at MiCR Meeting

MVC, BMC2, HBOM Announce New Cardiac Rehab Materials & Opportunities at MiCR Meeting

In partnership with BMC2 and HBOM, the Michigan Value Collaborative recently co-hosted the Michigan Cardiac Rehab network (MiCR) virtual summer meeting, which brought together providers, quality improvement staff, rehab staff, and patients with a shared interest in improving participation in cardiac rehabilitation. Over 70 attendees from across the state joined the meeting on Aug. 9, where they heard updates from the MiCR leadership, previewed new MiCR resources, and heard from a panel of hospital representatives who discussed their experience using the MiCR NewBeat materials.

NewBeat Success and Re-Orders

One key announcement from the meeting included the launch of a second round for placing NewBeat material print orders [ORDER FORM LINK]. The MiCR team will accept submitted order forms through Tues., Sept. 24. Those who request the free printed materials can either pick them up at the fall in-person MiCR meeting in Midland or have them mailed to an address they designate. Early survey evidence suggests that implementation of the NewBeat program is associated with an increase in confidence across a number of metrics (Figure 1).

Figure 1. NewBeat Survey Results Pre- and Post-Implementation

Speaking to the value of these materials was a panel of representatives from Corewell Health South, Holland Hospital, and Michigan Medicine—three sites who ordered NewBeat materials in the first round at the start of 2024. Each shared their experience using the materials and advice on their integration. HBOM also recorded virtual interviews with the Corewell Health and Holland Hospital site contacts for use in a NewBeat success story video (Figure 2), which was played for the meeting’s attendees.

Figure 2. Implementing NewBeat Feedback Video

Those who wish to place an order for NewBeat materials in the current round will again have the opportunity to request the MiCR patient/provider educational handout (available in English, Spanish, and Arabic), the cardiac rehab liaison postcard, and the cardiac care cards. Some customizations are possible to the handout and postcard design to include local hospital or rehab center contact information. Additionally, there is a new offering included in this round of ordering that was launched at the meeting: a new discharge packet sticker. These new sticker designs (Figures 3 and 4) can be affixed to the outside of a patient’s discharge folder and are meant to stand out to patients and families who are often inundated with discharge paperwork. They alert the patient that their discharge paperwork includes a referral to cardiac rehab as the next step in their care.

Figure 3. NewBeat Sticker Journey Design

Figure 4. NewBeat Sticker Golden Ticket Design

MiCR Mini Grant RFP Opens for Second Round

The summer meeting also included an announcement that MiCR’s mini grant program to fund small, local cardiac rehab quality improvement projects will similarly be re-opened for a second round of submissions. The first round resulted in the funding of projects at MyMichigan Midland, DMC Huron Valley Sinai, and Ascension Rochester. MiCR is accepting new submissions through Fri., Sept. 13 for up to $5,000 per project. Full details on the RFP and application are available on the MiCR website.

MiCR Updates & Meeting Materials

Finally, the MiCR leadership team announced the development of a neutrally-branded, customizable patient education video that can be shared with hospitals or rehab programs to play on their own websites or waiting room monitors. The video was developed in response to feedback from partner sites that online materials need to be improved and that neutral video content about the value of cardiac rehab is limited. MiCR developed a video for use by network partners and also identified several existing videos published by MillionHearts, Mayo Clinic, and others.

The MVC and BMC2 teams are looking forward to the Michigan Cardiac Rehab Network's fall in-person meeting on Fri., Nov. 8, from 10 a.m. to 3 p.m., at the H Hotel in Midland. MyMichigan is serving as co-host for the event in collaboration with MiCR. Additional event details will be shared in the coming weeks. Those who were unable to attend the summer meeting can view the meeting recording [LINK] or meeting slides [LINK]. Please reach out to info@michigancr.org with any questions.

0
View Post
Registration Open Now for Fall Collaborative-Wide Meeting

Registration Open Now for Fall Collaborative-Wide Meeting

Registration is open to join the MVC Coordinating Center for its fall collaborative-wide meeting on Friday, October 25, from 10 a.m. to 3 p.m. at the VistaTech Center in Livonia, MI. This meeting's theme is Data-Driven Excellence: Strategies for Success in Quality Improvement, and will feature unblinded MVC data, member presentations on quality improvement successes, networking opportunities, and insights about improving value-based healthcare. Members and partners may register here until Oct. 15.

P4P Updates, Unblinded Data, & Networking

The MVC team will share updates on team activity, including the upcoming cycle of the MVC Component of the BCBSM P4P Program. MVC will also share unblinded data insights. Attendees will have several opportunities to network with peers from hospitals, physician organizations, and Collaborative Quality Initiatives (CQIs) from across the state of Michigan via a poster session and breakout room discussions.

If your site is interested in submitting a poster to present at the fall meeting, please complete this form no later than Sept. 13.

In the coming weeks, MVC will share a finalized agenda with speaker details and other updates on its collaborative-wide meeting webpage.

P4P Engagement Points

Hospitals that send a site representative to one of MVC’s 2024 collaborative-wide meetings will be eligible to earn 0.25 engagement points toward their PY24 P4P score, following the completion of a post-meeting survey. Hospitals that send a site representative to BOTH of MVC’s 2024 collaborative-wide meetings and complete both post-meeting surveys will be eligible to earn 0.75 engagement points toward their PY24 P4P score. View all eligible engagement activities for PY24 engagement points here.

REGISTER NOW

0
View Post
MVC Coordinating Center Releases 2023 Annual Report

MVC Coordinating Center Releases 2023 Annual Report

The Coordinating Center published its 2023 annual report to the MVC website recently. It outlines key successes and activities accomplished last year and the new strategy guiding MVC's 2024 efforts. Read the report below or view the PDF Parts A [LINK] and B [LINK]) now.

0
View Post
MVC Opens Registration for May Collaborative-Wide Meeting

MVC Opens Registration for May Collaborative-Wide Meeting

Registration is now open to join the MVC Coordinating Center for its spring collaborative-wide meeting on Friday, May 10, from 10 a.m. to 3 p.m. at the H Hotel in Midland, MI. This meeting's agenda is focused on promoting care coordination across the continuum, and will feature unblinded MVC data, member presentations on quality improvement strategies and programs, networking opportunities, and insights about improving value-based healthcare. Members and partners may register here.

Discounted Hotel Room Rate

The event will occur at The H Hotel in Midland, MI, 111 W. Main St., Midland, MI. If you plan to stay overnight at the H Hotel, please book your stay directly through MVC's H Hotel room block.

P4P Updates, Unblinded Data, & Networking

The MVC team will share updates on team activity, including the MVC Component of the BCBSM P4P Program. MVC will also share report and data insights, initiative resources, and an unblinded data presentation. Attendees will have several opportunities to network with peers from hospitals, physician organizations, and Collaborative Quality Initiatives (CQIs) from across the state of Michigan via a poster session and roundtable discussions.

In the coming weeks, MVC will share a finalized agenda with speaker details and other updates on its collaborative-wide meeting webpage.

P4P Engagement Points

Hospitals that send a site representative to one of MVC’s 2024 collaborative-wide meetings will be eligible to earn 0.25 engagement points toward their PY24 P4P score, following the completion of a post-meeting survey. Hospitals that send a site representative to BOTH of MVC’s 2024 collaborative-wide meetings and complete both post-meeting surveys will be eligible to earn 0.75 engagement points toward their PY24 P4P score. View all eligible engagement activities for PY24 engagement points here.

REGISTER NOW