0
View Post
MVC Shares New COPD Report with Physician Organizations

MVC Shares New COPD Report with Physician Organizations

This week the Michigan Value Collaborative (MVC) introduced a new push report for its physician organization (PO) members focused on chronic obstructive pulmonary disease (COPD), providing a tailored version for each of MVC’s 40 PO members. This new push report was created in response to member interest in improving the quality of care for chronic diseases. It utilized 30-day claims-based COPD episodes from Medicare Fee-For-Service, Blue Cross Blue Shield of Michigan (BCBSM) PPO Commercial, and BCBSM Medicare Advantage with index admissions from 1/1/19 to 6/30/21.

One feature the MVC Coordinating Center is excited to highlight is the inclusion of 30-day readmission rates by major comorbidity categories for COPD. Rates were assessed for a PO’s attributed COPD patients overall as well as for attributed patients with congestive heart failure, diabetes, and vascular disease (see Figure 1). These comorbidities are assessed using diagnosis codes on claims in the six months prior to the patient’s index hospitalization.

Figure 1.

Also featured in this report were 90-day rates of pulmonary rehabilitation utilization following COPD index hospitalizations. This is the first time MVC has included a measure of pulmonary rehabilitation utilization in a collaborative-wide report, and the Coordinating Center hopes that this metric will encourage increased use of this important program across Michigan. Across all COPD episodes in the report, the collaborative-wide rate of pulmonary rehabilitation for PO-attributed patients was 2.7% (see Figure 2).

Figure 2.

Due to the low collaborative-wide rate, the Coordinating Center assessed 90-day utilization of pulmonary rehabilitation rather than 30-day utilization. However, the American Thoracic Society recommends the initialization of pulmonary rehabilitation within three weeks following hospitalization. Click here to learn more about American Thoracic Society recommendations for pulmonary rehabilitation and other care following COPD hospitalization.

Each PO’s complete report also includes figures illustrating average price-standardized risk-adjusted 30-day total episode payments, average index hospitalization length of stay, trends in readmission rates, rates and payments of post-acute care utilization, rates of outpatient follow-up, and patient population demographics. A patient population snapshot table details several demographic variables, including a variable based on data from the Economic Innovation Group’s Distressed Communities Index (DCI). It identifies the proportion of patients living in an “at-risk” or “distressed” zip code across all payers (see Figure 3). The DCI is derived from the U.S. Census Bureau’s Business Patterns and American Community Survey.

Figure 3.

A second table provides information on index hospital locations of care for the PO’s attributed patients, comparing the percent of patients treated at each site as well as each index hospital’s average 30-day total episode payment.

The COPD PO report is also being shared with members of the newly established lung care Collaborative Quality Initiative, commonly referred to as INHALE (Inspiring Health Advances in Lung Care). INHALE focuses on patients with asthma and COPD. They disseminate strategies to improve outcomes in these patient populations and reduce the costs associated with asthma/COPD care.

MVC also partnered with a fellow Collaborative Quality Initiative to provide POs with a provider resource that may be relevant to their work with COPD patients. The Healthy Behavior Optimization for Michigan (HBOM) team provided its Quit Smoking Resource Guide to send alongside MVC’s report. HBOM aims to ensure that all smokers who are interested in quitting receive the support and resources they need to be successful. Read more about HBOM’s materials and efforts on the HBOM website or in MVC’s May spotlight blog.

If you have any suggestions on how these reports can be improved or the data made more actionable, the Coordinating Center would love to hear from you. MVC is also seeking feedback on how collaborative members are using this information in their quality improvement projects. Please reach out at Michigan-Value-Collaborative@med.umich.edu.
0
View Post
MVC Launches Hysterectomy Report Tailored to PO Members

MVC Launches Hysterectomy Report Tailored to PO Members

Earlier this week, the MVC Coordinating Center shared a new hysterectomy report with physician organizations (POs). This is the third report MVC has created specifically for its PO membership; MVC launched a joint replacement report in 2021 and a colectomy report earlier this year.

Hysterectomies were identified as a focus area in partnership with POs, who expressed an interest in more reports on surgical conditions. In addition to being surgical, hysterectomy aligns with PO activity for a Blue Cross Blue Shield of Michigan (BCBSM) Physician Group Incentive Program (PGIP) women’s health initiative. To align with the metrics used by this BCBSM PGIP initiative, this report was limited to women aged 18 to 64. The report incorporated claims from 1/1/19 – 6/30/21 for BCBSM PPO Commercial and BCBSM Medicare Advantage. Information on common comorbidities was included, as well as a patient population snapshot table showcasing race-based demographics in the hysterectomy patient population.

Several comparison groups were used to stratify data throughout the report. Those comparison groups included:

  • All MVC POs
  • INDEPENDENT PO: As defined in the BCBSM PGIP 2021 physician list, POs with less than 50% are considered independent.
  • PO SIZE: These groups were based on the number of attributed members at each PO. Member reports include a PO size comparison group in which they belong so they can compare their performance to POs of a similar size.

Hysterectomy can be performed laparoscopically, abdominally, or vaginally. Since these modes of hysterectomy can impact clinical outcomes, many of the metrics in the latest MVC report were stratified this way. Across all MVC POs, hysterectomies were most commonly performed laparoscopically and least commonly performed abdominally.

This report included measures on total 30-day episode payments, length of stay, and medical and surgical complication rates. The average price-standardized risk-adjusted total episode payment was $8,562, and the average index length of stay was 2.1 days (see sample figures from a blinded report in Figure 1).

Figure 1.

Medical complications included venous thromboembolism, coronary vascular events, cardiac events (angina, myocardial infarction, cardiac arrest, and heart failure), gastrointestinal events (obstruction and abdominal pain), kidney failure, pulmonary events (pneumonia and respiratory failure), and transfusion reaction. Surgical complications included intraoperative injuries, hemorrhage, shock, surgical site infection (including sepsis), and complications related to wound healing (fistula, hernia, foreign body left during procedure). Medical and surgical complications were identified with ICD-10 diagnosis codes. The overall complication rate across all MVC POs was 28.5%. Surgical complications occurred more frequently than medical complications with rates of 23% and 9%, respectively (see Figure 2).

Figure 2.

Preoperative testing rates were also incorporated since some of these types of tests are commonly ordered prior to hysterectomies but may not be clinically indicated. Claims for the index event as well as 30 days prior to the procedure were evaluated for electrocardiograms, x-rays, urinalysis, blood tests, and basic metabolic panels. These tests were identified using CPT codes, which do not distinguish between testing for preoperative purposes and testing for other reasons. Tests that were performed in the emergency department or inpatient setting were not included. Across all MVC POs, the most common types of preoperative tests performed were blood testing (which includes complete blood count, basic metabolic panel, and coagulation tests) and basic metabolic panels. The least common types of preoperative tests that were utilized were X-rays and urinalysis testing (Figure 3).

Figure 3.

To ensure the continued provision of the highest quality information, MVC engages regularly with PO members to drive the formation and improvement of PO-specific reports. If you are interested in sharing feedback about these new PO reports, have any specific PO analytic requests, are undergoing new PO improvement initiatives, and/or would like more information about MVC, please reach out to the Coordinating Center at michiganvaluecollaborative@gmail.com.

0

MVC Launches New Physician Organization Reports

The goal of the Michigan Value Collaborative (MVC) is to improve the health of Michigan through sustainable high-value healthcare. The primary focus at inception in 2013 was the development of hospital based metrics to improve patient outcomes, reduce healthcare costs, and encourage hospitals to collaborate in best practice sharing. With the knowledge that hospitals are not the healthcare entity capable of such changes, MVC invited Physician Organizations (POs) to join the collaborative towards the end of 2018.

To date, PO members have been able to see hospital level data for their attributed facilities. This has proved helpful for our PO members but we have heard consistent feedback that being able to view metrics that display a PO’s specific attributed patient population would be welcome. This value added request was appreciated by MVC, and so the Coordinating Center began a collaboration with representatives from the Blue Cross Blue Shield of Michigan (BCBSM) Physician Group Incentive Program (PGIP) to develop new PO patient specific metrics. MVC has also engaged other parties in the development of these new metrics, including the Michigan Data Collaborative (MDC) and hearing directly from our PO members.

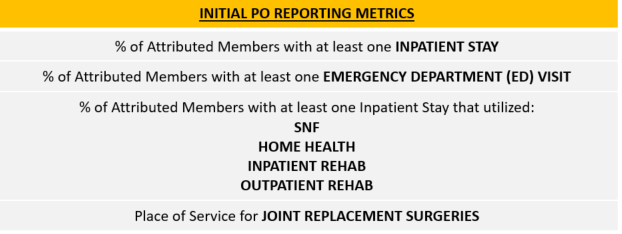
As a result of this collaboration, the first MVC PO population level report, containing data for both BCBSM PPO Commercial (Comm) and BCBSM Medicare Advantage (MA) between 1/1/19 and 12/31/19, was sent out to all 40 MVC PO members on Tuesday, April 20, 2021. The report contains data on health care utilization and allows POs to benchmark themselves against all MVC participating physician organizations for the metrics listed in Table 1.

Table 1. Initial PO Reporting Metrics

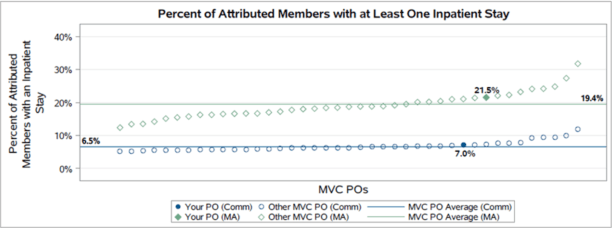
Each metric was stratified by payer to account for differences in patient populations, as well as to serve as a proxy for age stratification (Figure 1).

Figure 1. Sample PO Metric: Percent of Attributed Members with at Least One Inpatient Stay

As engagement with our PO members builds, and further feedback and requests are processed, MVC plans to continue to build on the metrics highlighted in this report. As the most recent reports are at a population level, the Coordinating Center intends to delve further into the metrics for more granular level detail.

If you are interested in sharing feedback about the PO reports, have any specific analytic requests, and/or would like more information about the Michigan Value Collaborative,  please reach out to the Coordinating Center at michiganvaluecollaborative@gmail.com.