0
View Post
October MVC Workgroups Highlight Hospital Care at Home and Sepsis Compliance Work

October MVC Workgroups Highlight Hospital Care at Home and Sepsis Compliance Work

Last month, MVC hosted virtual presentations for a health in action workgroup as well as a sepsis workgroup. MVC hosts two virtual workgroups per month with topics rotating between post-discharge follow-up, sepsis, cardiac rehabilitation, rural health, preoperative testing, and health in action (ad hoc focused topics). Each month, the MVC Coordinating Center publishes key highlights from these presentations to support resource sharing and collaboration across the state.

October Health in Action Workgroup: University of Michigan Health

In early October, MVC’s health in action workgroup focused on Hospital Care at Home (HCAH) and featured a presentation by Jessie DeVito, Administrative Director of HCAH at University of Michigan Health. DeVito’s presentation reviewed University of Michigan Health’s HCAH program from inception in 2019 through relaunch in February 2024, including valuable insights into their program development and implementation.

University of Michigan Health piloted their HCAH program in coordination with Blue Cross Blue Shield Commercial, and then expanded payer coverage to Medicare once the Centers for Medicare & Medicaid (CMS) established the Acute Hospital Care at Home Waiver during the COVID-19 pandemic. The intent for the HCAH program was to alleviate significant capacity issues within the brick-and-mortar hospital. By reviewing inpatient cases that met specific HCAH criteria, patients were able to continue necessary inpatient care at home while hospital beds were made available for more acute care needs.

Due to logistical and management barriers, the HCAH program decided to partner with an external vendor, Medically Home, in late 2023 to meet the needs of their patients and provide more in-home inpatient care and services. This vendor manages a 24/7 care team model, including a virtual hospitalist team, while providing services such as mobile diagnostics (e.g., X-ray, ultrasound), paramedicine, STAT labs and IV, and offering pathways to in-hospital services such as MRI or CT scans (Figure 1).

Figure 1.

The HCAH program has seen a maximum daily census of 10 patients and has an average length of stay of approximately 4 days. Patients who participated in the program had a lower 30-day readmission rate (17%) compared to patients who stayed in the hospital (20-24%). This correlates with a recent report from CMS on HCAH service data showing reduced 30-day readmission rates in most of the associated diagnosis related groups (DRGs) (Centers for Medicare & Medicaid Services, 2024) and is a promising trend for future program development.

One of the challenges the HCAH program faced was engaging providers in utilizing the at-home inpatient service. One proposed solution is to offer education and useful tools within the EPIC medical record, allowing providers to track which patients meet eligibility criteria and make appropriate referrals to the program. Additionally, once providers are educated on the HCAH program, they can share and educate their patients about this care option. By continuing to engage and educate providers and patients, the HCAH program anticipates continued expansion, with a goal to cover a broader patient population with increased payer coordination.

Oct. 8 Heath in Action Workgroup

October Sepsis Workgroup: Garden City Hospital

The second October workgroup focused on sepsis, one of MVC’s value metrics within the MVC Component of the BCBSM P4P Program. This workgroup featured a presentation by Akhil Vijay, Director of Quality Assurance and Performance Improvement at Garden City Hospital. Vijay’s presentation reviewed Garden City Hospital’s sepsis care program, sharing their development process and progress since the program’s implementation.

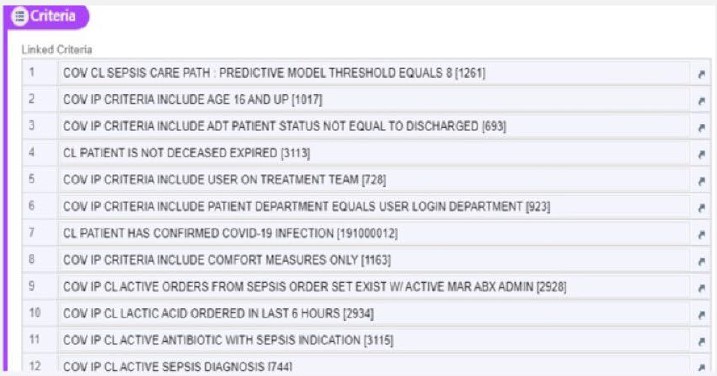
Following CMS and the Joint Commission's Sepsis Core Measure launch in 2015, Garden City Hospital has worked to build an effective sepsis care program reflective of all core elements (Figure 2). Starting in February 2024, their sepsis compliance rate was approximately 46%. After meeting with leadership, a root cause analysis was completed to determine why the compliance rate was low compared to the national average.  Building a partnership between leadership and providers proved to be a key strategy for successfully establishing weekly quality meetings to review sepsis cases and identify patterns of fallouts.

Figure 2.

Common case fallouts that were identified included delay in fluid/medication administration, missed labs or delays in results, incorrect antibiotic prescription, and no follow-up blood pressure reading after the patient received a required bolus. Using this information, the quality team was able to structure a successful follow-up plan to address sepsis case compliance issues (Figure 3).

Figure 3.

The quality team developed several methods for engaging leadership and providers in the program, such as:

  • developing an interdisciplinary sepsis committee to review cases,
  • following a standardized approach for case review with action plan development,
  • presenting sepsis cases at weekly didactic resident physician meetings,
  • and attending rounds with an infection prevention specialist to educate providers.

In addition to making this case education more visible in providers’ daily work, the program shared sepsis case scorecards with providers highlighting successes and areas for improvement. This in turn motivated the healthcare team to engage in friendly competition to achieve the best results.

Since January 2024, Garden City Hospital has improved its sepsis compliance, going from approximately 45% in January to a monthly average of approximately 63% by September 2024.

If you are interested in pursuing a sepsis care improvement program, MVC has a robust registry of medical insurance claims data that can be utilized as well as data specialists to help navigate and create custom analytic reports. Please reach out to the Coordinating Center [email] if you would like to learn more about MVC data or engagement offerings.

Oct. 17 Sepsis Workgroup

To learn more about the efforts showcased by University of Michigan Health, Garden City Hospital, or other past workgroup presentations, visit MVC’s YouTube channel here.

November’s workgroups include a preoperative testing presentation that occurred Nov. 5 with a presentation by Pam Racchi, BSN, RN, Clinical Site Coordinator with the Michigan Surgical Quality Collaborative. MVC will also host a cardiac rehabilitation workgroup on Nov. 21. You can view the complete 2024 and 2025 event calendars here.

0
View Post
MVC Refreshes Sepsis Push Reports for Hospital Members

MVC Refreshes Sepsis Push Reports for Hospital Members

The Michigan Value Collaborative distributed refreshed sepsis push reports this week, providing its hospital members with updated figures and measures using the latest MVC episode data. In addition, the latest reports were also distributed to members of the Michigan Hospital Medicine Safety Consortium (HMS), a valued partner in the initial development of this service line within MVC's registry.

This week’s reports included MVC’s updated race and ethnicity categories, which were modified and expanded to ensure greater inclusivity and accuracy. MVC also recently adopted a methodological change to its identification of patients admitted with COVID-19 that impacted the episode data used in this analysis. MVC episodes were flagged as containing significant COVID-19 care if a COVID-19 diagnosis (U07.1) was found in the primary diagnosis code position on a facility claim during the 90-day episode. Previously, MVC looked for COVID-19 diagnosis in the first three diagnosis code positions. These episodes are often excluded from MVC’s push reports but have historically been included in sepsis reporting to help hospitals gauge the impact of COVID-19 diagnosis on their sepsis metrics. Combined with the natural decline in disease prevalence, there was a significant reduction in the percentage of patients with a COVID-19 diagnosis who were treated for sepsis, compared to the previous reporting period.

The version shared with MVC members this week continued to provide price-standardized, risk-adjusted benchmarking for total episode payments, as well as length of inpatient stay, Intensive Care Unit (ICU)/Cardiac Care Unit (CCU) utilization, inpatient mortality or discharge to hospice, 90-day post-acute care utilization, and 90-day readmission rates. MVC’s general acute care hospital (GACH) and Critical Access Hospital (CAH) members were provided with tailored versions using comparison groups most suitable to their hospital category.

Sepsis is currently the third leading cause of death in U.S. hospitals, so inpatient mortality and discharge or hospice were included in MVC’s sepsis reports as important quality checks. The average inpatient mortality rate among patients hospitalized for sepsis was 13.3% across member GACHs (Figure 1) and 6.5% for CAHs (Figure 2). Rates for discharge to hospice at home or a medical facility were lower.

Figure 1.

Figure 2.

The latest report also investigated differences in 90-day readmission rates for patients hospitalized for sepsis. Within GACH, patients with Medicare FFS coverage exhibited the highest average readmission rate (30.4%), followed by patients insured by BCBSM/BCN MA plans (25.6%) and BCBSM/BCN Commercial plans (16.4%), respectively (Figure 3). BCBSM/BCN Commercial patients had a younger average age and lower average comorbidity count than patients with Medicare or MA plans. Within CAHs, the average 90-day readmission rate was 22.4%.

Figure 3.

The report also included benchmarking for average index length of stay by specific payer groups as well as for all payers combined. The average index length of stay across all payers was 8.7 among GACH patients and 5.5 among CAH patients.

Another significant finding was the difference in post-acute care utilization by service type among patients hospitalized for sepsis (Figure 4). On average across GACHs in the collaborative, outpatient services had a noticeably higher utilization rate (59.3%) compared to home health (29.4%) or skilled nursing facility (21.9%). The same was true for CAHs (Figure 5), with a much higher average utilization rate for outpatient services (75.2%) compared to home health (29.5%) or skilled nursing facilities (18.6%).

Figure 4.

Figure 5.

These reports were prepared using 90-day MVC episode data with index admissions from 7/1/19 – 6/30/22 for the following insurance plans: Medicare Fee-For-Service (FFS), Blue Cross Blue Shield of Michigan (BCBSM) PPO Commercial, Blue Care Network (BCN) Commercial, BCBSM PPO Medicare Advantage (MA), and BCN MA.

MVC welcomes your recommendations for enhancing these reports and welcomes your feedback on how collaborative members are using these data to support their quality improvement efforts. Please don't hesitate to contact the MVC team at Michigan-Value-Collaborative@med.umich.edu.

0
View Post
MVC’s SNF and HH Push Report Latest in Post-Discharge Insights

MVC’s SNF and HH Push Report Latest in Post-Discharge Insights

MVC released another new push report recently with the first iteration of a skilled nursing facility (SNF) and home health focused report. MVC members frequently identify post-discharge care and SNF utilization as focus areas for quality improvement; therefore, this report was developed to help hospitals benchmark their performance in this area and identify opportunities to improve care coordination. Critical access hospitals (CAHs) received a tailored version of the report to allow for metric comparisons to only other CAHs.

This report highlighted various SNF and home health utilization metrics using 30-day claims-based episodes for MVC’s medical conditions: acute myocardial infarction (AMI), atrial fibrillation, chronic obstructive pulmonary disease (COPD), congestive heart failure (CHF), endocarditis, pneumonia, sepsis, small bowel obstruction, and stroke. Patient episodes were included if they had an inpatient admission between 1/1/2021 and 6/30/2022 and had one of the following insurance plans: Blue Care Network (BCN) HMO Commercial or Medicare Advantage (MA), Blue Cross Blue Shield of Michigan (BCBSM) PPO Commercial or MA, or Medicare Fee-for-Service (FFS).

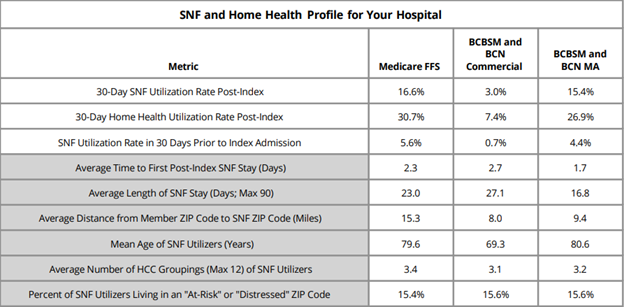
The first page of the report contained a SNF and home health profile table (Figure 1), which included nine metrics designed to give an overall look at post-discharge utilization patterns as well as information about a given hospital’s patient population. The first three metrics reflected all patients treated for medical conditions in this time period for the included payers and the metrics in gray were comprised only of patients that utilized SNF in the 30 days post-discharge from their episode's index hospitalization. Overall, MVC found that Medicare FFS patients utilized SNF and home health services more often than other payers. For CAHs, this table was not separated by payer.

Figure 1.

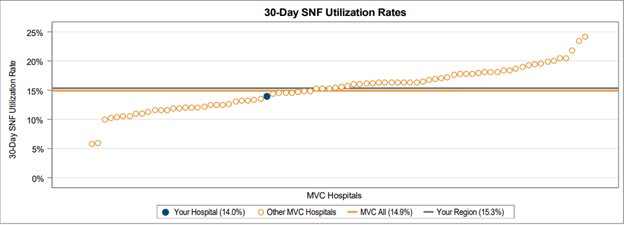
On the subsequent pages, 30-day overall SNF and home health utilization rates were provided in a caterpillar plot format to showcase variation across the collaborative (Figure 2). These rates varied between 5% and 25% for SNF utilization and between 10% and 40% for home health utilization.

Figure 2.

MVC also provided 30-day SNF and home health utilization rates broken out by condition to allow each hospital to benchmark rates across their site’s medical service lines and compared to the MVC average rate for each condition (Figure 3). Medical conditions were only included in this figure if a hospital had at least 11 cases between 1/1/2021 and 6/30/2022. On average across the collaborative, the highest 30-day post-discharge SNF utilization rates were observed in endocarditis (28%), sepsis (19.5%), and stroke (19.5%) patients.

Figure 3.

Hospitals also received a table identifying the most frequently utilized SNFs from a medical condition episode to help sites understand where their patients are going when receiving SNF care after discharge. A similar table was shown for home health providers.

The final page of the report included four caterpillar plots tailored to specific denominators. This included 30-day SNF and home health utilization rates for the cohort of patients discharged home. It also included readmission rates for patients who were discharged to SNF and readmission rates for patients discharged to home health. These plots were included to inform each hospital about patterns in their transitions of care and readmissions. There was significant variability in readmission rates following discharge to either a SNF or home health facility, with some hospitals averaging close to 5% readmission rates and some hospitals seeing an average of nearly 40% of patients readmitted during the 30-day post-discharge window (Figure 4).

Figure 4.

As part of its new Lunch & Learn series, MVC recently hosted a session focused on MVC data that included a walkthrough of its SNF/HH report and a deeper dive into those report metrics using MVC’s registry. Those who were unable to attend can watch a recording of the presentation here, which demonstrates how to replicate aspects of the push report on MVC’s registry in order to view additional episode spending and patient-level data.

If you have any questions or feedback about this report, please reach out to the MVC Coordinating Center.

0
View Post
Latest Sepsis Report Compares Medicare Advantage and Medicare FFS Patient Outcomes

Latest Sepsis Report Compares Medicare Advantage and Medicare FFS Patient Outcomes

The Michigan Value Collaborative distributed refreshed push reports this week for its sepsis service line, providing hospital members with updated figures and measures since the last refresh in April.

The version shared with members this week compares MVC hospitals on 90-day risk-adjusted total episode payments, inpatient length of stay, Intensive Care Unit (ICU)/Cardiac Care Unit (CCU) utilization, inpatient mortality and discharge to hospice, 90-day post-acute care utilization, and 90-day readmission rates. Each figure presented reflects 90-day episodes with index admissions from 7/1/18 – 6/30/21 for Medicare Fee-For-Service (FFS), Blue Cross Blue Shield of Michigan (BCBSM) PPO Commercial, Blue Care Network (BCN) Commercial, BCBSM PPO Medicare Advantage (MA), and BCN MA. Most of the measures also include comparison groups for the "MVC All” average across the collaborative as well as the average for each hospital’s assigned geographic region of Michigan.

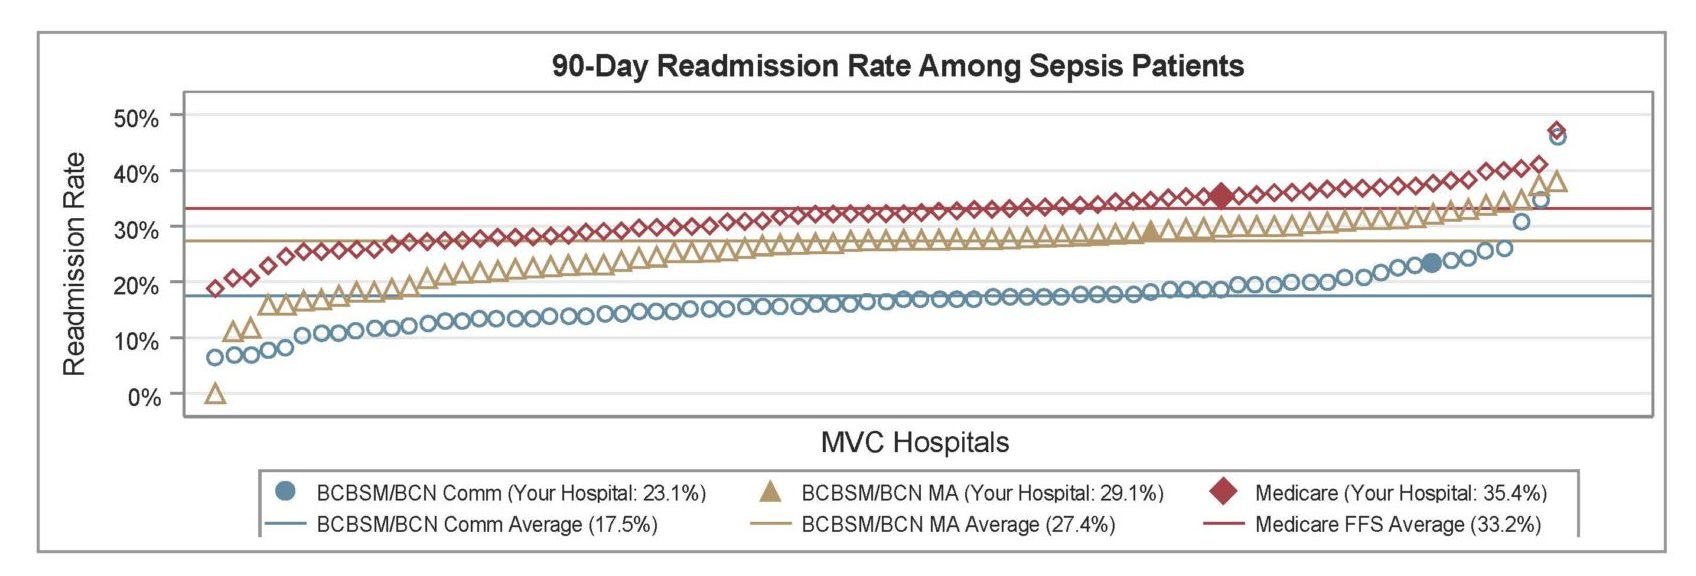
This week’s reports stratified many measures by BCBSM/BCN Medicare Advantage and traditional Medicare FFS to investigate differences in outcomes and utilization between these two patient groups. MA saw large increases in yearly enrollment over the last decade, resulting in a growing interest in the difference in quality and cost measures compared to traditional Medicare FFS. Recent research suggested that MA patients experience better outcomes and cost less. This held true for some of the measures in MVC’s latest report. Despite the fact that the MA population is older (77 years) than the Medicare FFS population (72 years), the 90-day readmission rate (see Figure 1) among Medicare FFS sepsis patients was higher (33%) than that of MA sepsis patients (27%).

Figure 1.

Other noticeable differences between the patient populations included disease burden and social barriers. The Medicare FFS population had a greater comorbidity burden than the MA population; 57% of MA patients had three or more comorbidities whereas 61% of the Medicare FFS population had three or more comorbidities. The Medicare FFS population was also more likely to reside in an at-risk or distressed Zip code according to the Distressed Communities Index (37% vs. 31%).

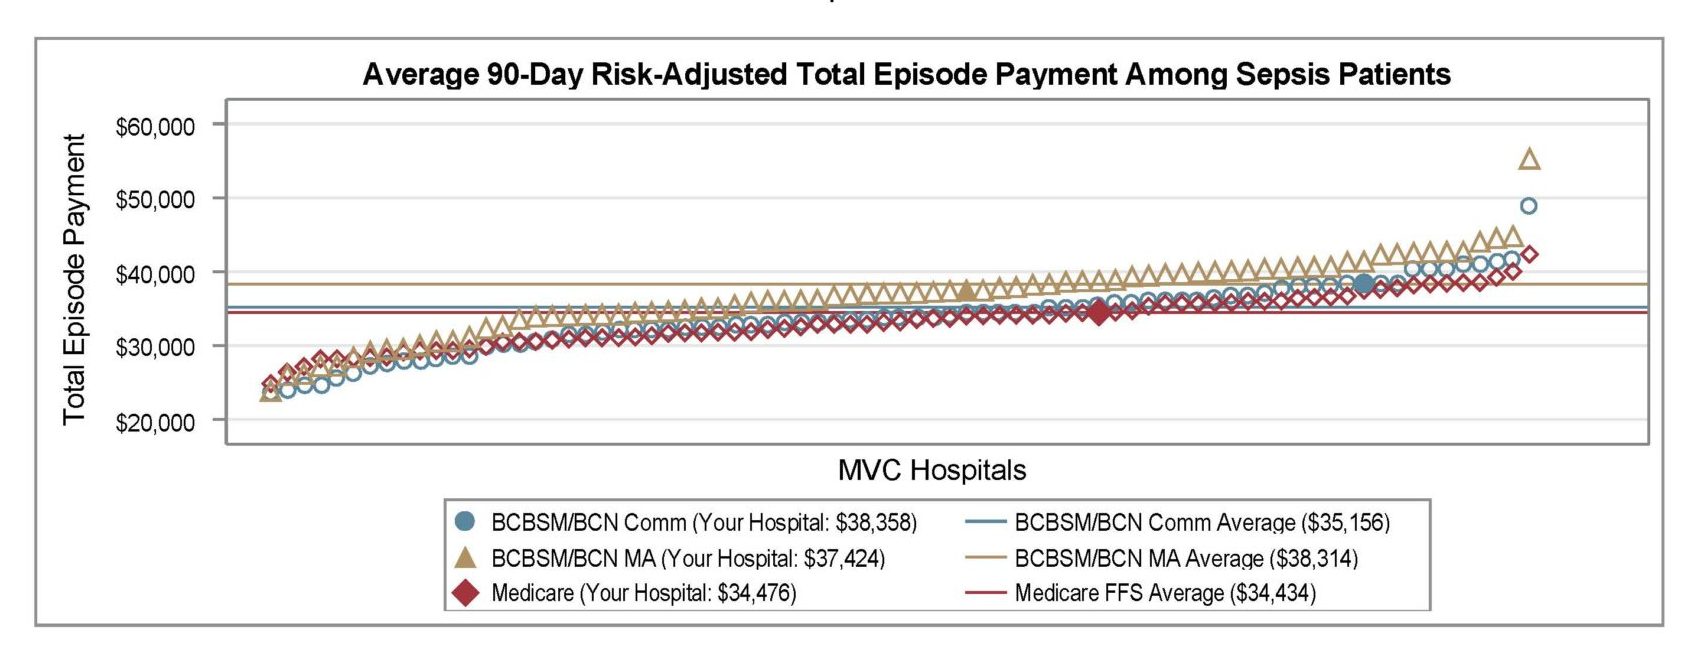
Interestingly, the average 90-day risk-adjusted total episode spending payment among sepsis patients was higher for MA ($38,314) than Medicare FFS ($34,434) (see Figure 2). However, the claims data used in MVC’s report were both price standardized and risk adjusted, so dollars are actually a proxy for healthcare utilization. When taking into account patient factors and payer, BCBSM/BCN MA sepsis patients used more resources than Medicare FFS sepsis patients. Without taking patient factors and payer into account, Medicare FFS sepsis patients used more resources than BCBSM/BCN MA sepsis patients.

Figure 2.

Hospitals can learn more about the differing demographics of these two populations and their BCBSM/BCN commercial counterparts in their patient population snapshot table, a figure that was carried forward from the April reports. The latest reports included additional rows for the rate of septic shock and for the percentage of patients living in an “at-risk” or “distressed” Zip code. The latter is determined by the Economic Innovation Group’s Distressed Communities Index (DCI) data set, which incorporates economic indicators such as education, employment, and income to categorize patient Zip codes as prosperous, comfortable, mid-tier, at-risk, or distressed. The population snapshot table was intended to help hospitals better understand their sepsis patient population. The other demographics included were race, mean age, top three patient Zip codes, the most frequent and average number of comorbidities, and the proportion of patients with a confirmed diagnosis of COVID-19.

The inclusion of COVID-positive patient percentages is an important statistic in the patient population snapshot table since the report included COVID patients. Knowing this percentage could help hospitals understand the extent to which their data is driven (or not) by patients with a confirmed COVID-19 diagnosis.

The latest sepsis reports were also distributed to members of the Michigan Hospital Medicine Safety Consortium (HMS), which partnered with MVC on the original development of this service line for MVC’s registry. MVC plans to provide system-level versions of the latest sepsis report in the coming weeks.

If you have suggestions on how these reports can be improved or the data made more actionable, the Coordinating Center would love to hear from you. We are also seeking feedback on how collaborative members are using this information in their quality improvement projects. Please reach out at Michigan-Value-Collaborative@med.umich.edu.

0
View Post
MVC and Members Promote Sepsis Awareness Month

MVC and Members Promote Sepsis Awareness Month

Throughout the month of September, providers and advocacy groups are calling attention to the prevalence and signs of sepsis, the body’s life-threatening response to infection. It is the leading cause of death in U.S. hospitals, taking the life of a patient every two minutes and affecting an estimated 49 million people every year worldwide. Despite this, at least one in every three adults has never heard of sepsis. That is why in 2011 the Sepsis Alliance officially designated September as Sepsis Awareness Month.

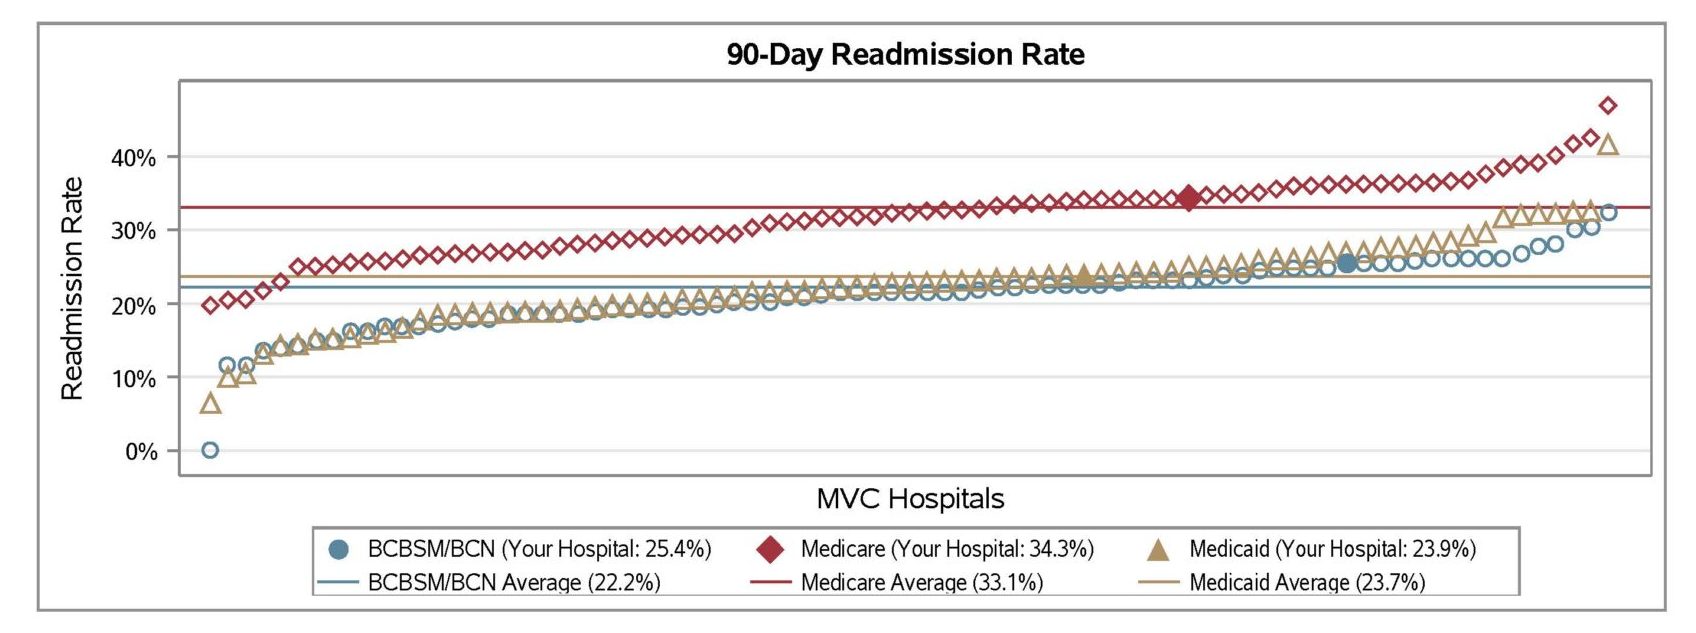
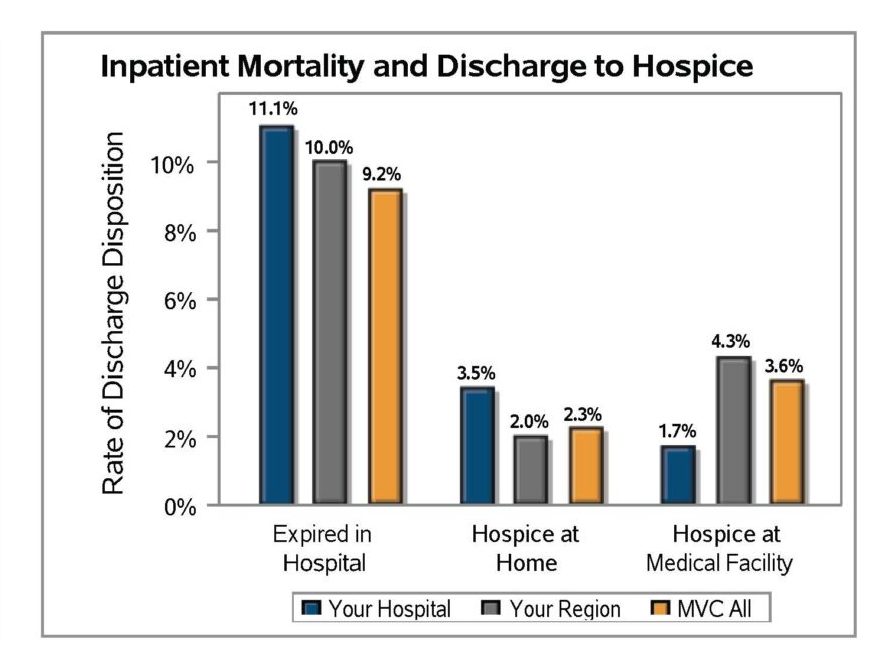
To support its member hospitals in improving their outcomes related to sepsis, MVC collaborated with the Michigan Hospital Medicine Safety Consortium (HMS) in 2019 to develop a sepsis episode definition for its registry. MVC then began distributing sepsis push reports in 2020 with regular refreshes each year. Hospitals received their latest sepsis reports in April, which showcased wide variation across the Collaborative for measures such as total episode payments and 90-day readmission rates (see Figure 1). In addition, hospitals received details on their inpatient mortality and discharge to hospice rates compared to their geographic region and the Collaborative as a whole (see Figure 2). More information about this report was detailed in a previous MVC blog post.

Figure 1.

Figure 2.

MVC also began hosting a sepsis workgroup in June 2019 to help facilitate idea and practice sharing among Collaborative members. MVC has continued to host sepsis workgroups since then, with the most recent workgroup taking place last week on September 8. That workgroup honored Sepsis Awareness Month with a member panel featuring guest speakers from several health systems in Michigan. Attendees learned about current sepsis initiatives underway at hospitals throughout the state as well as insights on the impact of COVID-19, sepsis screening, sepsis bundle compliance, transitions of care, and other related topics. Those unable to attend can view the complete recording of this panel and discussion here.

One area of focus for this year’s Sepsis Awareness Month is a Sepsis Alliance tool to help providers remember the signs and symptoms. Their acronym approach asks providers to remember, “It’s about T-I-M-E,” with the word “time” representing temperature, infection, mental decline, and extremely ill (see Figure 3).

Figure 3.

This resource and many others have been created, collated, and packaged by the Sepsis Alliance in their yearly Sepsis Awareness Month Toolkit. Hospitals and providers are encouraged to utilize these resources to help educate their staff and patients. The hope is that through public education we can raise awareness of the signs and symptoms of sepsis so people in our communities know when to seek emergency care. Together, we can help save lives and limbs from sepsis. Learn more at sepsisawarenessmonth.org. To contact the MVC Coordinating Center about your sepsis reports, future workgroup speakers, or other questions, please email michiganvaluecollaborative@gmail.com.

0
View Post
Sepsis Push Reports Include Demographics, COVID Patients

Sepsis Push Reports Include Demographics, COVID Patients

For the last two years, the Michigan Value Collaborative (MVC) Coordinating Center has offered a sepsis service line developed in partnership with the Michigan Hospital Medicine Safety Consortium (HMS). In conjunction with this work, reports customized to each member hospital are distributed each year. The most recent iteration shared with members this week features several updates from the 2021 versions.

A new patient population snapshot table is one new feature that the MVC Coordinating Center added in order to integrate its demographic data. These tables (see Figure 1 for a sample table of a blinded acute-care hospital) provide each hospital with demographics for their sepsis patient population, including race, mean age, top patient zip codes, the most frequent and average number of comorbidities, the proportion of dual-eligible patients, and the proportion of patients with a confirmed diagnosis of COVID-19. Furthermore, this data is stratified by payer, providing additional insights into specific groups of patients.

Figure 1.

The inclusion of COVID-positive patient percentages is an important statistic since this iteration of the sepsis push report includes COVID patients, whereas the Coordinating Center removed these patients in previous versions. This final row of the patient population snapshot table will help hospitals understand the extent to which their data is driven (or not) by patients with a confirmed COVID diagnosis code. Across the collaborative, 90-day total episode payments increased in 2020, which can likely be attributed to episodes with a COVID diagnosis; however, the 2020 average is not much higher than the average from 2018 through early 2019 (see Figure 2). Since the COVID-19 pandemic hit regions of Michigan at different times, regional comparisons for select measures will be particularly useful in understanding one’s data. Different versions of the report were created for acute-care and critical access hospitals, which allowed for tailored comparison groups.

Figure 2.

The complete report compares MVC hospitals on 90-day risk-adjusted total episode payments, inpatient length of stay, Intensive Care Unit (ICU)/Cardiac Care Unit (CCU) utilization, inpatient mortality and discharge to hospice, 90-day post-acute care utilization, and 90-day readmission rates. Each figure presented reflects index admissions from 1/1/18 – 12/31/20 for Medicare FFS, Blue Cross Blue Shield of Michigan (BCBSM) PPO Commercial, Blue Care Network (BCN) Commercial, BCBSM PPO Medicare Advantage, BCN Medicare Advantage, and Medicaid.

In addition to continuing to offer its sepsis push reports, the MVC Coordinating Center also offers a bimonthly sepsis workgroup. The next workgroup will take place on Thursday, May 26 from 2-3 p.m., and will feature a presentation about successes in sepsis-bundle compliance. Register today to join the MVC Coordinating Center for this presentation and discussion.

If you have any suggestions on how these reports can be improved or the data made more actionable, the Coordinating Center would love to hear from you. We are also seeking feedback on how collaborative members are using this information in their quality improvement projects. Please reach out at michiganvaluecollaborative@gmail.com.

0

2021 Surviving Sepsis Campaign Guidelines Reviewed at Workgroup

On December 7, 2021, the Michigan Value Collaborative (MVC) held its bi-monthly virtual workgroup on sepsis featuring Dr. Hallie Prescott, Associate Professor at Michigan Medicine and the physician lead on the Michigan Hospital Medicine Safety Consortium (HMS) Sepsis Initiative. For this MVC and HMS co-sponsored workgroup, Dr. Prescott presented Updates in Sepsis: What is new in 2021 SSC Guidelines. Dr. Prescott is a pulmonary and critical care medicine specialist, and she practices clinically in the intensive care units at the University of Michigan Health and Ann Arbor Veterans Affairs hospitals. She is co-chair of the Surviving Sepsis Campaign Adult Guidelines and a council member of the International Sepsis Forum.

The workgroup began with an introduction to the International Surviving Sepsis Campaign (SSC) guidelines and bundles, which are resources and implementation tools used to reduce sepsis and septic shock worldwide. The SSC Guidelines were originally published in 2004 and have been updated every four years, with the most recent edition being published in October 2021. A large panel of experts collaborates to evaluate the evidence and make recommendations (scaled by the strength of recommendation). Since their initial publication, health systems from the United States to Spain have used the SSC guidelines and tools to improve sepsis and septic shock care and outcomes.

Dr. Prescott’s presentation describing the SSC 2021 Adult Guidelines highlighted several recommendations and detailed the reasoning behind some of the changes made since 2016. The highlighted guidelines included recommendations for infection (antibiotic timing, use of antimicrobials) (see Figure 1), hemodynamics (resuscitative fluids, vasopressor timing), ventilation (ECMO), and additional therapies (IV corticosteroids, IV Vitamin C). In addition, a new section for long-term outcomes (see Figure 2) was also added to the newest guidelines and reviewed during the workgroup, addressing patient education, health and social screenings, and post-discharge follow-up. Out of all the discussed recommendations, the MVC and HMS members in attendance were most interested in antibiotic use, resuscitative fluids, central line use, and treatment prioritization.

Figure 1.

Figure 2.

The updated SSC Guidelines offer informative and valuable recommendations that can be used to improve sepsis care and outcomes. If you were unable to attend the workgroup or are simply interested in reviewing the presentation and discussion, a recording of the workgroup is available here. To read the full published SSC 2021 Adult Guidelines and review additional resources, click here.

The MVC Coordinating Center is interested in hearing how your organization has utilized the SSC 2021 Adult Guidelines to improve sepsis care and outcomes. If you would like to present at or attend an upcoming MVC workgroup, please contact the MVC Coordinating Center at the michiganvaluecollaborative@gmail.com.

0

MVC Sepsis Workgroup Review

The Michigan Value Collaborative (MVC) holds bi-monthly virtual workgroups on six different clinical areas of focus. The goals of these workgroups are to help bring collaborative members together to discuss current quality improvement initiatives and/or challenging areas of practice. These six different clinical areas include chronic disease management (CDM), chronic obstructive pulmonary disease (COPD), congestive heart failure (CHF), diabetes, joint, and sepsis. At the most recent MVC sepsis workgroup, the discussion centered around post-sepsis syndrome and how organizations are identifying and caring for patients that are diagnosed with this condition.

The group learnt that for several organizations, post-sepsis syndrome is not well understood, identified, or diagnosed which prompted some interesting discussion around this topic and the topic of sepsis itself. A number of studies have suggested that due to an aging population with an increased number of comorbidities, frequent use of immunosuppression therapy, expanded use of invasive procedures and medical devices, and multi-drug resistance, the incidence of sepsis has increased. However, the same studies share that in-hospital mortality has decreased. Credit for this decrease in mortality is associated with improved detection, establishing treatment earlier, improvements in critical care, and the implementation of evidence-based guidelines established by the Surviving Sepsis Campaign.

While survivors of sepsis have increased, identification of post-sepsis syndrome is garnering attention as many patients can suffer from a number of serious and long-lasting complications including delusions, debilitating muscle and joint pains, extreme exhaustion, poor concentration, reduced cognitive functioning, as well as mental health issues and concerns. Certain patients, such as the elderly, those with a preexisting condition, or those diagnosed with severe sepsis are more likely to develop post-sepsis syndrome.

Currently, the most effective method of treatment for post sepsis syndrome is to prevent an initial incidence of sepsis. Primary prevention includes hand washing, vaccination uptake, and managing any chronic conditions. Pharmacological strategies for the treatment of sepsis and the prevention of post-sepsis syndrome include:

• Antibiotic stewardship, to improve the use of antibiotics and using prolactin levels to decide when to stop antibiotic use.
• The use of H2-receptor agonists over proton pump inhibitors to prevent stress ulcers.
• Low dosage and short-term use of medications.
• Early mobility to prevent functional decline.

Non-pharmacological strategies for the prevention and treatment of sepsis to avert post-sepsis syndrome include:
• Sepsis treatment and the identification of post-sepsis syndrome education for frontline workers.
• Post-sepsis education for family and caregivers of sepsis survivors along with available resources.
• Vision/Hearing Aids to reduce the risk of delirium, as well as adaptive equipment.
• Referral for rehabilitation post sepsis survival.

MVC collaborative members from multiple facilities including Michigan Medicine, Henry Ford Wyandotte, Sparrow, and Spectrum Health discussed different ways in which they are working to identify sepsis as early as possible within their facilities. Many organizations have instituted a sepsis program, and some are looking to onboard a sepsis navigator. Dr. Jessie King, Program Director, shared information about the Post-Intensive Care Unit (ICU) research and treatment clinic (PULSE) now screening discharged ICU patients for post-sepsis syndrome, and the Michigan Medicine return on investment analysis which helped initiate a sepsis program. You can find the recording of the workgroup here.

The MVC Coordinating Center is interested in hearing how you are treating sepsis and the prevention and treatment of post-sepsis syndrome. We would like more hospitals to share the work they are doing around these important topics so if you would like to present at or attend an upcoming MVC workgroup, please email MVC at the michiganvaluecollaborative@gmail.com

0

Michigan Value Collaborative: Sepsis Reports

In early 2020, the Michigan Value Collaborative (MVC) Coordinating Center created a new sepsis service line with the help of the Michigan Michigan Hospital Medicine Safety Consortium (HMS). Initially the service line began with 215,447 episodes and has since grown to 229,673 episodes. In conjunction with the creation of the sepsis service line, reports customized to each collaborative member hospital were developed. The most recent iteration of these, shared in two volumes, were disseminated to members in February 2021.

Each volume of the sepsis reports serves their own unique purpose. The first volume provides a detailed review into specific components of a sepsis episode with the ability for each member to compare individualized information to regional and statewide averages. These metrics help members garner a better understanding of the sepsis patient population from admission to 90-days post discharge with data on length of stay, causes for readmission, and post-acute care utilization. Figure 1 shares information on length of stay, and this example shows Hospital A’s (a fictional institution) average length of stay to be higher than both the regional and collaborative-wide average. Additionally, metrics such as total episode payment and readmission rates are displayed as trends over time as shown in Figure 2 and Figure 3.

Figure One.

Figure Two.

Figure 3 shows that the individual hospital trend for the 90-day readmission rate is higher than both the regional and MVC averages which mirror each other closely. Initially, the overall hospital trend decreases towards the regional average, but climbs again in 2019. MVC members may wish to use this information to investigate the root causes leading to increased readmissions.

Figure Three.

The second volume of MVC’s sepsis reports provides benchmarking for members to identify how they compare to all other MVC hospitals. Figure 4 shows information on a hospital’s total episode payment compared to the regional and MVC averages. In addition, it shows the range of the average total episode payments across the collaborative. By using previously sent reports, hospitals can compare how the metrics have changed - such as an increase or decrease in collaborative-wide or individualized total episode payments. As these reports are disseminated every six months, when comparing, it is important to take notice of the reporting period covered in each report which can be located in the associated cover letter and footnotes. Members can also access their own sepsis related data on the MVC registry.

Figure Four.

If you have any suggestions on how these reports can be improved or the data made more actionable, we would love to hear from you. We are also seeking feedback on how collaborative members are using this information in their quality improvement projects. Please reach out to the Coordinating Center at michiganvaluecollaborative@gmail.com to share your story. If you have any questions or are interested in custom data for your facility, contact us at the aforementioned email address.