0

MVC Coordinating Center Launches Health Equity Report

As hospitals begin to identify lessons learned since the start of the pandemic, providers are keenly aware of the prevalence and exacerbation of existing health inequities. Despite the fact that many providers are increasingly interested in addressing the social determinants of health (SDOH) and equitable access to care, communities of color and other minorities that are statistically more impacted by SDOH and socioeconomic status (SES) have endured even wider gaps in health outcomes and care this past year. For many hospitals and physician organizations, the way forward requires the application of a health equity or social risk lens across the board, so that basic healthcare and quality improvement decision-making can be maximized for all patient populations, not just those with fewer social risk factors. The MVC Coordinating Center is, therefore, proud to have released its first MVC Health Equity Report to its membership on Wednesday morning.

MVC began developing metrics for its membership in this area over the past year so providers might better understand where inequities are materializing within the four walls of their hospitals and beyond. One popular method for identifying low-SES patients is by determining where someone lives and applying population-level metrics to the individual. Examples of this would be using the Area Deprivation Index (ADI) or Social Vulnerability Index (SVI). Both indexes are based on census tract data and provide SES characteristics about a population within a specific geographic location (i.e., a census tract), including risk factors such as poverty, education level, transportation access, and housing security. However, in developing the MVC Health Equity Report, the MVC Coordinating Center elected to utilize a patient-level metric of SES that is compatible with MVC claims data. As a result, the report identifies low-SES patients using dual-eligibility status.

Dual-eligible beneficiaries are patients that are eligible for both Medicare and Medicaid. In the MVC Health Equity Report, dual eligibility is defined as having been eligible for both Medicare and Medicaid at any point during the year of the index admission and is limited to patients that were at least 65 years old at the time of admission. Medicaid eligibility is a good indicator of SES when using claims data since it is income-based, and studies have shown that there is a strong association between low-income status and adverse health outcomes. Dual eligibility allows MVC analysts to identify Medicaid-eligible patients within its more extensive Medicare data set for analyses. Medicare data on the MVC registry currently includes claims data from 1/1/2015 through 9/30/2020. The resulting reports prepared for members focuses on episodes occurring between 2017 and 2020, or between 2017 and 2019 if the circumstances of 2020 resulted in unusual case counts by facility.

In developing this report, there was a conscious decision to exclude any sort of comparison group alongside each individual hospital's metrics. This is because the socioeconomic factors of a hospital’s patient population cannot be changed, and there is great diversity between hospitals throughout the state and within geographic regions. For those reasons, benchmarking was not the intention of this report. However, it is important to note that across the state, the data analyzed by the MVC Coordinating Center consistently indicates that dual-eligible patients have poorer outcomes than their non-dual-eligible counterparts, including longer lengths of stay, higher readmission rates, higher post-discharge emergency department utilization, lower rates of office visits post-discharge, higher rates of post-discharge outpatient procedures, and higher utilization of skilled nursing facilities. Blinded sample graphs for length of stay (Figure 1) and readmission rates (Figure 2) were created using data from three distinct, large hospitals in order to showcase some of these differences.

Figure 1.

Figure 2.

Members receiving reports will see a variety of graphs depicting, for example, total episode payment trends, 30-day readmission rate trends, and post-acute care utilization. Also provided is a table outlining a hospital or region’s highest volume of conditions within its dual-eligible population (see Figure 3 for a blinded sample). The purpose of this table is to help members better understand the proportion of dual-eligible patients at their hospital and the prevalence of various conditions within that population. It will also help members to better understand their report overall by identifying the conditions and procedures driving the various metrics included within it.

Figure 3.

MVC is eager to do more in this space in the months ahead. With the recently added Michigan Medicaid data on the MVC registry, the Coordinating Center has a new opportunity to more closely examine the types of disparities that are prevalent in healthcare. Additionally, with the addition of 13 rural or critical access hospitals to the collaborative in the past 12 months, the Coordinating Center aims to expand its metrics outside of the episode structure to examine population health metrics. This will allow for better understanding about healthcare delivery and how outcomes differ in rural regions compared to urban.

The MVC Coordinating Center wants to hear feedback from its members. With the addition of Medicaid data, we are working hard to develop more metrics and reports that focus on health equity. If you have any questions, comments, or suggestions, please contact the MVC Coordinating Center at michiganvaluecollabortative@gmail.com.

0

MVC Registry Expands with Addition of Medicaid Episodes

The Michigan Value Collaborative (MVC) Coordinating Center recently added Medicaid data to its registry. This update reflects the culmination of many months of work to acquire, process, clean, and add the data, which became available on July 16 to MVC registry users. The current data set is from 1/1/15 through 9/30/19, which amounts to claims from 1/1/15 through 12/31/19. MVC data sources now comprise over 80% of Michigan’s insured population. This represents an additional 1.8 million covered lives (see Figure 1). MVC’s data sources now include Medicare FFS, Commercial Blue Cross Blue Shield of Michigan (BCBSM) PPO, Medicare Advantage BCBSM PPO, Commercial Blue Care Network (BCN) HMO, Medicare Advantage BCN, and Michigan Medicaid.

Figure 1.

The addition of Medicaid data will impact, among other things, the distribution of MVC episodes across its portfolio of payers. Medicare is still the dominant payer within MVC data with more than 641,747 episodes. However, the new distribution of MVC episodes by payer (Figure 2) showcases that Medicaid is now the third-largest payer in MVC data, accounting for 18% of total episodes.

Figure 2.

MVC currently serves 97 participating hospitals, including critical access members, and 40 physician organizations in Michigan. The proportion of Medicaid episodes in MVC data by facility (Figure 3) varies significantly across MVC’s membership, with some members attributing less than 5% of their episodes to Medicaid and some near 60%. For the bulk of MVC’s membership, between 10% and 30% of their episodes are in Medicaid, which represents a significant increase in the total episodes they can now utilize. For some MVC hospitals, the number of episodes they have in MVC data may double if they have a large share of Medicaid patients.

Figure 3.

MVC currently provides data on 40 defined conditions. The addition of Medicaid data is likely to impact certain conditions more than others in keeping with the types of procedures and conditions most prevalent with Medicaid-eligible populations. The top five Medicaid conditions include sepsis, C-section, vaginal delivery, cholecystectomy, and chronic obstructive pulmonary disease (COPD), so members are more likely to see changes to their utilization data for those conditions. The number of episodes being added for each condition is outlined in Figure 4.

Figure 4.

The Medicaid data will also allow for the creation of new data visualizations and reports that capture information not previously available. For example, MVC analysts recently generated two new Medicaid-based maps (Figures 5 and 6) that help visualize utilization and location information for the Medicaid population. Figure 5 represents the patient Zip codes that can be attributed to Medicaid episodes in MVC data, with Zip codes appearing darker if a larger percentage of Medicaid patients reside there. This allows members to see those communities near their own facilities that are likely home to the Medicaid patients they serve.

Figure 6 also represents the percentage of episodes attributed to Medicaid patients, with darker colors representative of higher percentages; however, Figure 6 connects these Medicaid episodes to MVC member facilities rather than Zip codes and visualizes the total number of episodes in addition to the percentage. Together, these two figures provide MVC members with more information about their Medicaid populations as well as the extent to which utilization varies between peer facilities in the same region.

Figure 5.

Figure 6.

These maps are the first example of new outputs that are possible with the addition of Medicaid data. The MVC Coordinating Center plans to produce additional reports for members that leverage the new data set. One area of interest is the social determinants of health. Since Medicaid provides medical assistance to disabled and low-income individuals, statistical analysis using this data often reflects trends tied to low socioeconomic status populations. Ideally, this data set will allow MVC and its members to invest more attention and resources into equity-based quality improvement projects.

The MVC Coordinating Center is eager to learn which topics are of greatest interest to members that integrate Medicaid claims. If your team has specific ideas that could help guide this work, please contact MVC at michiganvaluecollaborative@gmail.com.

0

Condition Selection Process Announced for MVC Component of BCBSM P4P Program

This week the Michigan Value Collaborative (MVC) Coordinating Center announced the condition selection process for program year (PY) 2022 and PY 2023 of the MVC Component of the Blue Cross Blue Shield of Michigan (BCBSM) Pay-for-Performance (P4P) program. The timeline for each program year’s stages are detailed in Figure 1.

Figure 1.

In the announcement, hospitals were tasked with selecting two conditions for which they will be evaluated and returning their condition selection form to the Coordinating Center by Friday, August 13, 2021. The announcement also outlined changes to the scoring methodology, cohort assignments, and bonus points available.

The Coordinating Center’s recent announcement included condition selection reports with targets for each condition option that may help inform hospitals’ selection decisions. Each participating hospital will choose two of the seven available conditions for PY22 and PY23: spine surgery, joint replacement, chronic obstructive pulmonary disease (COPD), coronary artery bypass grafting (CABG), congestive heart failure (CHF), colectomy (non-cancer), and pneumonia. When selecting conditions, the Coordinating Center recommends reviewing your data in the registry and considering several factors for each condition, including case counts and identifiable areas with the greatest cost opportunities. The Coordinating Center also recommends considering where resources are currently being directed in your facility and potentially aligning with those efforts.

One notable change from prior program years is the methodology by which hospitals earn achievement and improvement points. Hospital scores will continue to be based on a hospital’s risk-adjusted, price-standardized total episode payments for two selected conditions, and they can still earn a maximum score of 10 points. However, the improvement and achievement scores will become more similar in order to be placed on the same scale. As such, the achievement equation will change from being based on rank within MVC cohort at performance year to being based on distance from MVC cohort mean at baseline year. Similarly, the improvement equation will utilize the distance from the hospital’s mean at baseline. These new equations (see Figure 2) as well as complete descriptions of the updated methodologies are reviewed at length with examples in the technical document.

Figure 2.

P4P cohorts have also been reassigned for PY22 and PY23. These changes are also detailed in the technical document, and the new cohort assignments can be found on the MVC website. The cohorts are not intended to group hospitals that are exactly alike; rather, they create a reasonably-comparable grouping from which MVC can complete statistical analysis.

The final change is to the awarding of bonus points. In place of the previous 5% cohort reduction bonus, participants can instead earn bonus points by completing two questionnaires (one per selected condition) and submitting these to the Coordinating Center by November 1st of each program year. The purpose of this is to gather examples of quality improvement initiatives in operation at MVC member hospitals to share with the Collaborative. Moving forward, this will help support members in reducing costs through collaboration.

Each of the changes mentioned above are designed to deliver a more transparent, intuitive, flexible, and fairer P4P program. The Coordinating Center will offer an explainer webinar to answer questions and walk through the details of these changes in more detail. The webinar will be offered on two dates: the first is scheduled for Thursday, July 29 from 11:00-12:00 pm, and the second is on Tuesday, August 3 from 1:00-2:00 pm. Both webinars can be accessed using the following Zoom link: https://umich.zoom.us/j/95502303999. Participants can also call +1 301 715 8592 (meeting ID #955 0230 3999). For those interested in the explainer webinar who are unavailable on both dates, a recording of the first webinar will be available. If you are interested in receiving a link to this recording, please email the MVC team at michiganvaluecollaborative@gmail.com.

0
View Post
Introducing Carla Novak, MVC’s Administrative Assistant

Introducing Carla Novak, MVC’s Administrative Assistant

I am excited to be joining the MVC team as the Administrative Assistant. I was born in Ohio (Go Buckeyes!) and moved to Michigan when I was young. I have always had a desire to work on the clerical side of healthcare, which led me to several roles within Michigan Medicine.

Most recently, I worked as a Referral Coordinator for the U-M Division of Cardiovascular Medicine, where I obtained insurance authorizations for various procedures. Prior to this I worked as an Administrative Assistant on an inpatient unit within the hospital, providing support to roughly 90 employees and our management team. I also processed payroll, reimbursements, PTO requests, and more.

As MVC’s Administrative Assistant, I look forward to assisting with the day-to-day needs of the Coordinating Center. I am thankful for the opportunity to work with this great team and look forward to getting to know each and every one of you!

0
View Post
Introducing MVC’s Newest Analyst, Kristen Palframan, MPH

Introducing MVC’s Newest Analyst, Kristen Palframan, MPH

I am excited to have joined the Michigan Value Collaborative (MVC) this month as a data analyst. I’m really looking forward to working with the MVC team and using my experience in data management and analysis to support the goal of improving the quality and value of healthcare in Michigan.

My background is primarily in research and data analysis. I have a Bachelor of Science degree in Animal Behavior from Bucknell University. After conducting behavioral research and wildlife disease fieldwork with animals throughout and following college, I developed an interest in disease prevention and came to Michigan to pursue a Master of Public Health (MPH) degree from the University of Michigan School of Public Health. During my MPH program I took a variety of epidemiology and statistics courses, and I particularly enjoyed those that involved programming in SAS and SQL. After graduating from the University of Michigan with an MPH degree in Epidemiology in 2018, I worked for three years as an epidemiologist for the U.S. Department of Veterans Affairs (VA) in the Office of Mental Health and Suicide Prevention. At the VA, I worked on analyses, reports, dashboards, and manuscripts focused on supporting suicide prevention among U.S. Veterans. My work for the VA primarily used electronic medical record data from the Veterans Health Administration as well as mortality data from the Centers for Disease Control and Prevention’s National Death Index.

Now I am thrilled to use my experience in healthcare data analysis to support MVC’s mission and I’m looking forward to growing as an analyst and gaining experience working with claims data. If you have any questions or would like to contact me, please feel free to email me at kpalf@med.umich.edu.

0

Custom Hospital Analytics Result in Case Study for Collaborative

The Michigan Value Collaborative (MVC) Coordinating Center encourages its members to seek out custom analytics to inform and support ongoing quality improvement activities. These requests can help hospitals and physician organizations dig deeper into specific aspects of their administrative claims data and, as a result, better understand areas for improvement.

As custom analytics have been prepared and shared with respective members, the Coordinating Center has endeavored to learn the extent to which these analytics have been utilized. The resulting feedback has enriched MVC’s understanding of its members’ quality initiatives, and presents a great opportunity for MVC to educate its members about the successes and lessons learned of their peers.

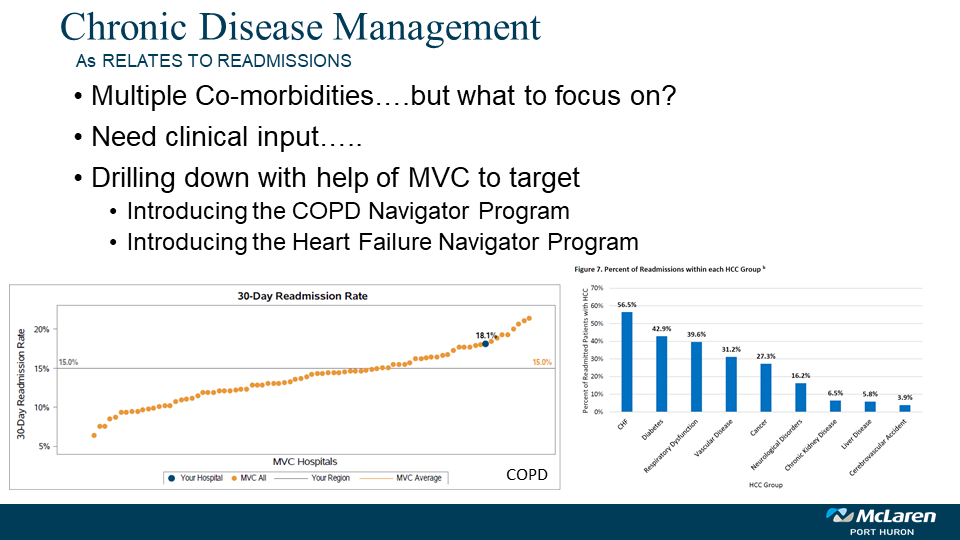
In that spirit, the Coordinating Center has sought the permission of various hospitals to generate case studies based on this collaborative work. One such case study featuring McLaren Port Huron Hospital was created this past year and shared with the entire Collaborative via the MVC Newsletter (Figure 1). It features a custom analytics request about the rates and adherence of follow-up visits in their congestive heart failure (CHF) population as well as readmission rates for chronic obstructive pulmonary disease (COPD). The resulting custom analytics reports prepared by the Coordinating Center were also accompanied by best practice sharing sourced from other Collaborative members.

Figure 1.

The Coordinating Center plans to continue to generate shareable case studies about similar requests if those facilities have provided their permission. Similarly, MVC will continue to identify such opportunities for information sharing and networking across facilities in order to support its members.

If any members of the Collaborative are interested in pursuing custom analytics in the future or have ideas to share across hospitals, please contact the Coordinating Center at michiganvaluecollaborative@gmail.com.

0

Virtual Site Visits Underway with MVC Members

The COVID-19 pandemic affected hospital operations in a myriad of ways, with many Michigan Value Collaborative (MVC) members experiencing circumstances that could impact their score on the MVC Component of the BCBSM Pay-for-Performance (P4P) program. In order to mitigate some of the effect of COVID-19, the MVC Coordinating Center introduced two extra bonus points to be earned for Program Year 2021 only. One bonus point can be achieved by attending both MVC semi-annual events; the first was held in May and the second will be held in October. The second bonus point can be earned by undertaking a virtual site visit with the MVC Coordinating Center.

To date, the Coordinating Center has completed 26 site visits, and a further 25 “visits” are scheduled with a variety of hospitals around the state. During these 90-minute virtual visits, MVC provides an overview of the collaborative, our data, and engagement activities. Hospitals receive a quality improvement slide (Figure 1) in advance that they complete and return prior to their scheduled date. These responses drive the main discussion of the site visit.

Figure 1.

Much has been learned about various quality improvement projects being implemented and what hospitals are focusing on for 2021 and 2022. MVC plans to use the information from these slides to connect hospital members with peers interested in implementing similar projects.

In addition, the Coordinating Center is interested in learning: who is utilizing the registry and any individualized reports, the types of MVC data that are most useful, and any challenges hospitals have with using the data. This feedback will help MVC make improvements to the registry and individualized reports to make them more actionable for members.

Finally, the hospital relationship with physician organizations (POs) is discussed. One of MVC’s goals is to help facilitate collaboration between POs that have patients attributed to each hospital, especially in the patient outcomes and quality of care arenas.

If you have not yet scheduled a site visit, please do so here. Slots are available between now and October. If you have any questions or would like further information on a site visit, please contact the MVC Coordinating Center at michiganvaluecollaborative@gmail.com.

0
View Post
Introducing Jana Stewart, MPH, MS Communication Specialist for MVC

Introducing Jana Stewart, MPH, MS Communication Specialist for MVC

I am excited to join the Michigan Value Collaborative (MVC) as Communications Specialist. This new position will help highlight MVC’s success stories, support MVC member events and engagement activities, and promote MVC services throughout the state of Michigan. I look forward to getting to know MVC members and hearing their feedback in the coming months.

I have worked in communications in various capacities over the past 10 years, and as a result my writing has been published in academic journals, newspapers, magazines, and K-12 curricula. I started out in journalism as a sports writer, copy editor, and then managing editor of a regional newspaper, during which I earned writing awards from the Michigan Press Association and the Society of Professional Journalists. My time as a journalist allowed me to write about a wide range of topics, from city government and local business to high school sports and crime.

When I left journalism for a position at the University of Michigan, I continued to provide broad communications support to administrative offices and research labs. Through this work I developed a strong interest in programs that sought to improve the long-term health of people and places. As a result, I also enrolled as a dual-degree master’s student in public health and environmental science. I have three degrees from the University of Michigan in total, including a Bachelor of Arts in Kinesiology, a Master of Science in Environmental Psychology, and a Master of Public Health (MPH).

Following the completion of my MPH program, I spent several years in the field working for primary prevention programs. I worked for a hospital-based farm in the St. Joseph Mercy/Trinity Health network, and then with Michigan Medicine’s Project Healthy Schools program. Implementing interventions in the field helped me to see first-hand the impact that such programs can have on a population or institution. Now I am truly excited to support the mission and vision of the MVC as I return to communications full-time. I know there are tremendous untold stories about the impact of MVC’s efforts on Michigan hospitals and patients. If you have a story to tell or a question to ask, please reach out to me at janaemil@med.umich.edu. I would love to hear from you!

0
View Post
MVC Semi-Annual Meeting May 2021 – Virtual Meeting Recap

MVC Semi-Annual Meeting May 2021 – Virtual Meeting Recap

The Michigan Value Collaborative (MVC) held its first virtual semi-annual meeting of 2021 on Friday, May 7th. A total of 221 leaders from a variety of healthcare disciplines attended Friday’s virtual meeting, representing 74 different hospitals and 30 physician organizations (POs) from across the State of Michigan. These participants came together to hear about the planned adjustments to the MVC Component of the BCBSM P4P Program for Program Years (PY) 2022/23 and to discuss variations in transitions of care and ED utilization practices across Michigan.

MVC’s Director, Dr. Hari Nathan, started Friday’s meeting with an update from the MVC Coordinating Center, welcoming the eleven new hospital members who have joined the collaborative since the turn of the year and highlighting recent improvements to MVC data sources and push reporting. This included the “soft launch” of Medicaid data. MVC has now added Medicaid data to our data portfolio, meaning that MVC data sources now comprise over 80% of Michigan’s insured population. The Coordinating Center is in the final stages of validation and will have this new data source live for use by members in the coming months.

Dr. Mike Thompson, MVC’s Co-Director, then shared information on the MVC Component of the BCBSM P4P Program with attendees. An overview of PY20 was first provided, showing that participants earned an average of six points during this program year, an increase of around one point from the 2019 program year average. In an effort to continually improve the MVC Component, the Coordinating Center has introduced two methodological changes for the next two-year cycle (PY22 & PY23). Dr. Thompson walked through each of these changes, which include placing “Improvement” and “Achievement” on the same scoring scale, and introducing a new qualitative questionnaire for earning bonus points. The MVC Coordinating Center will be sharing further information on these changes and disseminating service line selection reports for the next program cycle with members in early June. Two dedicated P4P webinars will also be held around this time to assist members with selection.

Attention was then turned to looking at transition variations in Michigan hospitals, highlighting payment and ED utilization differences across MVC members, as well as the top reasons for readmission within the collaborative. To expand on this further, we were joined by guest speakers from the hospital, physician organization, and CQI setting to share their insights and learning. Dr. Robert Nolan and Michael Getty from Spectrum Health Lakeland were the first guest speakers of the day, discussing their organization’s efforts to reduce the cost of ED utilization and readmission rates. This highlighted the importance of real time data visuals, integrating documentation tools with best practices, and ensuring an effective longitudinal plan of care that is blended into natural work flows to enable physician buy-in. Dr. Nolan and Mike Getty were also able to spotlight the use of MVC data in these efforts, a custom option available to all MVC members.

Representing Professional Medical Corporation (PMC) and the Consortium of Independent Physician Associations (CIPA), Dr. Kyle Enger then shared how both entities have worked to promote appropriate emergency care in recent years. Again, this emphasized the importance of monthly data report cards to provide physicians with actionable data to guide activity, as well as the need to continue promoting urgent care as a viable alternative in certain situations. Our last guest speaker of the day was Dr. Keith Kocher, Director of the Michigan Emergency Department Improvement Collaborative (MEDIC). As well as providing a brief overview of the purpose of MEDIC and sharing some vital statistics relating to ED utilization across the US, Dr. Kocher discussed how best to approach the “ED readmission problem” and how local solutions can be used to minimize its impact.

To conclude Friday’s meeting, MVC’s Site Engagement Coordinator, Jeff Jameel, provided a synopsis of the day and highlighted key upcoming activities. The slides from Friday’s meeting are available here and a recording of the meeting can also be viewed here. If you have any questions on anything that was discussed at Friday’s semi-annual or are interested in finding out more about MVC’s offering, please reach out to the MVC Coordinating Center (michiganvaluecollaborative@gmail.com.) In the meantime, we look forward to seeing you all in-person again soon.

0

MVC Launches New Physician Organization Reports

The goal of the Michigan Value Collaborative (MVC) is to improve the health of Michigan through sustainable high-value healthcare. The primary focus at inception in 2013 was the development of hospital based metrics to improve patient outcomes, reduce healthcare costs, and encourage hospitals to collaborate in best practice sharing. With the knowledge that hospitals are not the healthcare entity capable of such changes, MVC invited Physician Organizations (POs) to join the collaborative towards the end of 2018.

To date, PO members have been able to see hospital level data for their attributed facilities. This has proved helpful for our PO members but we have heard consistent feedback that being able to view metrics that display a PO’s specific attributed patient population would be welcome. This value added request was appreciated by MVC, and so the Coordinating Center began a collaboration with representatives from the Blue Cross Blue Shield of Michigan (BCBSM) Physician Group Incentive Program (PGIP) to develop new PO patient specific metrics. MVC has also engaged other parties in the development of these new metrics, including the Michigan Data Collaborative (MDC) and hearing directly from our PO members.

As a result of this collaboration, the first MVC PO population level report, containing data for both BCBSM PPO Commercial (Comm) and BCBSM Medicare Advantage (MA) between 1/1/19 and 12/31/19, was sent out to all 40 MVC PO members on Tuesday, April 20, 2021. The report contains data on health care utilization and allows POs to benchmark themselves against all MVC participating physician organizations for the metrics listed in Table 1.

Table 1. Initial PO Reporting Metrics

Each metric was stratified by payer to account for differences in patient populations, as well as to serve as a proxy for age stratification (Figure 1).

Figure 1. Sample PO Metric: Percent of Attributed Members with at Least One Inpatient Stay

As engagement with our PO members builds, and further feedback and requests are processed, MVC plans to continue to build on the metrics highlighted in this report. As the most recent reports are at a population level, the Coordinating Center intends to delve further into the metrics for more granular level detail.

If you are interested in sharing feedback about the PO reports, have any specific analytic requests, and/or would like more information about the Michigan Value Collaborative,  please reach out to the Coordinating Center at michiganvaluecollaborative@gmail.com.