0
View Post
MVC Publishes its 2024 QECP Annual Report as a Qualified Entity

MVC Publishes its 2024 QECP Annual Report as a Qualified Entity

Recently, the MVC Coordinating Center published its annual Qualified Entity Certification Program (QECP) public report for 2024. This report [PDF] was published in a new QECP section on the MVC website’s Data/Registry page and is an annual requirement for MVC as a qualified entity with the Centers for Medicare & Medicaid Services (CMS). This was MVC’s third public QECP report and continued to provide unidentified aggregated data about Michigan hospital performance on two measures: rates of 30-day rehospitalizations following start of home health care, and rates of outpatient follow-up received after hospitalization for congestive heart failure (CHF) or chronic obstructive pulmonary disease (COPD).

All measures in the report were created using data from MVC claims-based episodes of care initialized by inpatient hospitalizations or surgeries between Jan. 1, 2018 and Dec. 31, 2022. Claims were incorporated from all MVC payer sources, including Medicare Fee-for-Service, Blue Cross Blue Shield of Michigan, Blue Care Network, and Michigan Medicaid.

The reported overall rate of 30-day unplanned rehospitalizations after the start of post-acute home health care among episodes beginning at MVC hospitals in Michigan was 11.6% for 2018-2022. Risk-adjusted rates by index hospital ranged from 2.5% to 17.2%. By home health provider, risk-adjusted rates ranged from 0.0% to 23.5% (Figure 1). Patients whose episode of care began with an index event for endocarditis, COPD, CHF, or percutaneous coronary intervention (PCI) were more likely than patients with other index conditions to experience an unplanned rehospitalization in the 30 days after they started home health care. Patients with a joint replacement episode of care were least likely to have an unplanned rehospitalization following the start of home health care.

Figure 1. Risk-Adjusted Rates of 30-Day Unplanned Rehospitalization from Home Health, by Home Health Provider

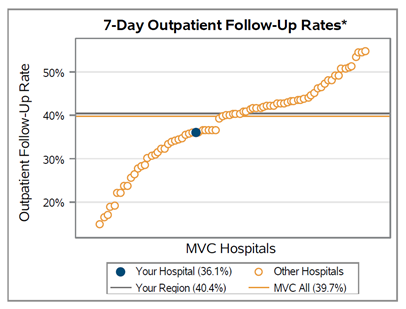
Results for the outpatient follow-up metrics remained similar to findings from previous annual reports. Across episodes of care for index events in 2018-2022 at the 106 MVC hospitals in Michigan, the unadjusted rate of patients receiving outpatient follow-up within 7 days after hospitalization for CHF was 44% (Figure 2). Following index hospitalizations for COPD, 36% of patients received outpatient follow-up within 7 days (Figure 3). For both conditions, there was wide variation across hospitals in Michigan in their 7-day follow-up rates after hospitalization, with rates ranging between less than 10% to over 60%. Rates of follow-up were fairly steady over time.

Figure 2. 7-Day Follow-Up After CHF Hospitalization by MVC Hospital

Figure 3. 7-Day Follow-Up After COPD Hospitalization by MVC Hospital

For more information and the entire set of findings we invite you to read the full 2024 report, available here.

QE certification status allows MVC to provide hospital members with additional data from Medicare Fee-for-Service (FFS) claims at a level of granularity which would not otherwise be available under standard CMS data use agreements. Reports located under the “QE Medicare” icon on the MVC registry allow hospital registry users to see unsuppressed Medicare data including case counts <11 as well as utilization rates and average payments based on case counts <11. In addition, on any QE Medicare registry report, members can click on specific data points to load a list of all episodes underlying that data point. From that episode list it is possible to view drilldown information on individual episodes to learn more about the claims and price-standardized payments comprising that episode.

Members may contact the MVC Coordinating Center by emailing Michigan-Value-Collaborative@med.umich.edu to learn more about data available through MVC’s QECP reports and to receive the forms necessary to gain access on the registry.

0
View Post
MVC’s Refreshed Common Conditions Report Coming to Hospital Members Soon

MVC’s Refreshed Common Conditions Report Coming to Hospital Members Soon

MVC members will receive their next batch of updated push reports in the coming days with a refreshed version of MVC’s common conditions report. These reports provide insight into episodes of care for eight medical and surgical conditions that are commonly a focus for quality improvement efforts at MVC hospitals: acute myocardial infarction (AMI), chronic obstructive pulmonary disease (COPD), colectomy (non-cancer), congestive heart failure (CHF), coronary artery bypass graft (CABG), total knee and hip (joint) replacement, pneumonia, and spine surgery. MVC’s general acute care hospital and Critical Access Hospital (CAH) members will receive tailored versions of the report, with each group receiving benchmark data specific to their own category of hospitals.

Although the metrics provided vary by condition and case count, report pages generally focus on 30-day total episode payments, readmission rates, common reasons for readmissions, and post-acute care utilization. MVC price standardizes total episode payments to Medicare FFS amounts so that comparisons can be made across hospitals and over time. Payments are risk adjusted for patient age, gender, payer, comorbidities, and high or low prior healthcare utilization/payments.

Post-acute care utilization benchmarking for each of the eight medical and surgical conditions includes graphs displaying the percentage of each hospital’s patients who used home health care, inpatient/outpatient rehab, skilled nursing facility care, outpatient services, or emergency department care in the 30 days following their index hospitalization or surgery. Across the collaborative, reports show high use of 30-day home health care and outpatient services for these common conditions. For patients initiating their episode of care at a general acute care hospital within the collaborative, the home health care utilization rate was highest following CABG (69%) and joint replacement (50%).

Patients with a CABG episode were also high utilizers of outpatient services in the 30 days post-index (Figure 1), with a 73% average utilization rate. Patients with episodes for CHF (58%) and AMI (53%) were also high utilizers of outpatient services. Across conditions, use of outpatient services in the 30 days post-index was generally higher among episodes originating at CAHs than among episodes originating at general acute care hospitals.

Figure 1.

Reports also assess the setting of care for joint replacements and spine surgeries. For total knee and hip replacements, MVC data shows that the percent of joint replacements performed in an outpatient setting at general acute care hospitals across Michigan continued to rise from January 2021 through September 2022 (Figure 2).

Figure 2.

The patient population in these reports comprises adult patients who had surgery or an inpatient hospitalization at an MVC-participating hospital between January 2021 and September 2022. Measures are based on 30-day inpatient and surgical-based episodes of care data, incorporating paid claims from Blue Cross Blue Shield of Michigan and Blue Care Network Commercial and Medicare Advantage plans as well as paid claims from Medicare Fee-for-Service. Episodes meeting any of the following criteria were excluded from calculations: patients transferred to another acute care hospital or to hospice, patients who died during their index stay, and patients with a primary diagnosis of COVID-19 received in an inpatient setting at any point during their 30-day episode.

We hope our collaborative participants find these reports valuable, and as always, we welcome MVC members to contact MVC with any questions or analytic requests.

0
View Post
MVC Implements a Variety of Data Updates to Episode Methodology

MVC Implements a Variety of Data Updates to Episode Methodology

Throughout the past few months, the MVC team has made several methodological updates to its claims-based episodes of care data underlying the metrics shared via MVC’s online registry and push reports. Some of these updates were part of regular claims data maintenance, whereas others were improvements identified and implemented by the MVC team.

Long-Term Acute Care Hospital Utilization Added as Post-Acute Care Category

A new category of post-acute care utilization was generated within MVC episodes of care: long-term acute care hospital (LTACH) stays. Previously, facility claims were grouped into seven major categories: inpatient, inpatient rehab, outpatient rehab, emergency department, skilled nursing facility, home health, and outpatient/other. An area of opportunity was identified by the MVC Coordinating Center and MVC members to add LTACH to this list. Formerly in MVC data, claims for stays at LTACH facilities were grouped in with inpatient claims and thus counted towards “inpatient readmissions” in the context of an MVC episode of care. LTACH is now its own category of care within MVC episodes and is assessed separately from inpatient stays at general acute care hospitals and Critical Access Hospitals. To count towards post-index LTACH care in an MVC episode, a facility claim must contain bill type 011X and the billing facility NPI for the claim must be primarily affiliated with taxonomy code 282E00000X. LTACH claims will continue to be price standardized in the same manner as other inpatient claims.

As a result of LTACH being added as a separate category of care in MVC episodes, MVC members can now also look at their patients’ use of LTACHs on the MVC registry. By index condition, members can view their attributed episodes’ rate of post-index LTACH utilization as well as their average LTACH payment per episode within the Payment by Condition reports for all payers. To do so, users must navigate to the Payment by Condition report, scroll down to the “Payment Measure” filter on the left side of the registry, and select “LTACH ($)” or “LTACH (%)” to look at average payments or utilization rates, respectively.

Updates to Hierarchical Condition Category (HCC) Identification

Another update made to MVC data this year was the application of components from the most recent specifications around hierarchical condition categories (HCC) from the Centers for Medicare & Medicaid Services (CMS). HCCs are patient comorbidities that both CMS and MVC use as part of risk-adjustment processes. When creating episodes of care, MVC uses each patient’s claims data in the 180 days prior to a given index event to retrospectively assess the comorbidities diagnosed for that patient prior to their MVC episode of care. Formerly, diagnoses indicated as “present on admission” on a patient’s index claim were also used to ascertain a patient’s HCCs, but MVC has updated its methodology such that no diagnoses from the index claim will be used in the assessment of patient HCCs going forward. MVC continues to create 79 HCCs according to HCC V22, with new diagnosis codes added each year.

Furthermore, we note that the category hierarchies created by CMS have been applied to the HCC comorbidities that MVC assesses and displays on the registry. The “hierarchical” aspect of the condition categories is applied to groups of similar diagnoses with a goal that patient comorbidities are not over-counted. For example, a patient diagnosed with diabetes may have multiple similar diagnoses reported on claims over a six-month period, such as diabetes without complications, diabetes with chronic complications, and diabetes with acute complications. Rather than describing that patient as having all three diagnoses, a hierarchy is applied so this patient will simply be described as having the most severe of the group of diagnoses (i.e., diabetes with acute complications). To look at the prevalence of HCC comorbidities among your patient population for one of MVC’s 40+ inpatient or surgical episodes of care, members can navigate to the “Comorbidities” report on the registry.

New Medicare Severity Diagnosis-Related Group (MS-DRG) Version

As part of annual maintenance to accommodate newly introduced billing codes, MVC recently updated the version of Medicare Severity Diagnosis Related Codes (MS-DRGs) being used to re-group inpatient claims into categories of similar inpatient stays. MS-DRG v40.1 is now being used by MVC to categorize all inpatient claims containing ICD-10-CM diagnosis codes and ICD-10-PCS procedure codes.

Inpatient Claim Outlier Length of Stay Methodology

MVC updated the method by which inpatient claims with a particularly long length of stay are identified and price standardized. MVC price standardizes each inpatient claim by adding up three components: a standard DRG-based payment, an inpatient transfer payment (if applicable), and a length of stay-based outlier payment (if applicable). An outlier payment is added to the total price-standardized payment amount for a given inpatient claim if the covered patient remained in the hospital significantly longer than an average patient with the same DRG. In the past, MVC identified these “outlier” long length of stay inpatient hospitalizations using publicly available national long length of stay thresholds for every DRG from TRICARE, the uniformed services healthcare program. MVC’s updated outlier methodology uses Medicare Fee-for-Service (FFS) claims to identify the 99th percentile in length of stay (days) among inpatient claims for each MS-DRG. The hospitalization length of stay on each inpatient claim is then compared against the newly identified 99th percentile threshold for the corresponding DRG. Claims with stays exceeding that length threshold are considered outliers. The outlier payment added to that claim’s price-standardized payment amount is then calculated with an unchanged formula as follows: Outlier Payment = (Number of Days Over DRG-Specific Length of Stay Threshold) * $2,500.

All-Cause Readmissions Assessed for All MVC Conditions

New this year, all-cause inpatient readmissions following index hospitalizations will be assessed for all MVC conditions whenever readmission metrics are shown. Specifications around the identification of readmissions will not vary by index condition.

Episodes Containing COVID-19 Care Now Identified by Primary Diagnosis Codes Only

Finally, MVC has modified the identification of episodes containing care for COVID-19. Episodes are now flagged as containing significant COVID-19 care if they meet the following criteria: at any point during the 30- or 90-day episode, a COVID-19 diagnosis (U07.1) was found in the primary diagnosis code position on a facility claim categorized as inpatient, inpatient rehab, skilled nursing facility, or LTACH. These episodes are often excluded from metrics displayed in MVC push reports. To exclude episodes containing COVID-19 care from metrics shown on the registry, members can use the registry filter called “COVID Cases.” Users should select “Exclude 30-Day COVID” to exclude episodes in which COVID-19 was found within the index event or 30 days post-index. Selecting “Exclude 90-Day COVID” will exclude episodes where a primary COVID-19 diagnosis was found within the index event or 90 days post-index.

For more information on MVC episodes of care data, please refer to MVC’s data guide. MVC members with questions not covered within the data guide are welcome to reach out to the Coordinating Center at Michigan-Value-Collaborative@med.umich.edu.
0
View Post
MVC Publishes its 2023 QECP Public Report as a Qualified Entity

MVC Publishes its 2023 QECP Public Report as a Qualified Entity

Today the MVC Coordinating Center published its annual Qualified Entity Certification Program (QECP) public report for 2023. One of the requirements of being a qualified entity (QE) with the Centers for Medicare & Medicaid Services (CMS) through the QECP is the annual dissemination of a public report created using claims data. MVC shared its first public report last year, making the 2023 report the second iteration.

As with last year, the 2023 MVC QECP Public Report provides unidentified aggregated data on Michigan hospitals for two measures: rates of 30-day rehospitalizations following start of home health care, and rates of outpatient follow-up received after hospitalization for congestive heart failure (CHF) or chronic obstructive pulmonary disease (COPD). Both measures were created using data from episodes of care initialized by inpatient hospitalizations or surgeries between 1/1/2018 and 12/31/2021.

For 2018-2021, the overall rate of 30-day unplanned rehospitalizations from home health among MVC member hospitals in Michigan was 11.3%. Risk-adjusted rates by index hospital ranged from 1.6% to 18.5% (Figure 1). By home health provider, risk-adjusted rates ranged from 2.0% to 23.6%. Patients whose episode of care began with an index event for endocarditis, COPD, CHF, or percutaneous coronary intervention (PCI) were more likely than patients with other index conditions to experience an unplanned rehospitalization in the 30 days after they started home health care.

Figure 1. Risk-Adjusted Rates of 30-Day Unplanned Rehospitalization from Home Health, by MVC Hospital

Across the 102 MVC hospitals with attributed episodes of care data underlying this report, the unadjusted rates of patients receiving outpatient follow-up were higher following index hospitalizations for CHF than for COPD (Figures 2 and 3). This was the case whether follow-up occurred three days (16% vs. 13%), seven days (45% vs. 37%), 14 days (63% vs. 54%), or 30 days (72% vs. 64%) after discharge.

Figure 2. 30-Day Follow-Up After CHF by MVC Hospital

Figure 3. 30-Day Follow-Up After COPD by MVC Hospital

For more information and the entire set of findings, we invite you to read the full report, which is available online to any member of the public on the MVC Resources page or directly here.

QE certification status allows MVC to provide hospital members with additional data from Medicare Fee-for-Service (FFS) claims at a level of granularity not otherwise available under standard CMS data use agreements. Reports located under the “QE Data” icon on the MVC registry allow hospital registry users to see unsuppressed data that include case counts <11 as well as utilization rates and average payments based on case counts <11. In addition, on any QE Data registry report, members can click on specific data points to load a list of all episodes underlying that data point. From that episode list, it is possible to view drill-down information on any individual listed episode to learn more about the claims and price-standardized payments comprising that episode.

MVC members representing one or more MVC-participating hospitals can send an email to Michigan-Value-Collaborative@med.umich.edu to learn more about data available through MVC’s QECP reports and to receive the forms necessary to gain access to those registry reports.

0
View Post
MVC Uses New ED-Based Episode Data in Latest Push Report

MVC Uses New ED-Based Episode Data in Latest Push Report

The MVC Coordinating Center recently distributed its first-ever report based on new emergency department-based episodes (“ED-based episodes”), sharing versions with site coordinators and quality improvement staff at 102 participating MVC member hospitals across Michigan. Reports featured each hospital’s own attributed ED-based episode data for five high-volume ED conditions: chest pain, abdominal pain, chronic obstructive pulmonary disease (COPD), congestive heart failure (CHF), and cellulitis.

ED-based episodes are a new episode of care data structure developed this past year by MVC in collaboration with the Michigan Emergency Department Improvement Collaborative (MEDIC), a BCBSM-funded Collaborative Quality Initiative with the goal of improving care and patient outcomes in Michigan emergency departments. MVC and MEDIC team members worked closely to develop 30-day episodes of care initialized by a patient’s visit to the ED and including all claims-documented care received in the 30 days following a patient’s index ED visit. MEDIC program director Dr. Keith Kocher, MD, talks more about the collaboration as well as advice on leveraging this data from an emergency medicine perspective in the video below.

These ED-based episodes are built using medical claims data from Medicare Fee-for-Service, Blue Cross Blue Shield of Michigan PPO Commercial and Medicare Advantage plans, and Blue Care Network HMO Commercial and Medicare Advantage plans. MVC’s ED-based episodes of care include both adult and pediatric patients, providing new opportunities for quality improvement insights at Michigan hospitals. Though this report provides metrics for five specific index conditions, MVC currently offers data for 15 ED-based index conditions, including abdominal pain, asthma, atrial fibrillation, cellulitis, unspecified chest pain, COPD, CHF, deep venous thrombosis, diabetes mellitus (short- and long-term complications), gastrointestinal bleed, pneumonia, pulmonary embolism, pyelonephritis/urinary tract infections, and syncope.

For each of the five index conditions included in the recent reports, hospitals received information on risk-adjusted and price-standardized 30-day total episode payments, same-day inpatient admission rates over time, utilization of healthcare services across the patient’s 30-day episode of care, and each hospital’s most frequent reasons for inpatient readmissions. Patient claims data were included for adult patients aged 18 and older who had an ED visit at a given hospital between 1/1/21 and 8/31/22, were insured by one of the insurance plans mentioned above, and had a primary diagnosis on their index claim matching standardized definitions for the five included conditions.

Among general acute care hospitals receiving a report, the average risk-adjusted, price-standardized 30-day total episode payments (Figure 1) for the five reported conditions were highest for CHF ED-based episodes ($17,455) followed by COPD ED-based episodes ($11,001), and lowest for unspecified chest pain ($3,792). Within each condition, MVC 30-day total episode payments were consistently higher for episodes in which the patient had a same-day inpatient admission compared to episodes in which the patient did not have an inpatient stay begin on the date of their ED visit. With that information in mind, hospital members can also use their individualized reports to track their same-day inpatient admission rate by six-month intervals using trend graphs for each included ED-based condition (Figure 2).

Figure 1.

Figure 2.

A key goal for these ED-based episode reports was to provide insight into healthcare utilization following index ED visits. Therefore, reports included a dot plot (Figure 3) comparing their own hospital’s patient post-ED utilization to that of the appropriate general acute care hospital or Critical Access Hospital MVC comparison group. Dot plots provided information on what percent of episodes had a same-day inpatient admission, what percent did not have a same-day inpatient admission but did see the patient admitted in the 1 to 30 days following the index ED visit, and what percent of patients had two or more inpatient admissions (thus, at least one readmission) during the episode of care. Also provided are rates of subsequent ED visits, receipt of outpatient services, home health, and skilled nursing facility care.

Figure 3.

Please share your feedback with the MVC team if certain report measures were helpful or if you’d be interested in seeing future ED-based episode reporting for certain conditions and metrics. MVC is now also accepting custom report requests using its new ED-based data. Contact MVC to learn more.

0
View Post
MVC Shares New COPD Report with Physician Organizations

MVC Shares New COPD Report with Physician Organizations

This week the Michigan Value Collaborative (MVC) introduced a new push report for its physician organization (PO) members focused on chronic obstructive pulmonary disease (COPD), providing a tailored version for each of MVC’s 40 PO members. This new push report was created in response to member interest in improving the quality of care for chronic diseases. It utilized 30-day claims-based COPD episodes from Medicare Fee-For-Service, Blue Cross Blue Shield of Michigan (BCBSM) PPO Commercial, and BCBSM Medicare Advantage with index admissions from 1/1/19 to 6/30/21.

One feature the MVC Coordinating Center is excited to highlight is the inclusion of 30-day readmission rates by major comorbidity categories for COPD. Rates were assessed for a PO’s attributed COPD patients overall as well as for attributed patients with congestive heart failure, diabetes, and vascular disease (see Figure 1). These comorbidities are assessed using diagnosis codes on claims in the six months prior to the patient’s index hospitalization.

Figure 1.

Also featured in this report were 90-day rates of pulmonary rehabilitation utilization following COPD index hospitalizations. This is the first time MVC has included a measure of pulmonary rehabilitation utilization in a collaborative-wide report, and the Coordinating Center hopes that this metric will encourage increased use of this important program across Michigan. Across all COPD episodes in the report, the collaborative-wide rate of pulmonary rehabilitation for PO-attributed patients was 2.7% (see Figure 2).

Figure 2.

Due to the low collaborative-wide rate, the Coordinating Center assessed 90-day utilization of pulmonary rehabilitation rather than 30-day utilization. However, the American Thoracic Society recommends the initialization of pulmonary rehabilitation within three weeks following hospitalization. Click here to learn more about American Thoracic Society recommendations for pulmonary rehabilitation and other care following COPD hospitalization.

Each PO’s complete report also includes figures illustrating average price-standardized risk-adjusted 30-day total episode payments, average index hospitalization length of stay, trends in readmission rates, rates and payments of post-acute care utilization, rates of outpatient follow-up, and patient population demographics. A patient population snapshot table details several demographic variables, including a variable based on data from the Economic Innovation Group’s Distressed Communities Index (DCI). It identifies the proportion of patients living in an “at-risk” or “distressed” zip code across all payers (see Figure 3). The DCI is derived from the U.S. Census Bureau’s Business Patterns and American Community Survey.

Figure 3.

A second table provides information on index hospital locations of care for the PO’s attributed patients, comparing the percent of patients treated at each site as well as each index hospital’s average 30-day total episode payment.

The COPD PO report is also being shared with members of the newly established lung care Collaborative Quality Initiative, commonly referred to as INHALE (Inspiring Health Advances in Lung Care). INHALE focuses on patients with asthma and COPD. They disseminate strategies to improve outcomes in these patient populations and reduce the costs associated with asthma/COPD care.

MVC also partnered with a fellow Collaborative Quality Initiative to provide POs with a provider resource that may be relevant to their work with COPD patients. The Healthy Behavior Optimization for Michigan (HBOM) team provided its Quit Smoking Resource Guide to send alongside MVC’s report. HBOM aims to ensure that all smokers who are interested in quitting receive the support and resources they need to be successful. Read more about HBOM’s materials and efforts on the HBOM website or in MVC’s May spotlight blog.

If you have any suggestions on how these reports can be improved or the data made more actionable, the Coordinating Center would love to hear from you. MVC is also seeking feedback on how collaborative members are using this information in their quality improvement projects. Please reach out at Michigan-Value-Collaborative@med.umich.edu.

0

MVC Shares New Pneumonia Push Report with Hospitals

The Michigan Value Collaborative (MVC) introduced its first ever pneumonia push report this week when the Coordinating Center shared individualized reports with 89 hospitals across Michigan. This report was created in response to member interest and incorporated 30-day claims-based episodes with index admissions from 1/1/18 – 12/31/20 for the following payers: Medicare FFS, Blue Cross Blue Shield of Michigan (BCBSM) PPO Commercial, Blue Care Network (BCN) Commercial, BCBSM MA, BCN MA, and Medicaid. Reports were created for all MVC member hospitals that had at least 11 pneumonia episodes per year in 2018, 2019, and 2020.

One goal for this report was to provide data that would be useful for a broad range of MVC’s increasingly diverse membership. Critical Access Hospitals (CAHs), for example, are some of MVC’s newest members and differ in several meaningful ways from other hospitals in the collaborative. Therefore, MVC distributed two different versions of the pneumonia report in order to refine comparison groups and provide a more tailored view of the data. As a result, 81 general acute care hospitals received a pneumonia report comparing their performance to 1) all other eligible general acute care hospitals in the collaborative and 2) acute care hospitals in their geographic region. The second version of the report was shared with eight eligible CAHs, which compared their performance to other MVC CAHs. By providing hospitals with tailored comparison groups when appropriate, MVC hopes to strengthen the usability of its claims-based data to inform quality improvement initiatives.

After much consideration, the MVC team decided to remove any pneumonia episodes containing a confirmed diagnosis of COVID-19 (U07.1) in the first three diagnosis positions of an inpatient facility claim from this report. Members can now replicate this approach on the MVC registry for episodes from April 2020 or later using the new COVID-19 filter, which allows users to include or exclude episodes that contained an inpatient facility claim with a confirmed COVID-19 diagnosis. For the purposes of this push report, the Coordinating Center further excluded all pneumonia episodes from March 2020 in order to remove COVID-19 hospitalizations that occurred in Michigan before an official COVID-19 diagnosis code was available and were coded as pneumonia.

Measures included in the pneumonia report were trends in average price-standardized risk-adjusted total episode payments, average index length of stay, index in-hospital mortality rates, trends in 30-day readmission rates, rates of 30-day post-acute care utilization, and rates of seven-day outpatient follow-up. Overall, the Coordinating Center found that the in-hospital mortality rate for both groups of hospitals was about 2%. One noticeable difference between the two report groups was that CAHs had a shorter average length of stay for index pneumonia hospitalizations (4.6 days, see Figure 1) than general acute care hospitals (5.8 days, see Figure 2).

Figure 1. Average Index Length of Stay at CAHs

Figure 2. Average Index Length of Stay at Acute Care Hospitals

Post-acute care utilization rates were stratified by emergency department (ED), home health, rehabilitation, and skilled nursing facility (SNF). In general, the most frequently utilized category of post-acute care for pneumonia episodes was home health at a rate of 20% for acute care hospitals (see Figure 3) and 24% for CAHs (see Figure 4). Furthermore, there was wide variability in seven-day outpatient follow-up rates for both types of hospitals, but the average for acute care hospitals was higher at 39.7% (see Figure 5) compared to 24.4% (see Figure 6) for CAHs.

Figure 3. 30-Day Post-Acute Care Utilization Rates at Acute Care Hospitals

Figure 4. 30-Day Post-Acute Care Utilization Rates at Critical Access Hospitals

Figure 5. Seven-Day Outpatient Follow-Up Rates at Acute Care Hospitals

Figure 6. Seven-Day Outpatient Follow-Up Rates at Critical Access Hospitals

By understanding the unique needs of its members, MVC can improve future reports for use in quality improvement activities. If your hospital is interested in sharing feedback about the new pneumonia report or has a specific follow-up request, please reach out to the Coordinating Center at michiganvaluecollaborative@gmail.com.

0
View Post
Introducing MVC’s Newest Analyst, Kristen Palframan, MPH

Introducing MVC’s Newest Analyst, Kristen Palframan, MPH

I am excited to have joined the Michigan Value Collaborative (MVC) this month as a data analyst. I’m really looking forward to working with the MVC team and using my experience in data management and analysis to support the goal of improving the quality and value of healthcare in Michigan.

My background is primarily in research and data analysis. I have a Bachelor of Science degree in Animal Behavior from Bucknell University. After conducting behavioral research and wildlife disease fieldwork with animals throughout and following college, I developed an interest in disease prevention and came to Michigan to pursue a Master of Public Health (MPH) degree from the University of Michigan School of Public Health. During my MPH program I took a variety of epidemiology and statistics courses, and I particularly enjoyed those that involved programming in SAS and SQL. After graduating from the University of Michigan with an MPH degree in Epidemiology in 2018, I worked for three years as an epidemiologist for the U.S. Department of Veterans Affairs (VA) in the Office of Mental Health and Suicide Prevention. At the VA, I worked on analyses, reports, dashboards, and manuscripts focused on supporting suicide prevention among U.S. Veterans. My work for the VA primarily used electronic medical record data from the Veterans Health Administration as well as mortality data from the Centers for Disease Control and Prevention’s National Death Index.

Now I am thrilled to use my experience in healthcare data analysis to support MVC’s mission and I’m looking forward to growing as an analyst and gaining experience working with claims data. If you have any questions or would like to contact me, please feel free to email me at kpalf@med.umich.edu.