0
View Post
Distressed Community Index Data Supplements MVC Equity Work

Distressed Community Index Data Supplements MVC Equity Work

Emphasizing health equity in Michigan is a key strategic initiative for the Michigan Value Collaborative. MVC kicked off this strategic initiative at its October 2021 semi-annual meeting with the theme of “The Social Risk and Health Equity Dilemma.” Since then, MVC has expanded its access to data sets related to health equity, developed hospital health equity reports, and regularly convened stakeholders from around the state via a health equity workgroup series that launched in January 2022. MVC is eager to find new and exciting ways to utilize data and collaborate with members on health equity topics in Michigan.

One of the more recent enhancements to MVC’s capacity was the addition of more granular data on social determinants of health. MVC secured access to Distressed Community Index (DCI) data, a tool for measuring the comparative economic well-being of US communities. DCI data was first integrated into MVC reporting in August with the distribution of a new push report on emergency department and post-acute care use. It was also incorporated in MVC’s newest physician organization report on chronic obstructive pulmonary disease, which was distributed to PO members last month.

The DCI data are developed by the Economic Innovation Group and derived from the US Census Bureau’s Business Patterns and American Community Survey Five-Year Estimates (2016-2020). The DCI is a composite measure of ZIP-code level socioeconomic distress comprised of seven key indicators, including education, housing, unemployment, poverty, income, employment changes, and business (see Figure 1).

Figure 1.
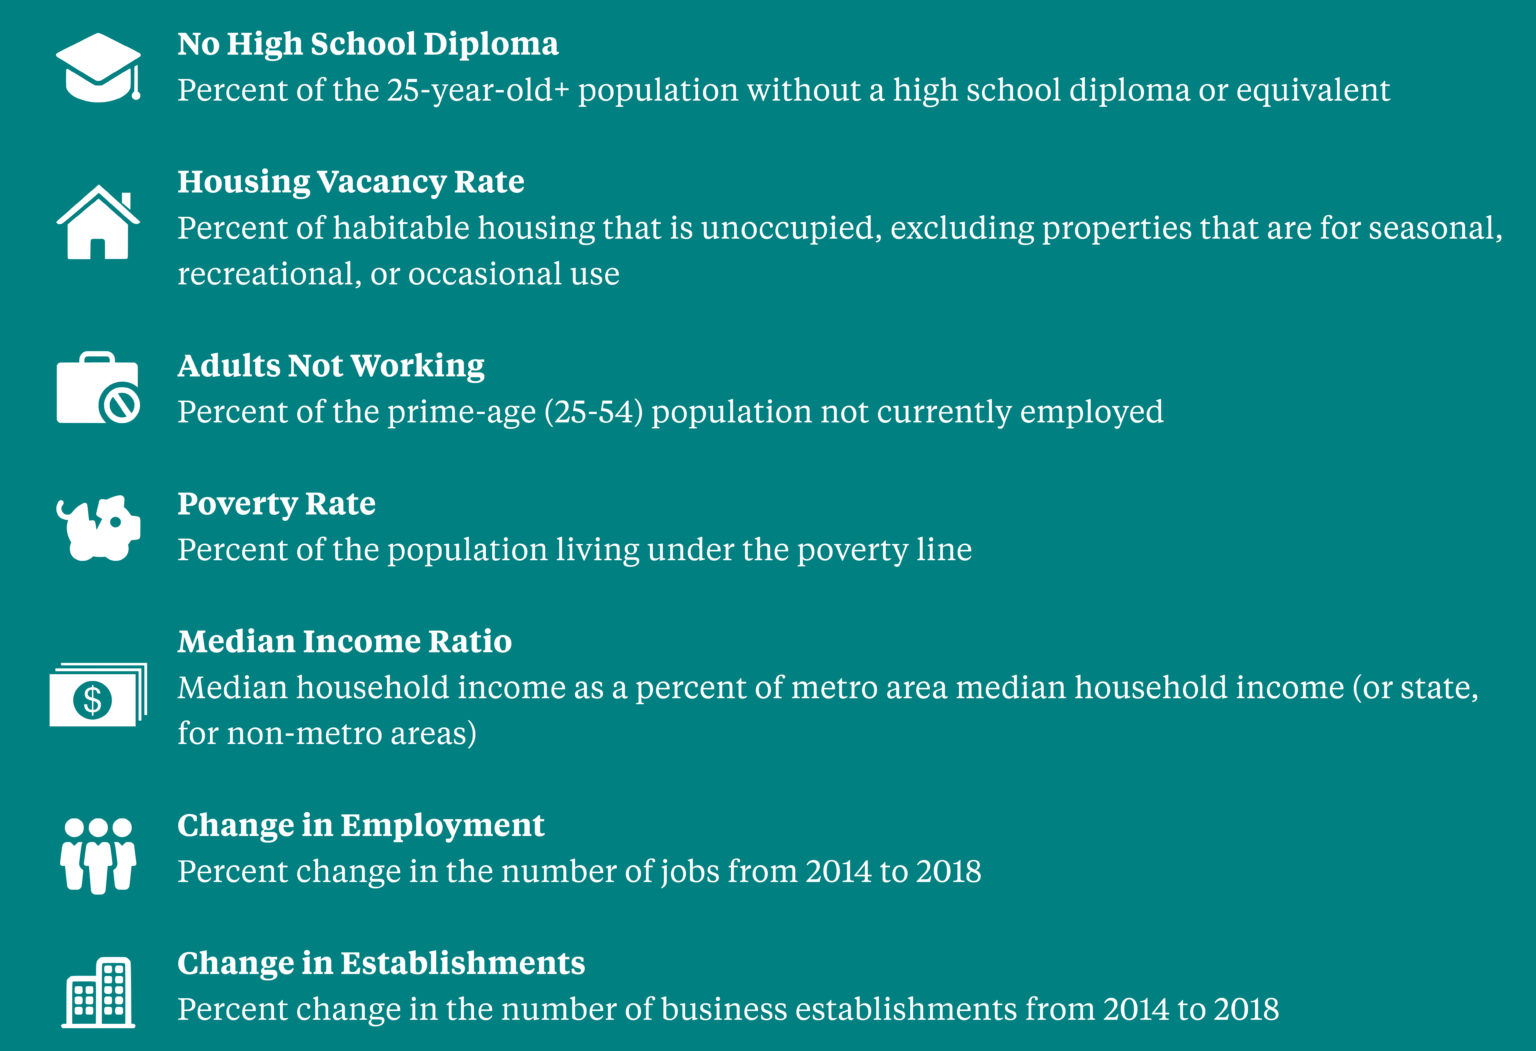
The resulting DCI composite measure assigns individual five-digit ZIP codes a number from 0 to 100 with 0 representing the least distressed communities and 100 representing the most distressed communities. The DCI is then grouped into five ordered categories for ease of comparison: distressed, at risk, mid-tier, comfortable, and prosperous. The data include details on 874 ZIP codes in Michigan that have at least 500 residents, of which 192 (22%) are prosperous communities and 120 (14%) are distressed communities. The map below (see Figure 2) highlights the distribution of community-level distress categories across the state of Michigan, with the blue areas representing more prosperous communities and the red areas representing more distressed communities.

Figure 2.

The data also reveal staggering racial/ethnic disparities in Michigan. As seen in Figure 3 below, Black/African American Michiganders are far more likely to live in distressed communities relative to non-Hispanic whites. This information is further evidence of the need for broad efforts to reduce disparities according to race/ethnicity and local community distress.

Figure 3.

Incorporating the DCI into MVC data analytics will offer new opportunities to better understand health equity challenges in Michigan. The MVC Coordinating Center looks forward to using these data in collaboration with its members and is eager to discuss how best to leverage such data sets to identify inequity in Michigan healthcare. Please contact MVC to learn more or request custom analytics.

0
View Post
BCBSM Initiative Incentivizes Data Collection on Social Factors

BCBSM Initiative Incentivizes Data Collection on Social Factors

Health equity is a top priority for providers across the country, who are keenly aware of the prevalence and exacerbation of existing health inequities. The state of Michigan in particular ranks poorly in measures of population health and social determinants of health (SDOH), which represent a huge opportunity to improve equity and health outcomes for patients. Health equity is currently a key strategic focus of the Michigan Value Collaborative (MVC) Coordinating Center in the years ahead, as well as for Blue Cross Blue Shield of Michigan (BCBSM). As work in this area grows, some suggest that better data collection is the next critical step to improving health equity.

Data collection is the focus of BCBSM’s latest initiative - the SDOH Standardized Data Collection and Aggregation Initiative - which offers incentives to physician organizations (POs) for collecting and submitting SDOH screening data. Its goal is to increase SDOH screening by primary care physicians during annual wellness visits as well as enhance SDOH data submitted to the Michigan Health Information Network (MiHIN), Michigan's nonprofit statewide health information network.

This data will be used in the short term to improve data conformance and SDOH definitions within the Michigan provider community. Ideally, this initiative will help BCBSM to improve care coordination between providers, identify gaps in resources and community-level social need trends, and provide analytics and reporting to the provider community. The long-term goal is to reduce disparities and improve health outcomes.

There are multiple pathways for POs to participate, primarily by either submitting screening data through MiHIN’s SDOH use case, or by developing infrastructure to enable participation in MiHIN’s SDOH use case. BCBSM sees this incentive program as an important step toward ensuring all patients receive the care they need.

“The SDOH initiative is valuable for both patients and providers because it encourages providers to screen for SDOH needs in patients and also encourages that the data from these screenings is exchanged in an interoperable way,” said Karolina Skrzypek, MD, Medical Director of Clinical Partnerships at BCBSM. “It is very important that providers across the state of Michigan have the ability to access SDOH screening data regardless of where the screening took place. Screening for SDOH needs by providers is the first step in helping to address these needs in our patients.”

These points were echoed by Martha M. Walsh, MD, MHSA, FACOG, Medical Director of Clinical Partnerships and Engagement at BCBSM, who said, “We know that when patients have SDOH needs, that it is more difficult for them to have their healthcare needs met and for patients to care for their chronic conditions. Our initial goal in having providers screen for SDOH needs is for patients to have their needs addressed at the point of care.”

Some POs are already actively submitting this data to MiHIN and can receive incentive payments for continuing to do so. The other pathways are focused on those who have capacity to store and extract SDOH data but are not submitting it to MiHIN, or those POs who don’t yet have the digital infrastructure in place. Helping all POs to achieve a similar capacity and submit their data to the same vendor will allow for a broader understanding of the gaps and communities in need of further funding.

“By aggregating this data, we hope to learn more about specific domains of need and geographic areas with the most needs so that we can start to address these more broadly,” said Dr. Walsh. “We hope that by screening for and addressing SDOH needs, we will start to be able to decrease disparities in care for our most vulnerable patients.”

Incentives for the MiHIN SDOH use case pathways are paid out of the BCBSM Physician Group Incentive Program (PGIP) reward pool. Therefore, any deadlines related to participation are based on PGIP payment cycles. Those POs wishing to participate in the October 2022 cycle should submit their opt-in form and any other required materials by the end of August.

A separate value-based reimbursement (VBR) reward was created specifically for patient-centered medical home (PCMH) designated primary care physicians for completing SDOH screenings using Z codes. This VBR payment was available when the SDOH initiative launched in January. Provider offices had six months to work towards meeting the criteria to receive VBR effective 9/1/2022. Criteria for the 2023 cycle was previously announced and updates to the criteria will be provided during the upcoming BCBSM September PGIP quarterly meeting.

Any POs or providers interested in learning more about this initiative and the pathways for participating can read the full brochure here and submit questions directly to BCBSM at POPrograms@bcbsm.com. In addition, if your PO or hospital has success stories or insights that have resulted from collecting SDOH screening data, please consider sharing your story and insights with the MVC Coordinating Center at michiganvaluecollaborative@gmail.com.

Support for MVC is provided by Blue Cross Blue Shield of Michigan as part of the BCBSM Value Partnerships program. Although BCBSM and MVC work collaboratively, the opinions, beliefs, and viewpoints expressed by the author do not necessarily reflect the opinions, beliefs, and viewpoints of BCBSM or any of its employees. To learn more about the Value Partnerships program, visit www.valuepartnerships.com.

0

MVC Coordinating Center Launches Health Equity Report

As hospitals begin to identify lessons learned since the start of the pandemic, providers are keenly aware of the prevalence and exacerbation of existing health inequities. Despite the fact that many providers are increasingly interested in addressing the social determinants of health (SDOH) and equitable access to care, communities of color and other minorities that are statistically more impacted by SDOH and socioeconomic status (SES) have endured even wider gaps in health outcomes and care this past year. For many hospitals and physician organizations, the way forward requires the application of a health equity or social risk lens across the board, so that basic healthcare and quality improvement decision-making can be maximized for all patient populations, not just those with fewer social risk factors. The MVC Coordinating Center is, therefore, proud to have released its first MVC Health Equity Report to its membership on Wednesday morning.

MVC began developing metrics for its membership in this area over the past year so providers might better understand where inequities are materializing within the four walls of their hospitals and beyond. One popular method for identifying low-SES patients is by determining where someone lives and applying population-level metrics to the individual. Examples of this would be using the Area Deprivation Index (ADI) or Social Vulnerability Index (SVI). Both indexes are based on census tract data and provide SES characteristics about a population within a specific geographic location (i.e., a census tract), including risk factors such as poverty, education level, transportation access, and housing security. However, in developing the MVC Health Equity Report, the MVC Coordinating Center elected to utilize a patient-level metric of SES that is compatible with MVC claims data. As a result, the report identifies low-SES patients using dual-eligibility status.

Dual-eligible beneficiaries are patients that are eligible for both Medicare and Medicaid. In the MVC Health Equity Report, dual eligibility is defined as having been eligible for both Medicare and Medicaid at any point during the year of the index admission and is limited to patients that were at least 65 years old at the time of admission. Medicaid eligibility is a good indicator of SES when using claims data since it is income-based, and studies have shown that there is a strong association between low-income status and adverse health outcomes. Dual eligibility allows MVC analysts to identify Medicaid-eligible patients within its more extensive Medicare data set for analyses. Medicare data on the MVC registry currently includes claims data from 1/1/2015 through 9/30/2020. The resulting reports prepared for members focuses on episodes occurring between 2017 and 2020, or between 2017 and 2019 if the circumstances of 2020 resulted in unusual case counts by facility.

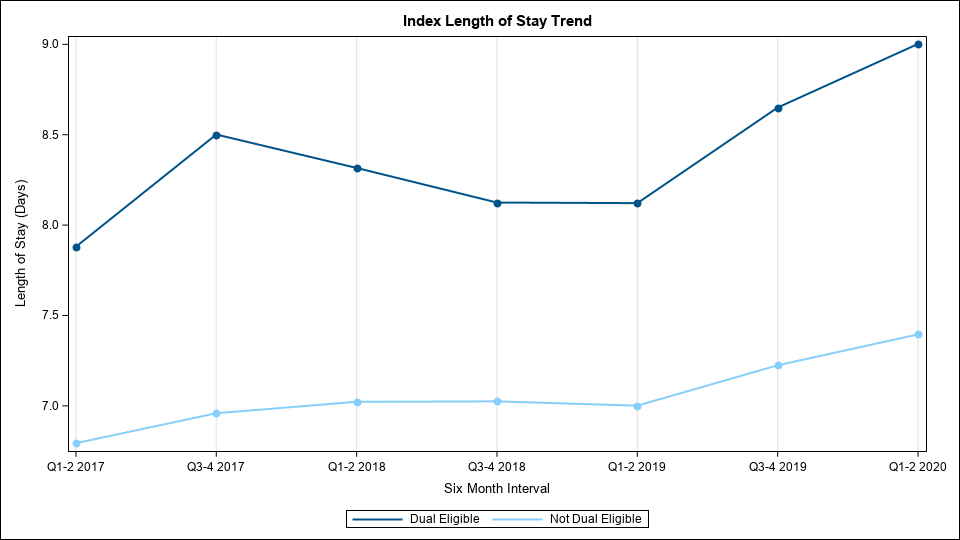
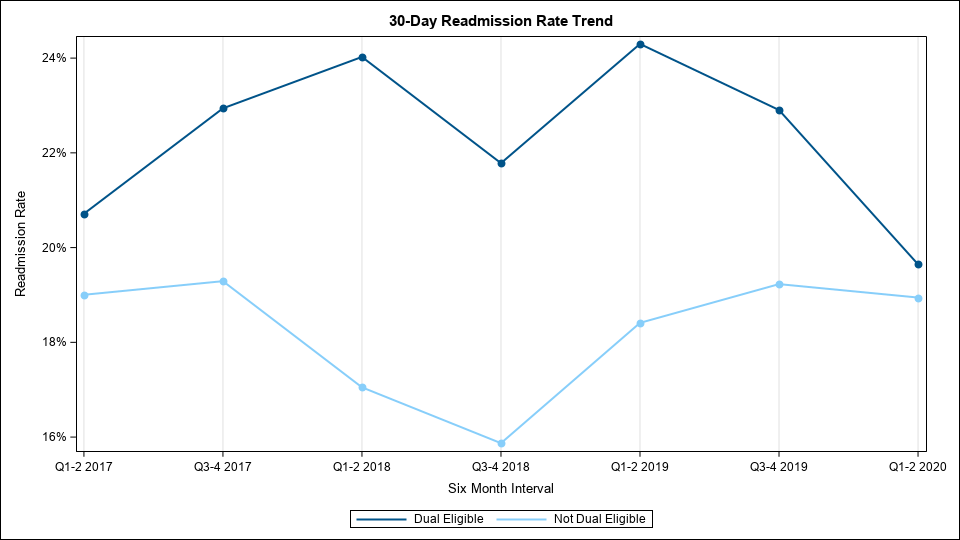
In developing this report, there was a conscious decision to exclude any sort of comparison group alongside each individual hospital's metrics. This is because the socioeconomic factors of a hospital’s patient population cannot be changed, and there is great diversity between hospitals throughout the state and within geographic regions. For those reasons, benchmarking was not the intention of this report. However, it is important to note that across the state, the data analyzed by the MVC Coordinating Center consistently indicates that dual-eligible patients have poorer outcomes than their non-dual-eligible counterparts, including longer lengths of stay, higher readmission rates, higher post-discharge emergency department utilization, lower rates of office visits post-discharge, higher rates of post-discharge outpatient procedures, and higher utilization of skilled nursing facilities. Blinded sample graphs for length of stay (Figure 1) and readmission rates (Figure 2) were created using data from three distinct, large hospitals in order to showcase some of these differences.

Figure 1.

Figure 2.

Members receiving reports will see a variety of graphs depicting, for example, total episode payment trends, 30-day readmission rate trends, and post-acute care utilization. Also provided is a table outlining a hospital or region’s highest volume of conditions within its dual-eligible population (see Figure 3 for a blinded sample). The purpose of this table is to help members better understand the proportion of dual-eligible patients at their hospital and the prevalence of various conditions within that population. It will also help members to better understand their report overall by identifying the conditions and procedures driving the various metrics included within it.

Figure 3.

MVC is eager to do more in this space in the months ahead. With the recently added Michigan Medicaid data on the MVC registry, the Coordinating Center has a new opportunity to more closely examine the types of disparities that are prevalent in healthcare. Additionally, with the addition of 13 rural or critical access hospitals to the collaborative in the past 12 months, the Coordinating Center aims to expand its metrics outside of the episode structure to examine population health metrics. This will allow for better understanding about healthcare delivery and how outcomes differ in rural regions compared to urban.

The MVC Coordinating Center wants to hear feedback from its members. With the addition of Medicaid data, we are working hard to develop more metrics and reports that focus on health equity. If you have any questions, comments, or suggestions, please contact the MVC Coordinating Center at michiganvaluecollabortative@gmail.com.