MVC Senior Advisor and former Director, Dr. Scott Regenbogen recently received funding from The Donoghue Foundation to lead a team of investigators to learn more about institutional participation in the MVC Component of the BCBSM P4P Program.
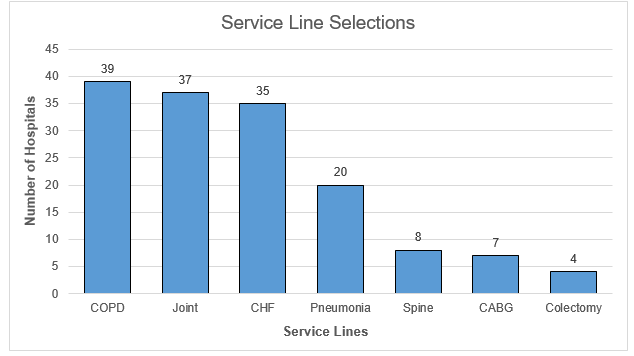
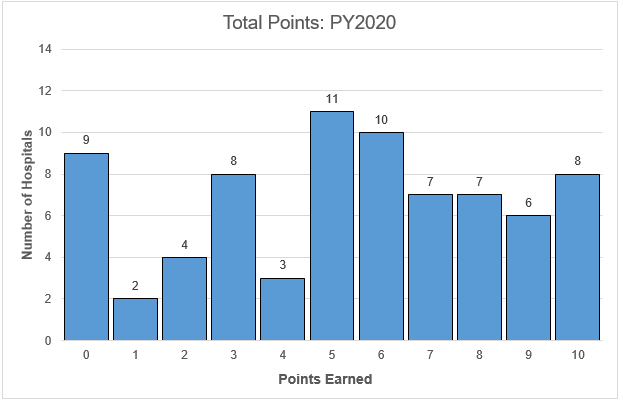
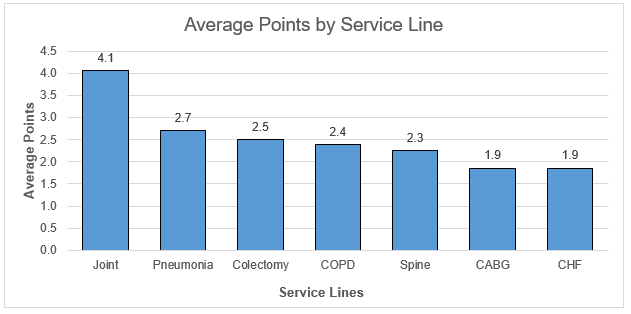
As part of this study, Dr. Regenbogen is interested in conducting virtual interviews with lead administrators who were involved with selecting service lines for performance year 2017-2018
 What is the value of participating? While participation in this study is completely voluntary and does not carry any bearing on P4P scoring, the insights gleaned from this work will help us to continue improving the MVC measure for the benefit of our members, and improve our understanding of successful strategies in commercial episode-based payment incentives.
What is The Donoghue Foundation? The Foundation supports a diverse portfolio of research projects, from understanding the mechanisms of disease, to improving clinical treatments, to public health initiatives that prevent illness – all founded on excellent science. To learn more about the organization and their mission, please visit https://donaghue.org/
Meet the Key Study Personnel
- Scott Regenbogen, MD, MPH. Dr. Regenbogen is an Associate Professor of Surgery and Chief of the Division of Colorectal Surgery at the University of Michigan (UM), and a Senior Advisor of the Michigan Value Collaborative (MVC). His research has focused on the role of perioperative care protocols in the costs, outcomes, and value of care around episodes of inpatient surgery, with a particular focus on older adults.
- Shelytia Cocroft, PhD. Dr. Cocroft is an applied medical sociologist and mixed-methodologist (qualitative and quantitative research designs). She is currently a qualitative research analyst at the University of Michigan’s Center for Healthcare Outcomes and Policy (CHOP) and is collaborating on qualitative centric projects designed to identify systemic and structural mechanisms within surgical care that perpetuate inequalities in access, quality, and delivery of care.
- Ashley Duby, MS. Ms. Duby is the Research Director for the Division of Colorectal Surgery within the Department of Surgery and has been working with Dr. Regenbogen for the past 6 years. She has extensive experience in development and deployment of fieldwork protocols in diverse settings – including patient and provider populations.
If you have any questions or would like further information related to this project, please contact Ashley Duby, Research Director at agay@med.umich.edu.