0
View Post
MVC Distributes New Push Report Dedicated to P4P Conditions

MVC Distributes New Push Report Dedicated to P4P Conditions

MVC launched a new push report this week dedicated to the MVC P4P conditions. Its purpose is to support hospitals in identifying areas of opportunity within past and present conditions of the MVC Component of the Blue Cross Blue Shield of Michigan (BCBSM) Pay-for-Performance (P4P) Program. The conditions currently included in P4P and in this report are chronic obstructive pulmonary disease (COPD), congestive heart failure (CHF), colectomy (non-cancer), coronary artery bypass graft (CABG), joint replacement (hip and knee), pneumonia, and spine surgery. Acute myocardial infarction (AMI) is also included in this report as a historical P4P condition. Hospitals received a page for each condition if they met a case count threshold of 11 episodes in 2019 and 2020.

This report was limited to episodes included in the P4P program with index admissions in 2019 and 2020, and thus included the following payers: BCBSM Preferred Provider Organization (PPO), BCBSM Medicare Advantage, Blue Care Network (BCN) Health Maintenance Organization (HMO), BCN Medicare Advantage, and Medicare Fee-For-Service (FFS). To align with the P4P program, MVC excluded patients with a discharge disposition of inpatient death or transfer to hospice, episodes that started with an inpatient transfer, and episodes with a COVID-19 diagnosis on a facility claim in the inpatient setting. To fully exclude COVID-19 patients, pneumonia episodes in March 2020 were also excluded.

The reports provided data on hospital trends in episode payments, readmission rates, post-acute care utilization, and emergency department utilization for P4P patients. Data from the push report can be used in conjunction with the registry reports to inform areas of opportunity in the P4P conditions. The push reports also provided a snapshot of each hospital’s P4P patient population (see Figure 1), including race, mean age, and the average number of comorbidities.

Figure 1. Patient Population Snapshot for Blinded Hospital

For Critical Access Hospitals (CAHs), the report also included index length of stay. For acute care hospitals, the report included a “reasons for readmissions” table that identified the top five reasons a P4P patient was readmitted. However, this table was removed from the report’s joint replacement page due to low readmission rates among joint replacement surgeries. In its place, acute care hospitals received their ratio of outpatient to inpatient surgeries.

As with other push reports, hospitals were compared to other members in the collaborative for select measures. For acute care hospitals, each hospital’s report includes a comparison point for all MVC episodes (“MVC All”) as well as for episodes at hospitals in the same geographic region (“Your Region”). These reference points do not include episodes that occurred at hospitals with a CAH designation. Similarly, the reports distributed to CAHs included comparison points for MVC episodes at all CAHs in the collaborative (“CAH Average”).

This report takes the place of the cardiac service line reports, which included data on CHF, AMI, and CABG. The new P4P conditions push report uses many of the same measures and figures from the cardiac service line reports, but for the complete list of P4P conditions.

For more information on the MVC Component of the P4P Program, see the MVC P4P Technical Document. Please share your feedback on the newest P4P conditions push report with the MVC Coordinating Center at michiganvaluecollaborative@gmail.com.

0

MVC Shares New Pneumonia Push Report with Hospitals

The Michigan Value Collaborative (MVC) introduced its first ever pneumonia push report this week when the Coordinating Center shared individualized reports with 89 hospitals across Michigan. This report was created in response to member interest and incorporated 30-day claims-based episodes with index admissions from 1/1/18 – 12/31/20 for the following payers: Medicare FFS, Blue Cross Blue Shield of Michigan (BCBSM) PPO Commercial, Blue Care Network (BCN) Commercial, BCBSM MA, BCN MA, and Medicaid. Reports were created for all MVC member hospitals that had at least 11 pneumonia episodes per year in 2018, 2019, and 2020.

One goal for this report was to provide data that would be useful for a broad range of MVC’s increasingly diverse membership. Critical Access Hospitals (CAHs), for example, are some of MVC’s newest members and differ in several meaningful ways from other hospitals in the collaborative. Therefore, MVC distributed two different versions of the pneumonia report in order to refine comparison groups and provide a more tailored view of the data. As a result, 81 general acute care hospitals received a pneumonia report comparing their performance to 1) all other eligible general acute care hospitals in the collaborative and 2) acute care hospitals in their geographic region. The second version of the report was shared with eight eligible CAHs, which compared their performance to other MVC CAHs. By providing hospitals with tailored comparison groups when appropriate, MVC hopes to strengthen the usability of its claims-based data to inform quality improvement initiatives.

After much consideration, the MVC team decided to remove any pneumonia episodes containing a confirmed diagnosis of COVID-19 (U07.1) in the first three diagnosis positions of an inpatient facility claim from this report. Members can now replicate this approach on the MVC registry for episodes from April 2020 or later using the new COVID-19 filter, which allows users to include or exclude episodes that contained an inpatient facility claim with a confirmed COVID-19 diagnosis. For the purposes of this push report, the Coordinating Center further excluded all pneumonia episodes from March 2020 in order to remove COVID-19 hospitalizations that occurred in Michigan before an official COVID-19 diagnosis code was available and were coded as pneumonia.

Measures included in the pneumonia report were trends in average price-standardized risk-adjusted total episode payments, average index length of stay, index in-hospital mortality rates, trends in 30-day readmission rates, rates of 30-day post-acute care utilization, and rates of seven-day outpatient follow-up. Overall, the Coordinating Center found that the in-hospital mortality rate for both groups of hospitals was about 2%. One noticeable difference between the two report groups was that CAHs had a shorter average length of stay for index pneumonia hospitalizations (4.6 days, see Figure 1) than general acute care hospitals (5.8 days, see Figure 2).

Figure 1. Average Index Length of Stay at CAHs

Figure 2. Average Index Length of Stay at Acute Care Hospitals

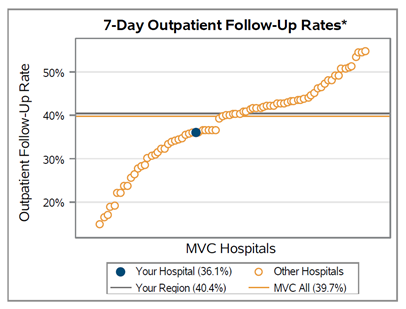
Post-acute care utilization rates were stratified by emergency department (ED), home health, rehabilitation, and skilled nursing facility (SNF). In general, the most frequently utilized category of post-acute care for pneumonia episodes was home health at a rate of 20% for acute care hospitals (see Figure 3) and 24% for CAHs (see Figure 4). Furthermore, there was wide variability in seven-day outpatient follow-up rates for both types of hospitals, but the average for acute care hospitals was higher at 39.7% (see Figure 5) compared to 24.4% (see Figure 6) for CAHs.

Figure 3. 30-Day Post-Acute Care Utilization Rates at Acute Care Hospitals

Figure 4. 30-Day Post-Acute Care Utilization Rates at Critical Access Hospitals

Figure 5. Seven-Day Outpatient Follow-Up Rates at Acute Care Hospitals

Figure 6. Seven-Day Outpatient Follow-Up Rates at Critical Access Hospitals

By understanding the unique needs of its members, MVC can improve future reports for use in quality improvement activities. If your hospital is interested in sharing feedback about the new pneumonia report or has a specific follow-up request, please reach out to the Coordinating Center at michiganvaluecollaborative@gmail.com.

0

The Michigan Value Collaborative’s Refreshed Cardiac Service Line Reports

The Michigan Value Collaborative (MVC) Coordinating Center disseminated it’s long-running customized cardiac service line report to hospital and physician organization (PO) members on February 23, 2021. These reports provide hospital-level information on congestive heart failure (CHF), acute myocardial infarction (AMI), and coronary artery bypass graft (CABG) conditions. To receive information on any one of these conditions, a hospital must have at least 20 cases per year over the three-year reporting period (1/1/17 – 12/31/19).

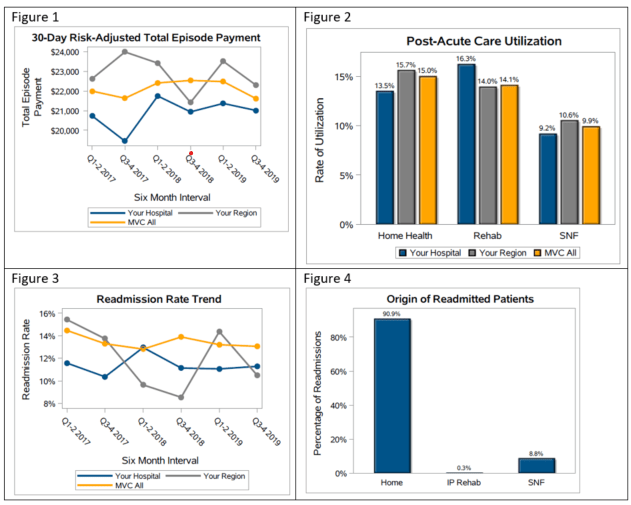
Since the last iteration of the cardiac service line report sent in June 2020, the Coordinating Center has defined four distinct regions within Michigan, allowing members to make regional comparisons. These comparisons have been incorporated into the 30-day risk-adjusted total episode payment trend chart, the post-acute care utilization bar graph, and the 30-day readmission rate trend chart of the reports as shown in the following AMI figures for a fictional institution, Hospital A.

Acute Myocardial Infarction Figures. Hospital A

Figure 1 shows the 30-day risk-adjusted total episode payments broken up into six-month intervals, illustrating that episode payments for AMI hold steady across the Collaborative at an average of around $22,000. Please note that as with all MVC reports, this represents price standardized dollars to allow for fair comparisons between hospitals. The price standardized dollars can be thought of as a measure of utilization as opposed to true dollar amounts.

Figure 2 displays the percentage of AMI patients who utilized home health (15.0% across MVC), rehab (14.1% across MVC), or skilled nursing facilities (9.9% across MVC). Figure 3 illustrates that, between 2017 and 2019, approximately 14% of AMI patients were readmitted within 30 days. Finally, Figure 4 shows Hospital A that based on the most recent claim before a readmission occurred, 90.9% of readmitted patients were coming from home, 8.8% were coming from Skilled Nursing Facilities (SNF), and very few were coming from inpatient rehabilitation (0.3%). Hospitals can use this information to observe if they are an outlier in any of the categories and where they may have an opportunity to improve, to benchmark themselves against the MVC all and regional averages, and to notice trends in their performance

These combined-payer push reports are distributed twice a year, meaning the next iteration is likely to be sent out in the summer of 2021. In the meantime, single-payer information is always available on the MVC registry, allowing for continued monitoring of these metrics. Data is added every month for Blue Cross payers and quarterly for Medicare. Michigan Medicaid data will be live on the registry at the start of Q2 this year.

If you need registry access, if you have ideas on how these reports can be made more versatile, or if you are using these data for a quality improvement project at your institution, please contact michiganvaluecollaborative@gmail.com. Additionally, please reach out if you want further information in the way of custom analytics.