0
View Post
Semi-Annual Summary: Turning Data & Collaboration into Action

Semi-Annual Summary: Turning Data & Collaboration into Action

The Michigan Value Collaborative (MVC) held its first semi-annual meeting of 2022 last Friday. A total of 158 leaders joined the MVC Coordinating Center’s virtual meeting, representing 68 different hospitals and 15 physician organizations (POs) from across the state of Michigan. “Turning Data and Collaboration into Action” was the theme of this year’s first semi-annual, putting the spotlight on quality initiatives that successfully leveraged data or collaboration to bring about improvements in healthcare.

MVC’s Director, Dr. Hari Nathan, kicked off Friday’s meeting with an update from the MVC Coordinating Center. He welcomed two new collaborative members, McLaren Caro Region and UP Health System - Bell, as well as MVC’s newest team member, Engagement Associate Chelsea Andrews. Dr. Nathan also highlighted the successes delivered by the Coordinating Center during the first six months of 2022. This included the incorporation of Medicaid data into MVC’s suite of push reports to provide a more complete view of the collaborative’s patient population, the launch of three new push reports (colectomy, pneumonia, and P4P), and the incorporation of additional demographic data into MVC's reporting.

MVC’s recent Qualified Entity accreditation was also highlighted, representing a breakthrough for the collaborative that will allow the relaxation of certain data use agreement regulations and improve the granularity of data available to members. As part of extending this improved access, the Coordinating Center will reach out to site coordinators to have authorized representatives at each institution complete a new data use form. To align with the security requirements of the Qualified Entity program, the MVC registry will also begin requiring multi-factor authentication for users upon login. More information on each of these elements will be shared with the collaborative in the coming weeks. Chelsea Abshire Pizzo, MVC’s Manager of Analytics, rounded off the meeting welcome by sharing some highlights from Program Year 2021 of the MVC Component of the Blue Cross Blue Shield of Michigan Pay-for-Performance (P4P) Program.

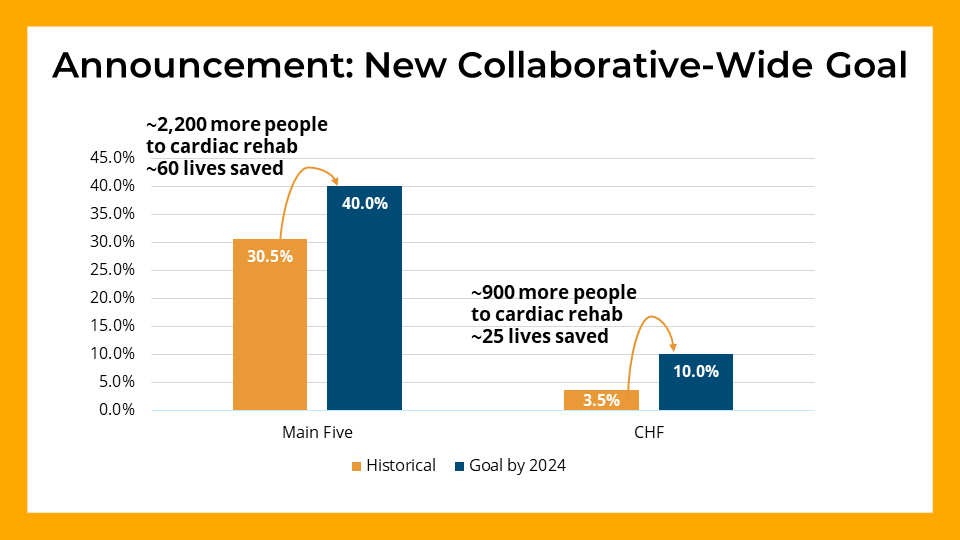
Showcasing opportunities where MVC data can drive change was a focal point for the meeting. Utilizing unblinded data from the collaborative, MVC Analyst Jessica Yaser led attendees through a data session focused on MVC’s two Value Coalition Campaigns (VCCs): Preoperative Testing and Cardiac Rehab. This allowed attendees to see their preoperative testing and cardiac rehab utilization rates compared to their peers. Hospitals performing well were invited to offer insights as to how this was achieved and what mechanisms other hospitals could adopt to improve performance levels. Jessica also announced new collaborative-wide goals around cardiac rehab utilization rates (see Figure 1), which will continue to be promoted and highlighted in the months ahead.

Figure 1.

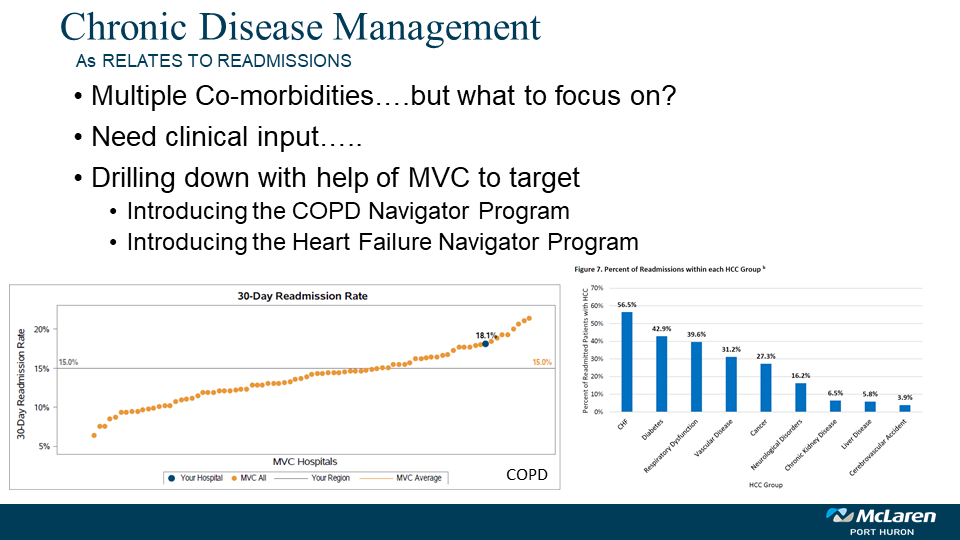
With the scene set, MVC welcomed guest speakers Mary Pool and Holly Gould from McLaren Port Huron hospital. Mary and Holly provided attendees with an overview of how they have used MVC data to help tackle high readmission rates for the congestive heart failure (CHF) and chronic obstructive pulmonary disease (COPD) patient populations at McLaren Port Huron. Specifically, data provided by the Coordinating Center helped confirm the suspicion that although follow-up rates were high across the institution, this wasn’t being translated into a reduction in readmissions. Stratifying these data further helped McLaren Port Huron introduce tailored initiatives in the form of their COPD and Heart Failure Navigator Programs, aimed at driving the effectiveness of follow-up visits (see Figure 2).

Figure 2.

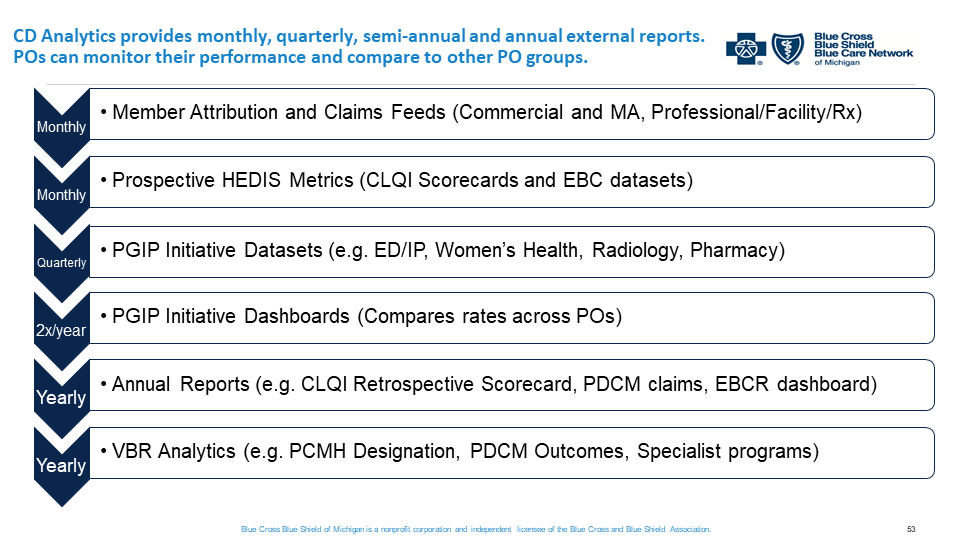
After hearing from McLaren Port Huron, Michelle Marchese from BCBSM provided an overview of how their Physician Group Incentive Program (PGIP) platform supports value-based care. As part of this, Michelle provided a walk-through of the current state of BCBSM data and report sharing, outlining how these all fit together to provide valuable healthcare insights for physician organizations (POs) (see Figure 3). MVC’s ongoing partnership with BCBSM to identify PO-level opportunities for improvement was also highlighted – a collaboration that will continue moving forward to enhance the level of support available to POs across the state. Michelle then passed the baton to Dr. Shannon Martin from MyMichigan Health who shared how MyMichigan has used its internal data to develop, implement, and assess its “Health Aging Program.” This initiative is aimed at decreasing the use of high-risk medications in the elderly population, saving many seniors from the harm of adverse drug effects.

Figure 3.

The meeting concluded with a summary of the day and key upcoming activities, led by MVC Engagement Associate Chelsea Andrews. The recording from Friday’s meeting is available here. If you have questions about any of the topics discussed at the semi-annual or are interested in finding out more about MVC, please reach out to the Coordinating Center. MVC’s next semi-annual meeting will be in person on Friday, October 28 at the Radisson in Lansing – we look forward to seeing you all then!

0
View Post
MVC Integrates Surgeon-Level Data in Latest Preop Reports

MVC Integrates Surgeon-Level Data in Latest Preop Reports

In 2020, the Michigan Value Collaborative (MVC) introduced the Preoperative Testing Value Coalition Campaign (VCC) with the aim of reducing the use of unnecessary preoperative testing for surgical procedures. Preoperative testing, especially in low-risk surgical procedures, often provides no clinical benefits to patients but is ordered regularly at hospitals across Michigan. As part of MVC’s campaign to eliminate unnecessary and potentially harmful preoperative testing, the Coordinating Center developed a related push report, the latest version of which was shared earlier this week to help members benchmark data for common preoperative tests. MVC and the Michigan Surgical Quality Collaborative (MSQC) partnered to distribute these reports more widely and to encourage clinical and quality personnel to work together in identifying patterns and exploring new strategies.

This iteration of the report is the first to include blinded surgeon-level reporting, which will allow for a more nuanced understanding of variation within a given hospital. To include this, the Coordinating Center attributed one surgeon per episode based on condition-specific BETOS codes and NPI specialty information, with the understanding that the attributed surgeon may not be the individual ordering the preoperative test for that procedure. If their MVC data indicates wide variation between specific providers, hospitals may choose to drill down into their own data to investigate further. For hospitals that have several surgeons with enough cases for these procedures, there was significant variation in testing rates (see Figure 1).

Figure 1. Rate of Any Preoperative Test by Surgeon (Blinded Report)

Included in the report were patients undergoing elective and outpatient laparoscopic cholecystectomy, laparoscopic inguinal hernia repair, and lumpectomy. It incorporated index admissions between 1/1/2018 – 12/31/2020 for Blue Cross Blue Shield of Michigan (BCBSM) PPO Commercial, BCBSM Medicare Advantage, Blue Care Network (BCN) HMO Commercial, BCN Medicare Advantage, Medicare Fee-For-Service (FFS), and Michigan Medicaid. Hospitals only received a report if they had 11 or more cases in at least one of the three conditions and at least 11 cases per year in the three procedures combined. The analysis evaluated the use of the following tests using CPT codes: electrocardiogram, echocardiogram, cardiac stress test, complete blood count, basic metabolic panel, coagulation studies, urinalysis, chest x-ray, and pulmonary function.

In general, the report demonstrated significant variation in testing rates between members, with some testing rates ranging from 20% to over 90%. Due to the amount of variation, MVC suspects that preoperative testing is overused at the state level such that even hospitals that are average or below average may still have significant opportunities to safely reduce preoperative testing. The report included a table with each hospitals’ rates for each procedure and test, with accompanying comparisons to the rates of regional peers and the collaborative as a whole (see Figure 2).

Figure 2. Preoperative Testing Rates Table (Blinded Report)

The report also included figures for preoperative testing rates by specific tests, by payer, and by procedure. The variety of figures is meant to help hospitals better understand its variability in utilization, since specific procedures or tests may be driving their overall testing rate. One figure, for example, presents a hospital's three procedure-specific testing rates alongside their overall or “combined procedures” rate. To more easily identify areas of opportunity to reduce their overall testing rate, a hospital can compare their procedure-specific rates to determine which is driving their average, as well as compare their average to those of their regional peers and the collaborative as a whole (see Figure 3).

Figure 3. Rate of Any Preoperative Test by Procedure (Blinded)

In the case of the blinded example above, this hospital is more frequently ordering preoperative testing in cholecystectomy patients but is ordering fewer tests on average than their peers for all procedures combined. This finding is atypical since lumpectomy was found to have a higher testing rate in general; cholecystectomy testing rates were generally lower. In addition, MVC found that electrocardiography and blood tests (complete blood count, basic metabolic panel, coagulation studies) had the highest testing rates across all procedures.

Helping MVC members to make internal and external data comparisons is core to MVC reporting and is critical to its efforts to reduce unnecessary testing. As part of MVC's continued efforts in this area, the Coordinating Center will share hospital-level preoperative testing data at its upcoming semi-annual meeting in order to foster continued awareness of wide practice variation and encourage best practice sharing between members.

MVC is eager to drive improvement in this area. For more information on how MVC is working to reduce unnecessary preoperative testing, visit its Value Coalition Campaign webpage here. If you are interested in a more customized report or would like information about MVC’s preop testing stakeholder working group, please contact the MVC Coordinating Center at michiganvaluecollaborative@gmail.com.

0

MVC Shares New Pneumonia Push Report with Hospitals

The Michigan Value Collaborative (MVC) introduced its first ever pneumonia push report this week when the Coordinating Center shared individualized reports with 89 hospitals across Michigan. This report was created in response to member interest and incorporated 30-day claims-based episodes with index admissions from 1/1/18 – 12/31/20 for the following payers: Medicare FFS, Blue Cross Blue Shield of Michigan (BCBSM) PPO Commercial, Blue Care Network (BCN) Commercial, BCBSM MA, BCN MA, and Medicaid. Reports were created for all MVC member hospitals that had at least 11 pneumonia episodes per year in 2018, 2019, and 2020.

One goal for this report was to provide data that would be useful for a broad range of MVC’s increasingly diverse membership. Critical Access Hospitals (CAHs), for example, are some of MVC’s newest members and differ in several meaningful ways from other hospitals in the collaborative. Therefore, MVC distributed two different versions of the pneumonia report in order to refine comparison groups and provide a more tailored view of the data. As a result, 81 general acute care hospitals received a pneumonia report comparing their performance to 1) all other eligible general acute care hospitals in the collaborative and 2) acute care hospitals in their geographic region. The second version of the report was shared with eight eligible CAHs, which compared their performance to other MVC CAHs. By providing hospitals with tailored comparison groups when appropriate, MVC hopes to strengthen the usability of its claims-based data to inform quality improvement initiatives.

After much consideration, the MVC team decided to remove any pneumonia episodes containing a confirmed diagnosis of COVID-19 (U07.1) in the first three diagnosis positions of an inpatient facility claim from this report. Members can now replicate this approach on the MVC registry for episodes from April 2020 or later using the new COVID-19 filter, which allows users to include or exclude episodes that contained an inpatient facility claim with a confirmed COVID-19 diagnosis. For the purposes of this push report, the Coordinating Center further excluded all pneumonia episodes from March 2020 in order to remove COVID-19 hospitalizations that occurred in Michigan before an official COVID-19 diagnosis code was available and were coded as pneumonia.

Measures included in the pneumonia report were trends in average price-standardized risk-adjusted total episode payments, average index length of stay, index in-hospital mortality rates, trends in 30-day readmission rates, rates of 30-day post-acute care utilization, and rates of seven-day outpatient follow-up. Overall, the Coordinating Center found that the in-hospital mortality rate for both groups of hospitals was about 2%. One noticeable difference between the two report groups was that CAHs had a shorter average length of stay for index pneumonia hospitalizations (4.6 days, see Figure 1) than general acute care hospitals (5.8 days, see Figure 2).

Figure 1. Average Index Length of Stay at CAHs

Figure 2. Average Index Length of Stay at Acute Care Hospitals

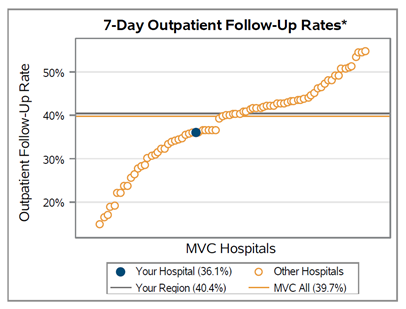
Post-acute care utilization rates were stratified by emergency department (ED), home health, rehabilitation, and skilled nursing facility (SNF). In general, the most frequently utilized category of post-acute care for pneumonia episodes was home health at a rate of 20% for acute care hospitals (see Figure 3) and 24% for CAHs (see Figure 4). Furthermore, there was wide variability in seven-day outpatient follow-up rates for both types of hospitals, but the average for acute care hospitals was higher at 39.7% (see Figure 5) compared to 24.4% (see Figure 6) for CAHs.

Figure 3. 30-Day Post-Acute Care Utilization Rates at Acute Care Hospitals

Figure 4. 30-Day Post-Acute Care Utilization Rates at Critical Access Hospitals

Figure 5. Seven-Day Outpatient Follow-Up Rates at Acute Care Hospitals

Figure 6. Seven-Day Outpatient Follow-Up Rates at Critical Access Hospitals

By understanding the unique needs of its members, MVC can improve future reports for use in quality improvement activities. If your hospital is interested in sharing feedback about the new pneumonia report or has a specific follow-up request, please reach out to the Coordinating Center at michiganvaluecollaborative@gmail.com.
0

Considerations for a System Approach to Quality Improvement

As healthcare systems continue to grow and expand, organizational leadership must consider how to implement quality improvement projects across multiple sites and venues. Currently, quality improvement is implemented using a variety of efforts and methods including project-based and system-wide change. A study published in the International Journal of Environmental Research and Public Health (IJERPH) shared information about how several healthcare organizations overcame challenges to accomplish sustainable system change.

For many years, healthcare organizations have worked to improve the quality of their delivery systems with the understanding that their complexity and flexibility can affect the change process. One of the early studies on this challenge identified three conditions that need to be in place for a quality improvement project to be effective:

  • A focus on areas of priority with carefully designed interventions
  • An organization that is prepared and ready for change evidenced by capable leadership, good relations with staff, and supportive information systems
  • A favorable external environment, especially regarding beneficial regulations, payment policies, and competitive factors.

Hospitals that successfully implemented QI projects hospital-wide relied on a commitment from leadership, the use of a daily management system, and quality improvement training. It was noted that those organizations more successful in QI efforts had boards that placed a priority on QI implementation, balanced short-term priorities with long-term investment in QI, used data for improvement, engaged patients and staff in the QI work, and encouraged continuous improvement culture.

The Quality and Safety in Europe by Research (QUASER) guide was used by the IJERPH study authors to assess the hospital cases they examined. This QUASER guide, now an internationally renowned framework, was first developed to aid senior leaders in facilitating systemic, detailed discussions about system-wide quality improvements. It identifies eight challenge areas (further defined in Figure 1) that healthcare organizations should address to ensure successful system-wide improvements: leadership, politics, culture, education, emotion, physical and technological infrastructure, structure, and external demands.

Figure 1.

In assessing the case studies, the IJERPH study authors found that successful QI projects had addressed each of these challenges. They also found that, although a few of the QUASER challenges were missing more often than others, many of them overlap and none of the challenges on their own were directly linked to successful projects.

While many QI managers and executive teams focus more on centralized and system-level QI improvement, clinical teams often focus on improvements at the local level with a desire to improve care at the site of delivery. Local QI efforts should be aligned with centralized efforts across health systems to enhance effectiveness and reduce the burden on clinicians. By utilizing a hybrid of local and centralized methods of QI, project awareness can be aligned, and prioritization can occur between the system leadership and local clinical areas. In addition, the IJERPH study highlighted the importance of making leaders accessible. System leaders need to prioritize communication with frontline staff so they understand the system-wide changes they are working toward.

The Michigan Value Collaborative is interested in learning more about the healthcare systems within Michigan and how system-wide quality improvement efforts are being chosen, implemented, and sustained. The Coordinating Center would like to hold discussions with leadership teams to better understand this work within the Collaborative. Let MVC know how its offerings can better serve your system-level initiatives by contacting michiganvaluecollaborative@gmail.com.
0

Happy New Year from the MVC Coordinating Center

The Michigan Value Collaborative Coordinating Center wishes you peace, joy, and prosperity throughout the coming year. Thank you for your continued support and partnership. MVC looks forward to working with you in the years to come and wishes you all the best as you embark on the new year ahead. Happy New Year!

0

Happy Holidays from the MVC Coordinating Center

As the holiday season is upon us, Michigan Value Collaborative staff reflect on the past year and those who helped to shape healthcare in 2021. It’s been quite a year for us all! The MVC Coordinating Center appreciates working with you and hopes that the holidays bring you health and happiness.

0
View Post
Patient-Reported Outcomes Improve Quality, Equity of Care

Patient-Reported Outcomes Improve Quality, Equity of Care

For several years, patient-reported outcomes (PROs) have been a topic of interest, in part due to increased utilization of electronic data and the integration of delivery systems. PROs are defined by the Food and Drug Administration (FDA) and National Quality Forum as "any report of the status of a patient's health condition that comes directly from the patient, without interpretation of the patient's response by a clinician or anyone else." In short, PRO tools ask patients questions to measure how they feel and what they are experiencing. With patient-reported outcome measures (PROMs), patients provide information about their health, quality of life, and functional status, either in absolute terms (e.g., pain severity rating) or in response to treatment changes (e.g., new nausea onset). The goal of gathering this information from the patient’s perspective without any interpretation from a healthcare provider is to improve both the quality of care being delivered and health outcomes.

The use of PROs has a variety of potential benefits. They can elicit enhanced patient engagement, be used to clarify the patient’s priorities and thus improve shared decision-making between patients and providers, and can bring to light any benefits or harms of interventions. The potential impact of PROs, therefore, is substantial because involving patients in their healthcare is linked to a myriad of positive patient outcomes. For example, based on a review of studies investigating patient participation, some of the benefits to patients include:

  • increased satisfaction and trust,
  • empowerment,
  • greater self-efficacy to manage health,
  • higher quality of life,
  • better understanding of condition and personal requirements,
  • improved adherence to medical treatment plans,
  • improved communication about symptoms with positive and lasting effects on health.

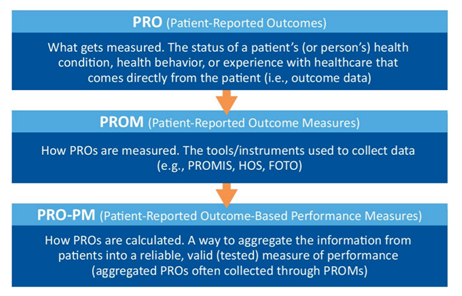
Ever increasing in its availability, the use of PROs is included in clinical investigations, healthcare practice, healthcare management, and various regulatory or reimbursement areas. As the patient continues to become more central to healthcare, they are in the best position to determine if their healthcare objectives have been achieved. PROMs are not the same as measures reported by patients on their experience of the healthcare system, such as being treated with dignity or waiting too long; however, patient-reported outcome-based performance measures (PRO-PMs) are beginning to find their way into healthcare and may integrate such measures. To help understand the relationship between PROs, PROMs, and PRO-PMs, see Figure 1, which was designed by the Centers for Medicare and Medicaid Services (CMS) in their supplemental guide on PROMs.

Figure 1.

To gather PROs, the tools and instruments known as PROMs must measure criteria that are identifiable, valid, and reliable. Most often these are general or disease-specific self-completed questionnaires, scales, or single-item measures that provide a score for any of the following:

  • functional status,
  • health related quality of life,
  • symptom and/or symptom burden,
  • personal experience of care,
  • health-related behaviors.

Generic PROMs often delve into areas covered by a variety of different conditions, allowing for comparisons across multiple medical conditions. These PROMs help with evaluation and implementation of care provision methodology and equality of service delivery. Some may even provide a cost-effectiveness component. Disease-specific PROMs identify the impact of definitive symptoms on the condition. PROMs can be used as either the primary or secondary outcome measure of a study or trial, and most studies use a combination of disease-specific and generic PROMs.

Measurement tools integrate other existing data (biological, genetic, clinical, and physical) to assess how a patient is functioning regarding their overall health, quality of life, mental well-being, or satisfaction with a healthcare process. Using all these data sources provides a more complete picture of the patient’s health journey and allows for patients and their providers to share decision-making and define individualized care. They also provide a unique opportunity to identify inequalities in healthcare access and treatment.

When utilizing PROMs, practitioners must plan for how the information will be collected and utilized. PROMs can be collected in a variety of ways, including face-to-face interviews, online or paper questionnaires, telephone interviews, or diaries. When deciding which PROMs to utilize, it is important to consider the preferences of patients, providers, and any other involved decision-makers. It is also essential to consider the cognitive, physical, demographic, and socioeconomic barriers that may exist for the patient to ensure they have adequate accommodations to participate. The length, schedule, and timeframe of assessments should also be appropriately assessed, along with any permissions needed to use the information. Lastly, the PROMs should be easy to score and interpret, actionable, and able to facilitate clinical decisions.

The use of PROs is here to stay. The hope is that improvements in interoperability, data governance, security, privacy, and ethics will allow greater integration of PROs. In turn, PROs will allow patient preferences, needs, and health outcomes to further drive value-based healthcare.

0

Predictive Analytics Assist with Chronic Disease Prevention

The healthcare system has an immense wealth of information at its digital fingertips. Big data is constantly expanding from sources such as digitized patient records, patient wearables, medical apps, genome datasets, monitoring devices, and more. A critical challenge facing hospitals and health systems today is in effectively identifying strategies and personnel to utilize big data in a way that influences clinical care. Those that succeed in this task will find themselves in a much better position to advance care and improve patient outcomes.

One developing strategy to convert big data sets into improved patient outcomes is the use of predictive analytics, an approach that differs from what many hospital quality improvement departments are currently utilizing. For example, the Michigan Value Collaborative (MVC) Coordinating Center has been helping hospitals identify opportunities for quality improvement since 2013 by aggregating and analyzing payor claims data and presenting the results on the registry and in analytics reports. The goal of these efforts is to help hospitals compare utilization against peers and draw important insights across a range of medical and surgical procedures. This retrospective approach helps MVC members to learn from their past performance in order to pursue meaningful, observable improvements within their buildings. It is one piece of the big data puzzle. Predictive analytics, on the other hand, allows clinicians to utilize big data before their patient experiences significant healthcare services or treatments. As its name denotes, this approach identifies prevention opportunities before the incidence of disease by predicting a patient’s risk. This is especially important for diseases that require early detection for optimal treatment and survival.

Unlike Robotic Process Automation (RPA), which is also on the rise in health systems across the country, predictive analytics is performed by Artificial Intelligence (AI). This means that computer systems will perform tasks typically requiring human intelligence, including analyses and decision-making. In some ways, this strategy mimics what physicians have long been doing at a patient’s bedside: collecting a patient’s medical history and risk factors in order to tailor their treatment and advice. This process is essential in evaluating a patient’s risk of developing chronic diseases, which often run in their family or are more likely due to socioeconomic factors. An article from the University of Illinois Chicago posits that predictive analytics represent a significant potential for cost savings if they help clinicians and their patients prevent the onset of chronic diseases, one of healthcare’s costliest areas.

“On a population-wide level, predictive analytics can help greatly cut costs by predicting which patients are at higher risk for disease and arrange early intervention, before problems develop,” the article stated. “This involves aggregating data that are related to a variety of factors. These include medical history, demographic or socioeconomic profile, and comorbidities.”

The Centers for Disease Control and Prevention (CDC) states that, “90% of the nation’s $3.8 trillion in annual health care expenditures are for people with chronic and mental health conditions.” So the potential cost savings from reducing chronic disease treatment are significant.

Using predictive analytics in a clinical setting can leverage both patient records and socioeconomic factors. Medical records will often include family history of chronic diseases such as cancer, diabetes, and heart disease, which would make a patient more likely to develop the condition themselves. In addition to family history, a patient’s socioeconomic factors (e.g., education, employment, and environment) and lifestyle choices are significant predictors of chronic disease. A study in the American Journal of Preventive Medicine outlines how researchers used predictive analytics to screen for cardiovascular disease risk from social determinants of health, and ultimately guide clinician treatment options. The researchers also suggest that large databases about social determinants of health variables, especially environmental ones, are not as readily available as they should be, and are an important area of opportunity for future data collection efforts.

A similar application of this technology was used in a study published by Cancer Immunology Research to predict lung cancer immunotherapy success. In the study, researchers used an AI algorithm to identify changes in patterns from CT scans that were previously not detected by clinicians, which ultimately predicted how well a patient would respond to immunotherapy. This suggests that predictive analytics can help improve the accuracy of diagnoses and treatment.

Of course, the applications for predictive analytics extend beyond chronic disease prevention and treatment. In the past year, researchers have also used predictive analytics to forecast outcomes for patients positive for COVID-19. In The American Journal of Emergency Department Medicine, a published study validated a tool that helps physicians predict adverse events among patients presenting with suspected COVID-19. The study suggests that the algorithm and scores can help physicians decide when to hospitalize or discharge patients during the pandemic. Therefore, predictive analytics appear to also provide insights that enhance treatment.

Many additional articles (such as one article from Health IT Analytics) and published studies recommend predictive analytics for its potential benefits. As with any technology, however, it is not without its risks. The use of AI brings about concerns for privacy, especially since hospitals must properly steward patient data and comply with HIPAA regulations. But there are several other considerations identified in a recent Deloitte analysis (see Figure 1), not the least of which is ensuring the algorithm doesn’t introduce bias that disproportionately harms minorities and communities of color. Predictive analytics may also present evaluation challenges. Once algorithms are validated, their widespread use in clinical settings should be confirmed for their efficacy, which requires measuring the absence of disease.

Figure 1.

The potential benefits of predictive analytics are variable and significant; however, as healthcare learns to integrate AI technologies, it will be important to keep its risks in mind and address them accordingly. The MVC Coordinating Center endeavors to assist its members through their data analytics journey by providing insights into specific data sets. When pursuing additional technologies or analytic tools, the Coordinating Center encourages members to volunteer as a sounding board and resource for other members. If your hospital or physician organization is currently utilizing AI or considering it with your patient data, we encourage you to reach out so MVC can share your experience with others. You can reach the MVC Coordinating Center at michiganvaluecollaborative@gmail.com.
0

Condition Selection Process Announced for MVC Component of BCBSM P4P Program

This week the Michigan Value Collaborative (MVC) Coordinating Center announced the condition selection process for program year (PY) 2022 and PY 2023 of the MVC Component of the Blue Cross Blue Shield of Michigan (BCBSM) Pay-for-Performance (P4P) program. The timeline for each program year’s stages are detailed in Figure 1.

Figure 1.

In the announcement, hospitals were tasked with selecting two conditions for which they will be evaluated and returning their condition selection form to the Coordinating Center by Friday, August 13, 2021. The announcement also outlined changes to the scoring methodology, cohort assignments, and bonus points available.

The Coordinating Center’s recent announcement included condition selection reports with targets for each condition option that may help inform hospitals’ selection decisions. Each participating hospital will choose two of the seven available conditions for PY22 and PY23: spine surgery, joint replacement, chronic obstructive pulmonary disease (COPD), coronary artery bypass grafting (CABG), congestive heart failure (CHF), colectomy (non-cancer), and pneumonia. When selecting conditions, the Coordinating Center recommends reviewing your data in the registry and considering several factors for each condition, including case counts and identifiable areas with the greatest cost opportunities. The Coordinating Center also recommends considering where resources are currently being directed in your facility and potentially aligning with those efforts.

One notable change from prior program years is the methodology by which hospitals earn achievement and improvement points. Hospital scores will continue to be based on a hospital’s risk-adjusted, price-standardized total episode payments for two selected conditions, and they can still earn a maximum score of 10 points. However, the improvement and achievement scores will become more similar in order to be placed on the same scale. As such, the achievement equation will change from being based on rank within MVC cohort at performance year to being based on distance from MVC cohort mean at baseline year. Similarly, the improvement equation will utilize the distance from the hospital’s mean at baseline. These new equations (see Figure 2) as well as complete descriptions of the updated methodologies are reviewed at length with examples in the technical document.

Figure 2.

P4P cohorts have also been reassigned for PY22 and PY23. These changes are also detailed in the technical document, and the new cohort assignments can be found on the MVC website. The cohorts are not intended to group hospitals that are exactly alike; rather, they create a reasonably-comparable grouping from which MVC can complete statistical analysis.

The final change is to the awarding of bonus points. In place of the previous 5% cohort reduction bonus, participants can instead earn bonus points by completing two questionnaires (one per selected condition) and submitting these to the Coordinating Center by November 1st of each program year. The purpose of this is to gather examples of quality improvement initiatives in operation at MVC member hospitals to share with the Collaborative. Moving forward, this will help support members in reducing costs through collaboration.

Each of the changes mentioned above are designed to deliver a more transparent, intuitive, flexible, and fairer P4P program. The Coordinating Center will offer an explainer webinar to answer questions and walk through the details of these changes in more detail. The webinar will be offered on two dates: the first is scheduled for Thursday, July 29 from 11:00-12:00 pm, and the second is on Tuesday, August 3 from 1:00-2:00 pm. Both webinars can be accessed using the following Zoom link: https://umich.zoom.us/j/95502303999. Participants can also call +1 301 715 8592 (meeting ID #955 0230 3999). For those interested in the explainer webinar who are unavailable on both dates, a recording of the first webinar will be available. If you are interested in receiving a link to this recording, please email the MVC team at michiganvaluecollaborative@gmail.com.
0
View Post
Introducing MVC’s Newest Analyst, Kristen Palframan, MPH

Introducing MVC’s Newest Analyst, Kristen Palframan, MPH

I am excited to have joined the Michigan Value Collaborative (MVC) this month as a data analyst. I’m really looking forward to working with the MVC team and using my experience in data management and analysis to support the goal of improving the quality and value of healthcare in Michigan.

My background is primarily in research and data analysis. I have a Bachelor of Science degree in Animal Behavior from Bucknell University. After conducting behavioral research and wildlife disease fieldwork with animals throughout and following college, I developed an interest in disease prevention and came to Michigan to pursue a Master of Public Health (MPH) degree from the University of Michigan School of Public Health. During my MPH program I took a variety of epidemiology and statistics courses, and I particularly enjoyed those that involved programming in SAS and SQL. After graduating from the University of Michigan with an MPH degree in Epidemiology in 2018, I worked for three years as an epidemiologist for the U.S. Department of Veterans Affairs (VA) in the Office of Mental Health and Suicide Prevention. At the VA, I worked on analyses, reports, dashboards, and manuscripts focused on supporting suicide prevention among U.S. Veterans. My work for the VA primarily used electronic medical record data from the Veterans Health Administration as well as mortality data from the Centers for Disease Control and Prevention’s National Death Index.

Now I am thrilled to use my experience in healthcare data analysis to support MVC’s mission and I’m looking forward to growing as an analyst and gaining experience working with claims data. If you have any questions or would like to contact me, please feel free to email me at kpalf@med.umich.edu.