The Michigan Value Collaborative (MVC) recently completed the development of two new push reports tailored to physician organizations (POs). Both reports mirrored hospital-level push reports distributed earlier this summer and reflect MVC’s ongoing approach to refining and tailoring its analytic offerings to the patient populations and needs of its diverse membership. The first new PO report of 2023 was released in July and focused on post-discharge care, and the second is set to be released next week using new emergency department (ED)-based episodes.
PO ED-Based Episodes Report
The forthcoming PO ED-based episode report features MVC’s new ED-based episode data for five high-volume ED conditions: chest pain, abdominal pain, chronic obstructive pulmonary disease (COPD), congestive heart failure (CHF), and cellulitis. A hospital-level version was distributed in June.
ED-based episodes are a new episode of care structure developed by MVC in collaboration with the Michigan Emergency Department Improvement Collaborative (MEDIC). These episodes are initialized by a patient’s visit to the ED and include all claims-documented care received in the 30 days following a patient’s index ED visit.
For each of the five index conditions included in this forthcoming report, POs will receive information on risk-adjusted and price-standardized 30-day total episode payments, same-day inpatient admission rates over time, utilization of healthcare services across an attributed patient’s 30-day episode of care, and the hospitals where a PO’s attributed patients most frequently presented to the ED for a given index condition. Patient claims data were included for adult patients aged 18 and older who had an ED visit between 1/1/21 and 8/31/22 and were insured by Blue Cross Blue Shield of Michigan (BCBSM) PPO Commercial, BCBSM Medicare Advantage (MA), or Medicare Fee-for-Service (FFS).
Among POs receiving a report, average risk-adjusted, price-standardized 30-day total episode payments for the five reported conditions were highest for CHF ED-based episodes ($16,936) followed by COPD ED-based episodes ($10,286), and lowest for unspecified chest pain ($3,714). Within each condition, MVC 30-day total episode payments were consistently higher for episodes in which the attributed patient had a same-day inpatient admission compared to episodes in which the attributed patient did not have an inpatient stay begin on the date of their ED visit.
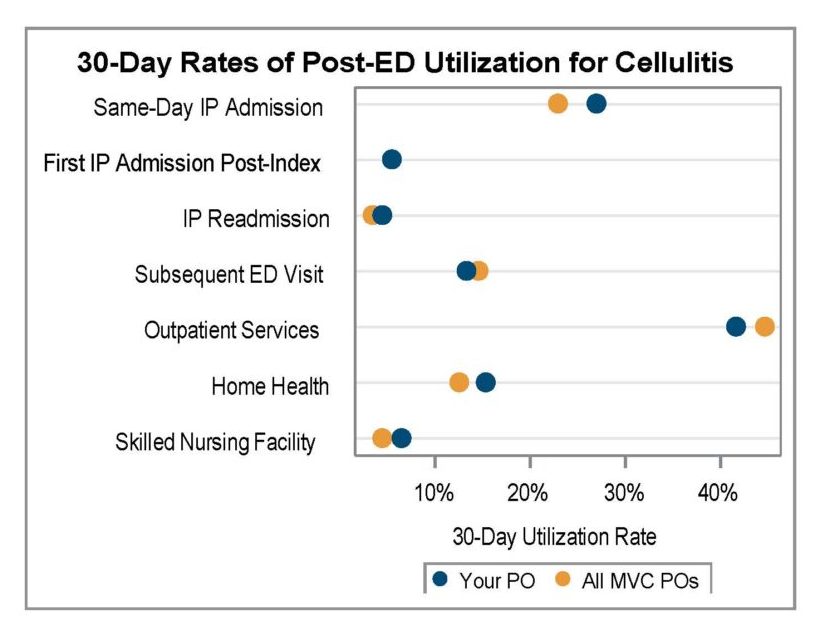
A key goal for these ED-based episode reports was to provide insight into healthcare utilization following index ED visits. Therefore, reports included a dot plot (Figure 1) comparing each PO’s post-ED utilization for their attributed patients compared to the average across all 40 MVC member POs.
Figure 1.
PO Skilled Nursing Facility & Home Health Report
In July, MVC distributed PO-level reports on post-discharge care that included metrics on skilled nursing facility and home health utilization. A hospital-level version was distributed in June. The purpose of this report was to support understanding of care coordination opportunities and benchmark post-discharge care utilization.
This report highlighted various SNF and home health utilization metrics using 30-day claims-based episodes for MVC’s medical conditions: acute myocardial infarction (AMI), atrial fibrillation, COPD, CHF, endocarditis, pneumonia, sepsis, small bowel obstruction, and stroke. A PO’s attributed patient episodes were included if they had an inpatient admission between 1/1/2021 and 6/30/2022 and were insured by BCBSM PPO Commercial, BCBSM MA, or Medicare FFS.
As with other PO-level push reports, MVC included several comparison groups to aid individual POs in benchmarking their performance for select report metrics. Each PO can compare their data to the average for POs of a similar size, the average for POs located within the same geographic region of Michigan according to MVC’s region designations, and the collaborative-wide average for all MVC member POs. Only POs with 20 or more episodes in 2021 and 11 or more in 2022 received a report and were included in comparison group calculations.
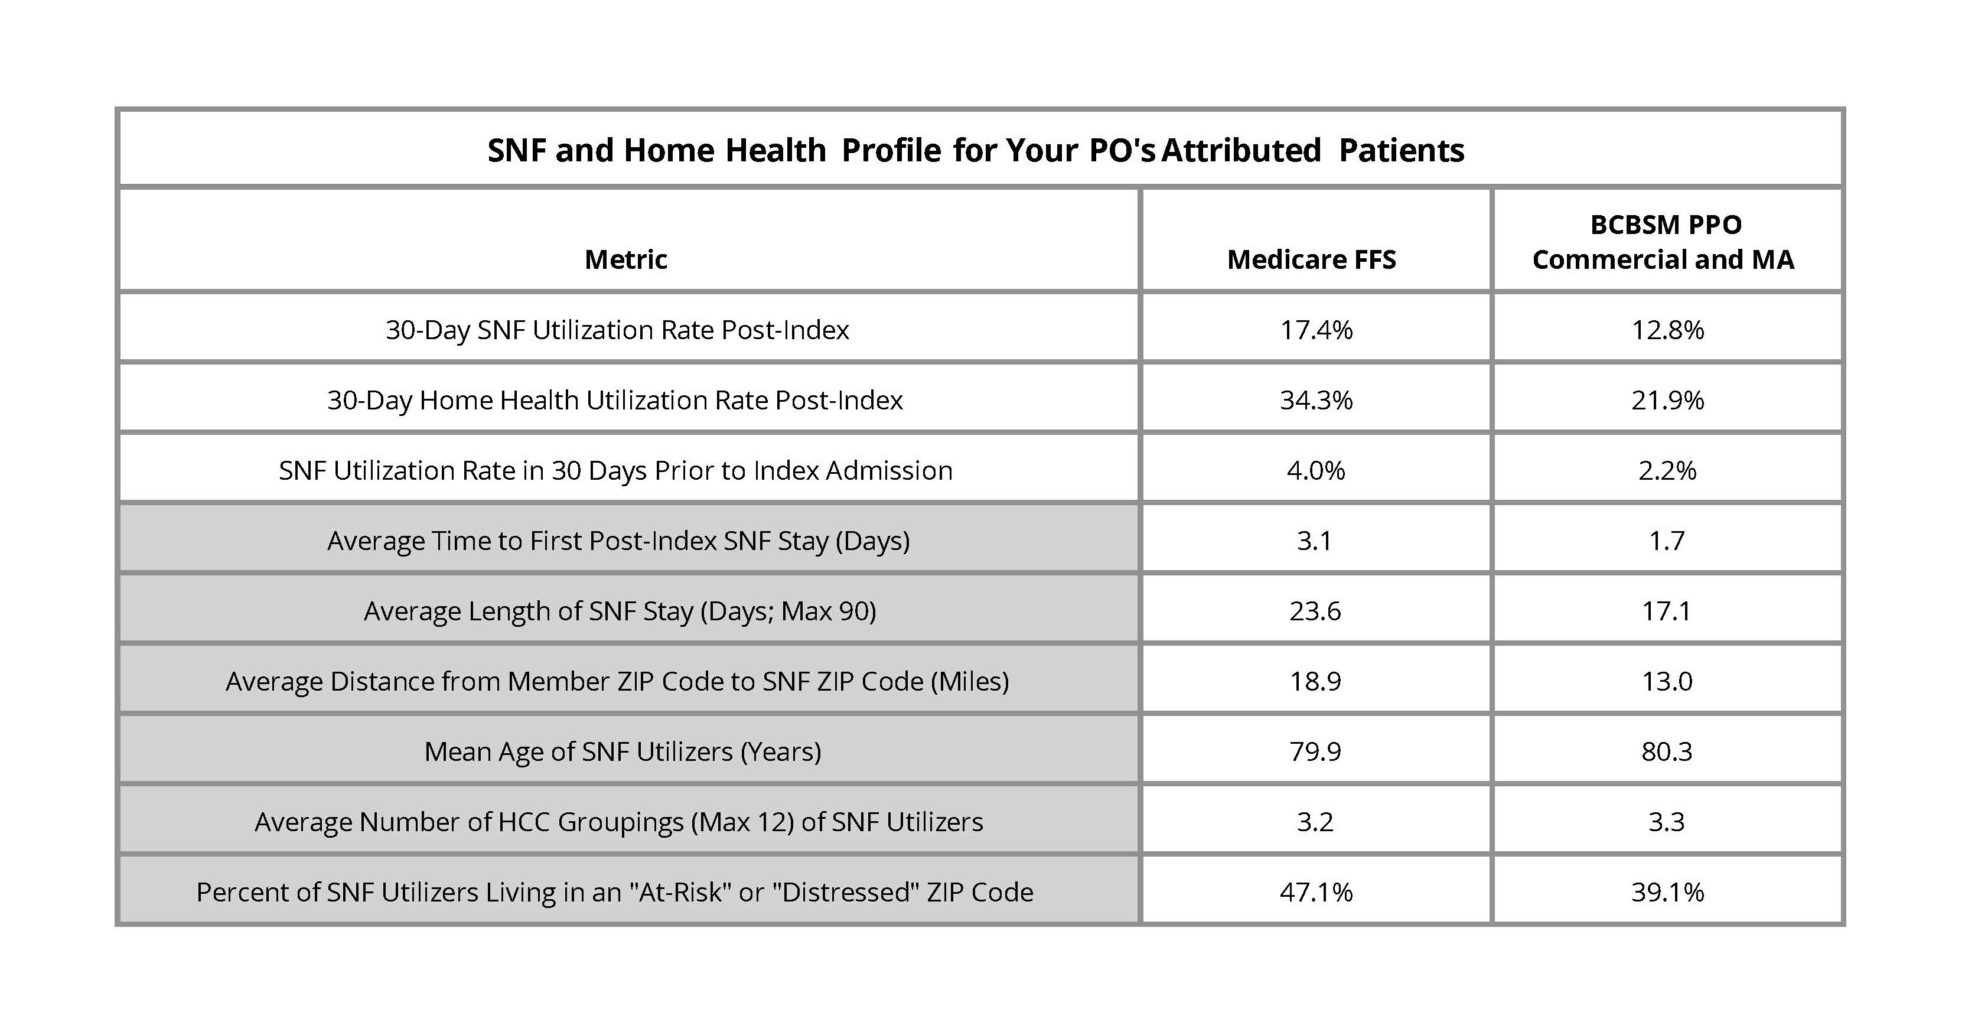
Similar to the hospital-level version, the first page of the report contained a SNF and home health profile table (Figure 2), which provided an overall look at post-discharge utilization patterns by payer as well as information about a given PO's patient population. The first three metrics reflected all attributed patients treated for medical conditions in this time period for the included payers and the metrics in gray were comprised only of attributed patients who utilized SNF in the 30 days post-discharge from their episode's index hospitalization. Overall, MVC found that Medicare FFS patients utilized SNF and home health services more often.
Figure 2.
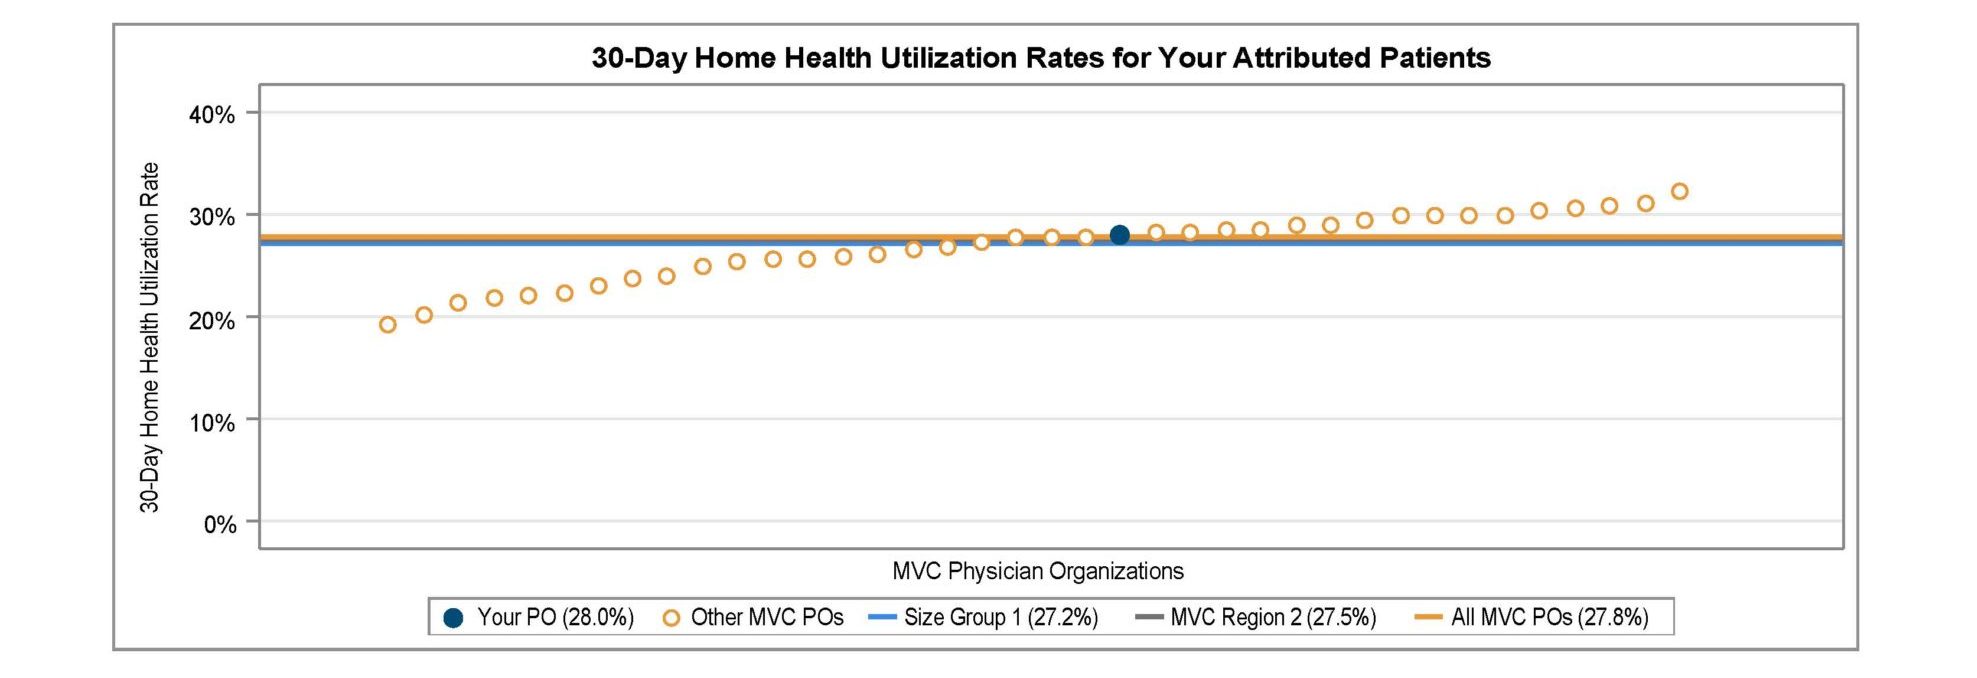
Measures in this report include SNF and home health utilization rates overall and by condition, SNF and home health utilization rates among patients discharged to their home, inpatient readmission rates for SNF and home health utilizers, and a list of the most frequently utilized SNFs and home health providers to help POs understand where their attributed patients are going when receiving SNF or home health care after discharge. MVC presented 30-day overall SNF and home health utilization rates in a caterpillar plot format to showcase variation across POs. These rates varied between roughly 9% and 16% for SNF utilization (Figure 3) and between 19% and 32% for home health utilization (Figure 4).
Figure 3.
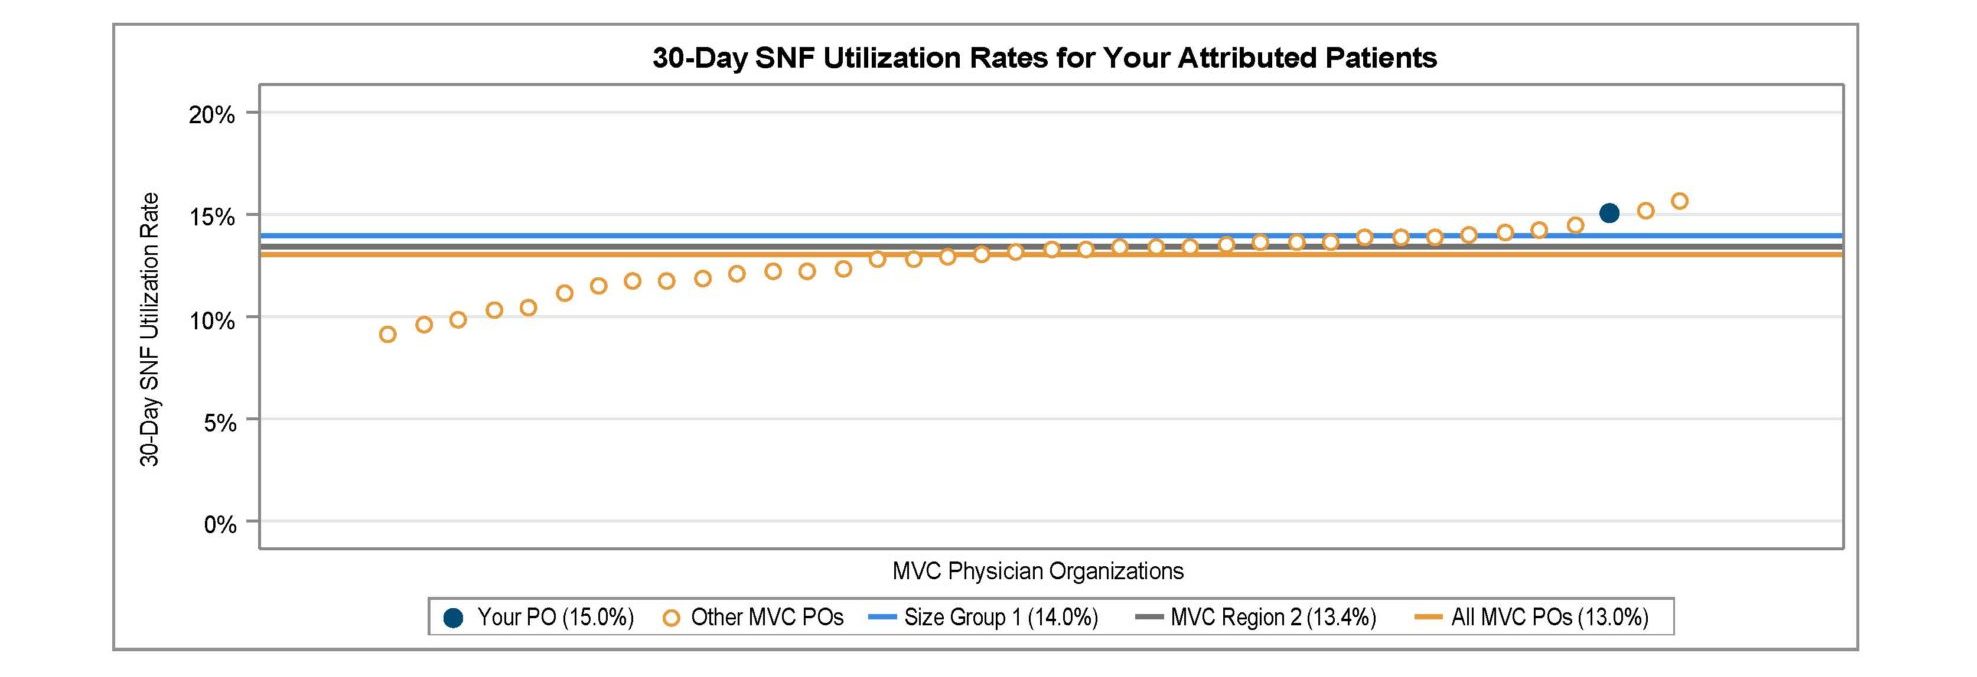
Figure 4.
MVC observed average 30-day inpatient readmission rates of 21% among attributed PO patients discharged to SNF (Figure 5) and 17.2% among attributed patients discharged to home health (Figure 6).
Figure 5.

Figure 6.

New Report Distribution Process
MVC piloted a new method for distributing its push reports when sending out the PO SNF/HH reports and is continuing that method for the distribution of its PO ED-based episode reports. Over the summer, PO site coordinators received an email from Dropbox as well as from MVC with a link to their PO’s designated Dropbox folder. Since then, MVC has been working to confirm that contacts are able to successfully access their designated folder and reports.
This new report distribution process will allow MVC’S contacts to access all available MVC reports in a single, secure location, and address some of the email firewall issues experienced by some members. Going forward, members may access and download their individualized reports using Dropbox rather than receiving reports through email. When a new report is made available to members, MVC will still notify all recipients via email with the details of the report. MVC plans to launch this new report distribution process with its hospital partners in the coming months, beginning with Program Year 2023 mid-year scorecards for the MVC Component of the BCBSM Pay-for-Performance (P4P) Program.
If you have any follow-up questions about your site’s latest push reports or the new report distribution process, please contact the MVC Coordinating Center at Michigan-Value-Collaborative@med.umich.edu.

