This week MVC updated its registry with new claims from its included payers. This most recent update included the addition of three new months of Blue Cross Blue Shield of Michigan (BCBSM) and Blue Care Network (BCN) claims, one new quarter of Medicaid claims, and one new quarter of Medicare Fee-for-Service (FFS) claims. Following these updates, the MVC registry now has the following data ranges for its data:
- BCBSM PPO (Commercial and Medicare Advantage): 01/01/2015 – 03/31/2025 (index events through 12/31/2024)
- BCN (Commercial and Medicare Advantage): 01/01/2015 – 03/31/2025 (index events through 12/31/2024)
- Medicaid: 01/01/2015 – 03/31/2025 (index events through 12/31/2024)
- Medicare FFS: 01/01/2015 – 09/30/2024 (index events through 06/30/2024)
Anytime MVC publishes new data on its registry, the newest claims for each payer are incorporated throughout the various reports and dashboards where that payer’s data is present, including the interactive multi-payer reports for cardiac rehabilitation utilization and preoperative testing.
Refreshed Multi-Payer Cardiac Rehabilitation Reports
The multi-payer cardiac rehabilitation utilization reports were added to the registry in the first half of 2024 and have replaced the static PDF hospital-level push reports MVC previously distributed biannually to its members as well as BMC2 and MSTCVS contacts. The regular release of new data on the registry, therefore, gives members opportunities throughout the year to check progress on cardiac rehabilitation metrics more regularly and find opportunities for improvement. For example, available 2024 data on cardiac rehabilitation enrollment for all eligible patients (excluding heart failure patients) with episode start dates between Jan. 1, 2024, and Dec. 31, 2024, indicates wide variability among hospitals; the statewide average utilization rate is 34%, with the majority of sites observing rates below the Million Hearts recommended 70% rate as well as below the Michigan Cardiac Rehab Network goal rate of 40% (Figure 1).
Figure 1. Statewide Rankings for Cardiac Rehab Utilization within 90 Days After Discharge from AMI, CABG, PCI, SAVR, and TAVR, 1/1/2024-12/31/2024*
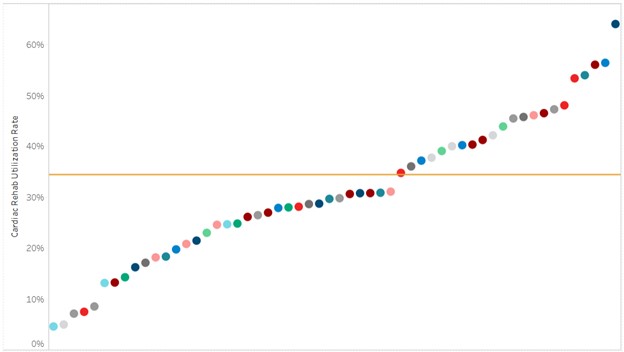
*Index events 1/1/24-12/31/24 for BCBSM Commercial and Medicare Advantage (MA), BCN Commercial and MA, and Medicaid; index events 1/1/24-6/30/24 for Medicare FFS
Similarly, there is significant variation between hospitals in their mean days to a patient’s first cardiac rehab appointment, with some hospital patients attending their first session 31 days after discharge and some waiting as long as 68 days. However, MVC has observed a steady yearly decrease over time in this metric, with a collaborative-wide average of 59 days in 2020 compared to 47 days in 2024.
These data along with metrics for mean number of visits and utilization rates for specific service lines and payers can be accessed via the multi-payer tab on the registry under the cardiac rehab heading.
Refreshed Multi-Payer Preoperative Testing Reports
The multi-payer preoperative testing utilization reports were added to the registry at the end of 2024 and have also replaced static hospital-level push reports that were previously distributed as biannual PDF reports to members as well as MSQC contacts. Looking at all available 2024 claims across payers, there is evidence of a small decrease in the MVC All rate of preoperative testing prior to low-risk surgery beginning in late 2022 through 2024 (Figure 2). The average testing rate in 2020 was 46.8% and the average rate in 2024 was 39.9%. Members whose rates are 40% overall or higher are eligible to participate in the RIght-sizing Testing before Elective Surgery (RITE-Size) program, which offers participating sites consultation and coaching, templates, best practice guidance, and other resources to help coordinate decreases in unnecessary testing across their institutions. MVC is also able to supplement registry data with custom analytics by an MVC analyst to meet the needs of members. One such site recently utilized MVC’s custom analytics to identify differences in preoperative testing rates by physician NPI to support conversations about intra-hospital variation by provider and service line.
Figure 2. Statewide Rate of Preoperative Testing and Relative Difference in Preoperative Testing by Quarter, 01/01/2020-12/31/2024*
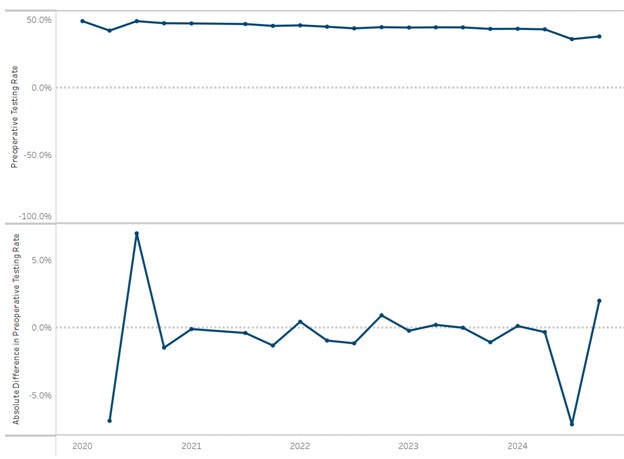
*Index events 1/1/24-12/31/24 for BCBSM Commercial and Medicare Advantage, BCN Commercial and MA, and Medicaid; index events 1/1/24-6/30/24 for Medicare FFS
MVC’s registry contains an extensive collection of report views for multi-payer, P4P, and payer-specific metrics with select patient-level drilldown capabilities. If you are newer to the registry or would like a refresher on how best to leverage the information, reach out to the MVC Coordinating Center for information about a tailored registry training.
