0
View Post
Hospitals Receive New Push Reports on MVC’s P4P Episode Spending and Value Metrics

Hospitals Receive New Push Reports on MVC’s P4P Episode Spending and Value Metrics

The Michigan Value Collaborative (MVC) Coordinating Center distributed a new report earlier this month focused on Program Years (PYs) 2024 and 2025 for the MVC Component of the Blue Cross Blue Shield of Michigan (BCBSM) Pay-for-Performance (P4P) Program. PYs 2024 and 2025 retained the episode spending component of the program but incorporated MVC’s value metrics – specific process measures of utilization that are evidence-based, actionable, and show variability across the state. This report, therefore, highlighted data for each hospital’s specific PY 24-25 episode spending and value metric selections. We hope that these reports will be utilized to inform quality improvement efforts by identifying areas of opportunity for episode spending conditions or value-based practices.

Hospitals selected chronic obstructive pulmonary disease (COPD), colectomy (non-cancer), congestive heart failure (CHF), coronary artery bypass grafting (CABG), joint replacement, or pneumonia for their episode spending scoring. Seven value metrics were available to choose from, including cardiac rehabilitation after CABG, cardiac rehabilitation after percutaneous coronary intervention (PCI), seven-day follow-up after CHF, 14-day follow-up after COPD, seven-day follow-up after pneumonia, preoperative testing, and risk-adjusted readmission after sepsis. With the exception of the trend figure on the report’s value metric page (which has a data range of 1/1/2020 – 12/31/2022), the data in this report reflected baseline year data (2021) for PY 2024. Any impact to utilization or patient outcomes achieved by hospitals this year will contribute to their performance year data for PY 2025.

The first data page focused on a hospital’s episode spending selection, and provided a caterpillar plot (Figure 1) for price-standardized and risk-adjusted total episode payments for that hospital compared to other MVC hospitals as well as the MVC collaborative-wide average and that hospital’s P4P cohort average. P4P cohorts were determined based on hospital bed size, case mix index, and critical access status.

Figure 1.

The report also included episode spending figures focused on price-standardized, risk-adjusted payments for major episode components (index, professional, readmission, and post-discharge) as well as post-discharge payment components (emergency department, home health, skilled nursing facility, inpatient and outpatient rehab, and outpatient services). These two figures (Figure 2 and 3) could be used to identify the components contributing most significantly towards a hospital’s total episode payment.

Figure 2.

Figure 3.

The second data page provided information about a hospital’s value metric selection. The first figure was a caterpillar plot (Figure 4) displaying that hospital’s value metric rate compared to other MVC hospitals as well as the MVC collaborative-wide average and that hospital’s P4P cohort average.

Figure 4.

The value metric page also included a trend graph detailing a hospital’s value metric rate by six-month interval, and a final figure that varied by hospital to provide additional metric-specific insights. Hospitals being scored on cardiac rehab after CABG or PCI received a caterpillar plot of average days to the first cardiac rehab visit among cardiac rehab utilizers. Hospitals being scored on follow-up after CHF, COPD, or pneumonia received a bar chart of follow-up rates by setting (in-person only, remote only, or both in-person and remote). Hospitals being scored on preoperative testing will see a bar chart of preoperative testing rates by test type. Lastly, hospitals being scored on 30-day readmissions after sepsis received a table of the most common reasons for readmission after the initial sepsis episode’s discharge.

For more information about your hospital’s episode spending and value metric selections and data, as well as other conditions and value metrics not selected, hospitals can utilize the PY 2024-2025 reports on the MVC Registry. PYs 2024 and 2025 also introduced a new engagement component, awarding 2 out of the 10 program year points for completed engagement activities. Please see the following event list and calendar for 2024 engagement opportunities, which will contribute to a hospital’s PY 2024 score.

If you have any questions regarding the MVC Component of the BCBSM P4P Program, please reference the P4P Technical Document for Program Years 2024 and 2025. If you would like to set up a meeting to review your hospital’s performance, please contact the Coordinating Center at Michigan-Value-Collaborative@med.umich.edu.
0
View Post
MVC Component of the BCBSM P4P Program: PY23 in Review

MVC Component of the BCBSM P4P Program: PY23 in Review

This month the Michigan Value Collaborative (MVC) Coordinating Center distributed the final scorecards for Program Year (PY) 2023 of the MVC Component of the Blue Cross Blue Shield of Michigan (BCBSM) Pay-for-Performance (P4P) Program. The 2023 program year was the second year of a two-year cycle for which hospitals were evaluated using MVC data. Hospitals were scored on two conditions that they selected from seven options: chronic obstructive pulmonary disease (COPD), colectomy, congestive heart failure (CHF), coronary artery bypass graft (CABG), joint replacement, pneumonia, and spine surgery. Figure one shows the frequency of hospital condition selections for the two-year program cycle. Joint replacement was the most commonly selected condition, and colectomy was selected the least.

Figure 1. Distribution of Hospital Condition Selections for PY 2023

The MVC Component of the BCBSM P4P Program evaluates each participating hospital’s risk-adjusted, price-standardized, average 30-day episode payments for their two selected conditions through two methods. Hospitals can earn points by reducing their payments from the baseline period (which included index admissions in 2020) to the performance period (which included index admissions in 2022). These are termed “improvement points.” Alternatively, hospitals can earn points by being less expensive than the other hospitals in their cohort. These are referred to as “achievement points.” The MVC cohorts are groups of hospitals determined to be peers using bed size and case mix index.

While participants are scored on both improvement and achievement, members receive the higher of the two scores for each condition. Hospitals were also eligible to receive a bonus point for each condition by completing a questionnaire designed to inform MVC of member hospital quality improvement practices. While 12 points were available, a maximum of 10 points were awarded to participating members. Figure 2 shows the distribution of total points earned by hospitals for the 2023 program year.

Figure 2. Distribution of Total P4P Scores for PY 2023

On average hospitals earned 7.4 points total, a decrease of 0.3 points from PY 2022’s average of 7.7 points. The majority (90.7%) of hospitals earned at least one of the two possible bonus points. As shown in Figure 3, the condition with the highest average point total was joint replacement (4.5 points) followed by spine surgery (4.3 points).

Figure 3. Average Points by Condition

If you have any questions regarding the MVC Component of the BCBSM P4P Program, please reference the P4P Technical Document for Program Years 2022 and 2023 and the MVC P4P FAQ PY 2022-2023. If you would like to set up a meeting to review your hospital’s performance, please contact the Coordinating Center at Michigan-Value-Collaborative@med.umich.edu.  The Coordinating Center will evaluate and release mid-year scorecards for PY 2024 in the summer of 2024.

0
View Post
Hospitals Receive PY23 Mid-Year Scorecards for MVC Component of BCBSM P4P Program

Hospitals Receive PY23 Mid-Year Scorecards for MVC Component of BCBSM P4P Program

This week the Michigan Value Collaborative (MVC) distributed mid-year scorecards for Program Year (PY) 2023 of the MVC Component of the Blue Cross Blue Shield of Michigan (BCBSM) Pay-for-Performance (P4P) Program. PY2023 scores achievement and improvement points for each hospital’s selected episode spending conditions using index admissions from 2022 as the performance year against admissions in 2020 as the baseline year. Hospitals can earn up to five points for each condition using the higher of a hospital's achievement and improvement point scores. This is the second year of a two-year (PY22-23) P4P cycle.

This cycle also offers hospitals bonus points for completing and submitting a survey for each selected condition by November 15, 2022. These surveys will be used by the MVC Coordinating Center to improve the program for future years and support practice sharing between members. The full methodology for this program cycle can be found in the PY2022-2023 Technical Document.

Figure 1 below illustrates the current distribution of total hospital points out of 10. The average points scored across the mid-year scorecards was 6.4/10 before including the survey bonus points. This is 0.4 points higher than the average points scored at the conclusion of PY22 excluding all bonus points.

Figure 1.

Figure 2 below illustrates the breakdown of average points by condition. Hospitals could earn up to five points for each condition. Consistent with previous years, joint replacement was the highest scoring condition with an average of 4.6 points. Much of the success observed for the joint replacement condition can be attributed to the shift from post-acute care in skilled nursing facilities (SNF) to home health and the move towards outpatient surgeries. Pneumonia was the lowest scoring condition with hospitals earning less than two points on average.

Figure 2.

These mid-year P4P scores are subject to change as new data is added. The final scorecards will be distributed after all 2022 claims are incorporated. Hospitals can track their score through the P4P PY22-23 reports on the MVC registry, which provides all relevant scoring information for both improvement and achievement points in one place (bonus points are not reflected on the registry). These registry reports can be filtered by selected conditions to make the tracking of P4P points easier. Contact the MVC Coordinating Center for a walkthrough of your hospital’s PY23 mid-year scorecard or P4P registry reports.

0
View Post
MVC’s SNF and HH Push Report Latest in Post-Discharge Insights

MVC’s SNF and HH Push Report Latest in Post-Discharge Insights

MVC released another new push report recently with the first iteration of a skilled nursing facility (SNF) and home health focused report. MVC members frequently identify post-discharge care and SNF utilization as focus areas for quality improvement; therefore, this report was developed to help hospitals benchmark their performance in this area and identify opportunities to improve care coordination. Critical access hospitals (CAHs) received a tailored version of the report to allow for metric comparisons to only other CAHs.

This report highlighted various SNF and home health utilization metrics using 30-day claims-based episodes for MVC’s medical conditions: acute myocardial infarction (AMI), atrial fibrillation, chronic obstructive pulmonary disease (COPD), congestive heart failure (CHF), endocarditis, pneumonia, sepsis, small bowel obstruction, and stroke. Patient episodes were included if they had an inpatient admission between 1/1/2021 and 6/30/2022 and had one of the following insurance plans: Blue Care Network (BCN) HMO Commercial or Medicare Advantage (MA), Blue Cross Blue Shield of Michigan (BCBSM) PPO Commercial or MA, or Medicare Fee-for-Service (FFS).

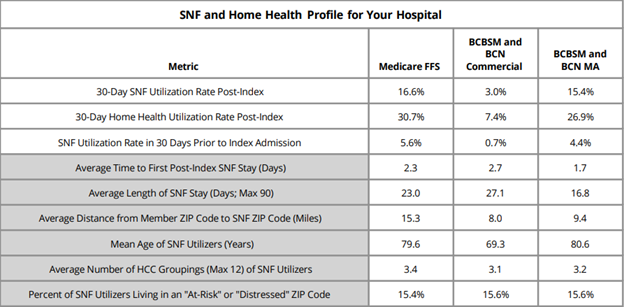
The first page of the report contained a SNF and home health profile table (Figure 1), which included nine metrics designed to give an overall look at post-discharge utilization patterns as well as information about a given hospital’s patient population. The first three metrics reflected all patients treated for medical conditions in this time period for the included payers and the metrics in gray were comprised only of patients that utilized SNF in the 30 days post-discharge from their episode's index hospitalization. Overall, MVC found that Medicare FFS patients utilized SNF and home health services more often than other payers. For CAHs, this table was not separated by payer.

Figure 1.

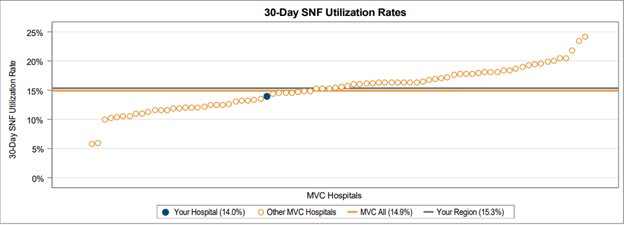
On the subsequent pages, 30-day overall SNF and home health utilization rates were provided in a caterpillar plot format to showcase variation across the collaborative (Figure 2). These rates varied between 5% and 25% for SNF utilization and between 10% and 40% for home health utilization.

Figure 2.

MVC also provided 30-day SNF and home health utilization rates broken out by condition to allow each hospital to benchmark rates across their site’s medical service lines and compared to the MVC average rate for each condition (Figure 3). Medical conditions were only included in this figure if a hospital had at least 11 cases between 1/1/2021 and 6/30/2022. On average across the collaborative, the highest 30-day post-discharge SNF utilization rates were observed in endocarditis (28%), sepsis (19.5%), and stroke (19.5%) patients.

Figure 3.

Hospitals also received a table identifying the most frequently utilized SNFs from a medical condition episode to help sites understand where their patients are going when receiving SNF care after discharge. A similar table was shown for home health providers.

The final page of the report included four caterpillar plots tailored to specific denominators. This included 30-day SNF and home health utilization rates for the cohort of patients discharged home. It also included readmission rates for patients who were discharged to SNF and readmission rates for patients discharged to home health. These plots were included to inform each hospital about patterns in their transitions of care and readmissions. There was significant variability in readmission rates following discharge to either a SNF or home health facility, with some hospitals averaging close to 5% readmission rates and some hospitals seeing an average of nearly 40% of patients readmitted during the 30-day post-discharge window (Figure 4).

Figure 4.

As part of its new Lunch & Learn series, MVC recently hosted a session focused on MVC data that included a walkthrough of its SNF/HH report and a deeper dive into those report metrics using MVC’s registry. Those who were unable to attend can watch a recording of the presentation here, which demonstrates how to replicate aspects of the push report on MVC’s registry in order to view additional episode spending and patient-level data.

If you have any questions or feedback about this report, please reach out to the MVC Coordinating Center.

0
View Post
MVC Component of the BCBSM P4P Program: PY22 in Review

MVC Component of the BCBSM P4P Program: PY22 in Review

Last month the Michigan Value Collaborative (MVC) distributed final scorecards for Program Year (PY) 2022 of the MVC Component of the Blue Cross Blue Shield of Michigan (BCBSM) Pay-for-Performance (P4P) Program. PY 2022 was the first year of a two-year cycle for which MVC data was used to evaluate hospitals on two of seven selected episode spending conditions. These P4P condition options included chronic obstructive pulmonary disease (COPD), colectomy, congestive heart failure (CHF), coronary artery bypass graft (CABG), joint replacement, pneumonia, and spine surgery. Figure one shows the frequency of hospital condition selections for this two-year program cycle. Joint replacement was the most commonly selected condition, while colectomy was selected by the fewest hospitals.

Figure 1. Distribution of Hospital Condition Selections for PY 2022

The MVC Component of the BCBSM P4P Program evaluates each participating hospital’s average 30-day, risk-adjusted, price-standardized episode payments for their two selected conditions through two methods. One way that hospitals earn points is by reducing their payments from the baseline period (which included index admissions in 2019) to the performance period (which included index admissions in 2021). These are termed “improvement points.” Alternatively, hospitals can earn points by being less expensive than the other hospitals in their cohort. These are referred to as “achievement points.” The MVC cohorts are groups of hospitals determined to be peers using bed size and case mix index.

While participants are scored on both improvement and achievement, members receive the higher of the two scores for each condition. Hospitals were also eligible to receive a bonus point for each condition by completing a questionnaire designed to inform MVC of member hospital quality improvement practices. While 12 points were available, a maximum of 10 points were awarded to participating members. Figure 2 shows the distribution of total points earned by hospitals for PY 2022.

Figure 2. Distribution of Total P4P Scores for PY 2022

On average, hospitals earned 7.7 points total, a nearly one-point increase from the average of 6.8 points in PY 2021. A majority (98.7%) of hospitals earned at least one of the two possible participation bonus points. The condition with the highest average point total was joint replacement at 4.6 points with spine coming in second at 3.4 points (Figure 3).

Figure 3. Average Points by Condition

If you have any questions regarding the MVC Component of the BCBSM P4P Program, please reference the P4P Technical Document for Program Years 2022 and 2023 and the MVC P4P FAQ PY 2022-2023. If you would like to set up a meeting to review your hospital’s scorecard, please contact the MVC Coordinating Center at Michigan-Value-Collaborative@med.umich.edu.  MVC plans to evaluate and release mid-year scorecards for PY 2023 in the summer of 2023.

0
View Post
Introducing Bradley Raine, MVC Analyst

Introducing Bradley Raine, MVC Analyst

I am happy to join the Michigan Value Collaborative (MVC) in the role of Analyst and am looking forward to working with the MVC team to help improve the quality and value of healthcare provided in the state of Michigan.

I graduated from the University of Michigan with my Bachelors of Science in Biology in 2015, and spent nearly three years working in the prep lab for the Michigan Clinical Research Unit (MCRU) based at the Cardiovascular Center. There I developed an interest in research methodology and wanted to learn more about how research teams use their data to publish their findings. Therefore, I decided to pursue a degree in Statistics, and graduated from Central Michigan University in August 2020 with a Master’s of Science degree.

In order to complete my graduate degree, I worked on a visualization project for COVID-19 data using Tableau. I found this product to be a great tool for creating dashboards to tell stories about data, and am hoping to take the skills learnt and implement them in a professional setting.

As an analyst for MVC, I am excited to learn how to analyze data using medical claims information to identify areas for improvement in quality of care. This has been important to me ever since having worked at MCRU and seeing how much data can do towards improving patient outcomes.  I am looking forward to taking the knowledge and experience gained at Central Michigan University and using it for this purpose. If you have any questions or wish to get in touch, please feel free to email me at bjraine@med.umich.edu.