MVC released another new push report recently with the first iteration of a skilled nursing facility (SNF) and home health focused report. MVC members frequently identify post-discharge care and SNF utilization as focus areas for quality improvement; therefore, this report was developed to help hospitals benchmark their performance in this area and identify opportunities to improve care coordination. Critical access hospitals (CAHs) received a tailored version of the report to allow for metric comparisons to only other CAHs.
This report highlighted various SNF and home health utilization metrics using 30-day claims-based episodes for MVC’s medical conditions: acute myocardial infarction (AMI), atrial fibrillation, chronic obstructive pulmonary disease (COPD), congestive heart failure (CHF), endocarditis, pneumonia, sepsis, small bowel obstruction, and stroke. Patient episodes were included if they had an inpatient admission between 1/1/2021 and 6/30/2022 and had one of the following insurance plans: Blue Care Network (BCN) HMO Commercial or Medicare Advantage (MA), Blue Cross Blue Shield of Michigan (BCBSM) PPO Commercial or MA, or Medicare Fee-for-Service (FFS).
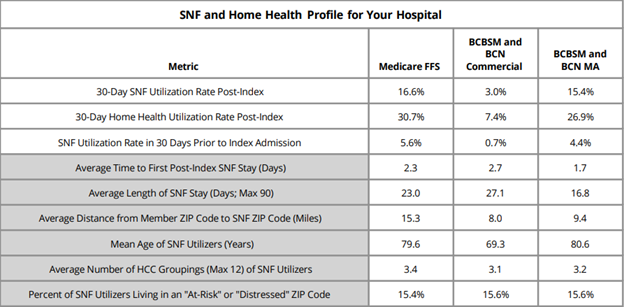
The first page of the report contained a SNF and home health profile table (Figure 1), which included nine metrics designed to give an overall look at post-discharge utilization patterns as well as information about a given hospital’s patient population. The first three metrics reflected all patients treated for medical conditions in this time period for the included payers and the metrics in gray were comprised only of patients that utilized SNF in the 30 days post-discharge from their episode's index hospitalization. Overall, MVC found that Medicare FFS patients utilized SNF and home health services more often than other payers. For CAHs, this table was not separated by payer.
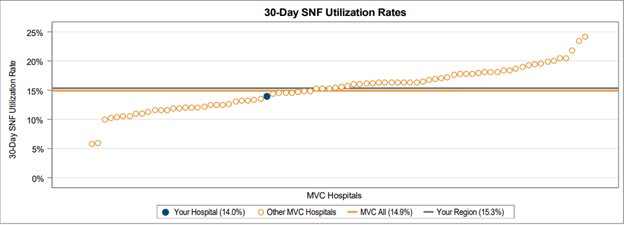
On the subsequent pages, 30-day overall SNF and home health utilization rates were provided in a caterpillar plot format to showcase variation across the collaborative (Figure 2). These rates varied between 5% and 25% for SNF utilization and between 10% and 40% for home health utilization.
MVC also provided 30-day SNF and home health utilization rates broken out by condition to allow each hospital to benchmark rates across their site’s medical service lines and compared to the MVC average rate for each condition (Figure 3). Medical conditions were only included in this figure if a hospital had at least 11 cases between 1/1/2021 and 6/30/2022. On average across the collaborative, the highest 30-day post-discharge SNF utilization rates were observed in endocarditis (28%), sepsis (19.5%), and stroke (19.5%) patients.
Hospitals also received a table identifying the most frequently utilized SNFs from a medical condition episode to help sites understand where their patients are going when receiving SNF care after discharge. A similar table was shown for home health providers.
The final page of the report included four caterpillar plots tailored to specific denominators. This included 30-day SNF and home health utilization rates for the cohort of patients discharged home. It also included readmission rates for patients who were discharged to SNF and readmission rates for patients discharged to home health. These plots were included to inform each hospital about patterns in their transitions of care and readmissions. There was significant variability in readmission rates following discharge to either a SNF or home health facility, with some hospitals averaging close to 5% readmission rates and some hospitals seeing an average of nearly 40% of patients readmitted during the 30-day post-discharge window (Figure 4).
As part of its new Lunch & Learn series, MVC recently hosted a session focused on MVC data that included a walkthrough of its SNF/HH report and a deeper dive into those report metrics using MVC’s registry. Those who were unable to attend can watch a recording of the presentation here, which demonstrates how to replicate aspects of the push report on MVC’s registry in order to view additional episode spending and patient-level data.
If you have any questions or feedback about this report, please reach out to the MVC Coordinating Center.


