MVC proudly partners with 40 physician organizations (PO) spanning the state of Michigan and continues to refine and add to the resources tailored to these members. As part of this work, MVC recently refreshed and shared PO joint replacement reports in December. These PO-level reports were first shared in October 2021 with a focus on the shift away from inpatient surgeries as well as post-acute care utilization for combined joint procedures.
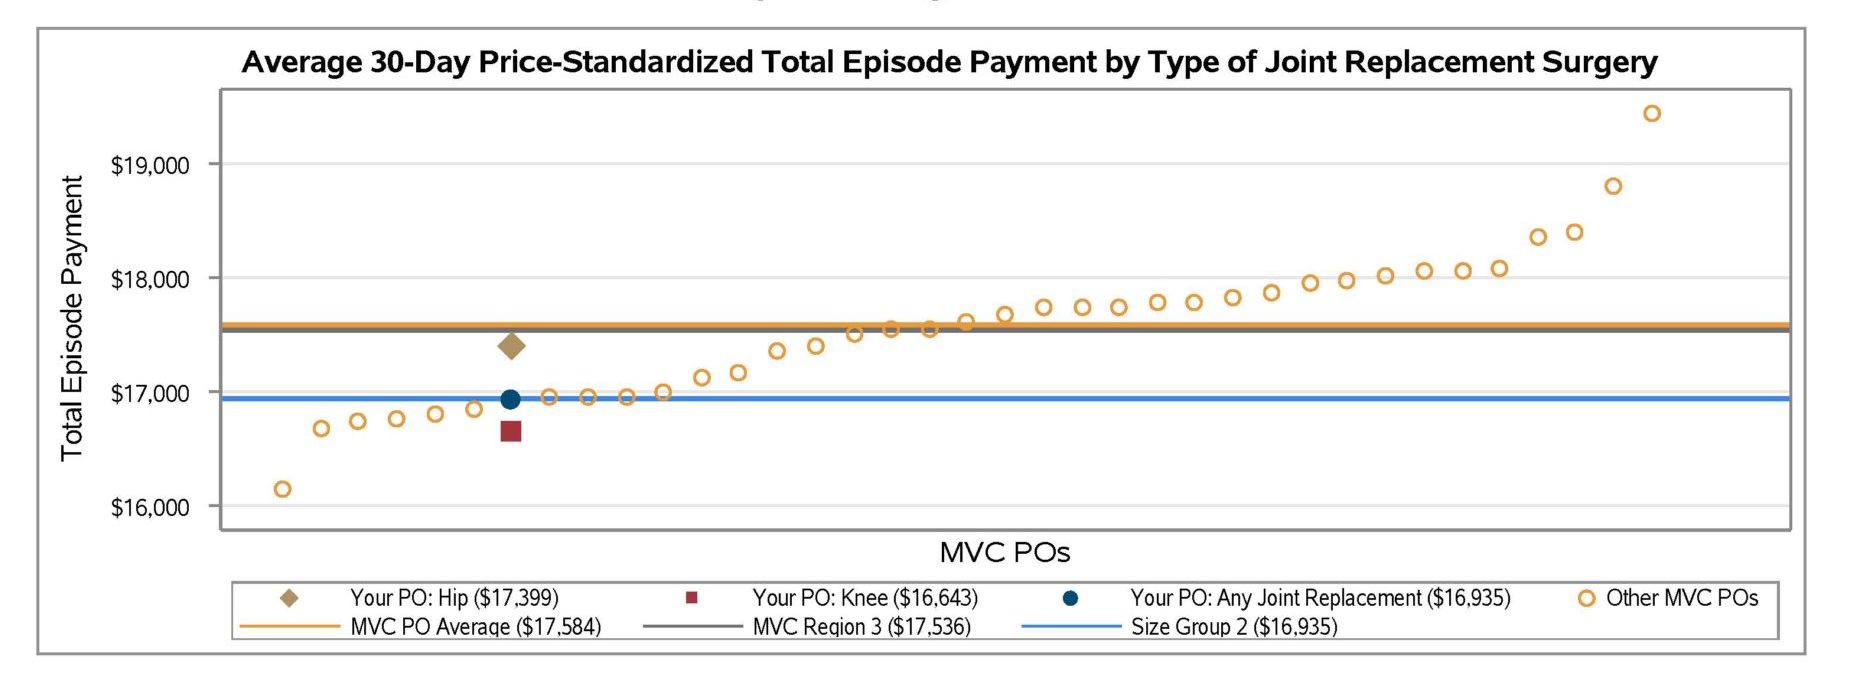
The recently refreshed reports carried forward many of the joint episode metrics included previously, but with additional stratification and detail. For instance, whereas the 2021 version presented figures for all joint surgeries combined, many of the figures in the December 2022 version provided data stratified by hip procedure, knee procedure, and all joint procedures. Similarly, some figures are stratified by the location of the procedure (inpatient vs. outpatient). This new differentiation was intended to help POs more easily understand the underlying drivers of their metrics. For example, the blinded hospital below (Figure 1) could observe that its average 30-day price-standardized total episode payment is driven more by hip surgeries ($17,399) than knee surgeries ($16,643). This site could also observe that its overall total episode payment is below both the collaborative-wide PO average and the average in their region, and at the average for other POs of a similar size.
Figure 1.
Additional detail was also added to the patient attribution table, which now identifies the top 10 index facilities (rather than five) where a PO’s attributed patients underwent joint replacement surgery. This table now also includes each index facility’s percent of joint episodes performed in an outpatient setting as well as their average 30-day price-standardized total episode payment for attributed patients. This change was intended to inform quality improvement discussions between POs and partner hospitals or Ambulatory Surgical Centers (ASCs).
Also new to this report were 30-day outpatient rehabilitation rates and a patient population snapshot table to help POs better understand the demographics of patients included in the report. The table included mean age, top two patient Zip codes, the percent of patients living in an “at-risk” or “distressed” Zip code according to the Distressed Communities Index, the proportion of patients belonging to different racial categories, their average length of stay, and their 30-day post-surgery complication rate. Each of these categories was summarized separately by insurance plan.
This report utilized administrative claims from attributed members spanning 1/1/19 – 6/30/21 for Blue Cross Blue Shield of Michigan (BCBSM) PPO Commercial, BCBSM Medicare Advantage, and Medicare Fee-for-Service. Reports were prepared for all POs that participate in MVC and had at least 20 joint replacement episodes in 2019 and 2020, and at least 11 episodes in the first half of 2021.
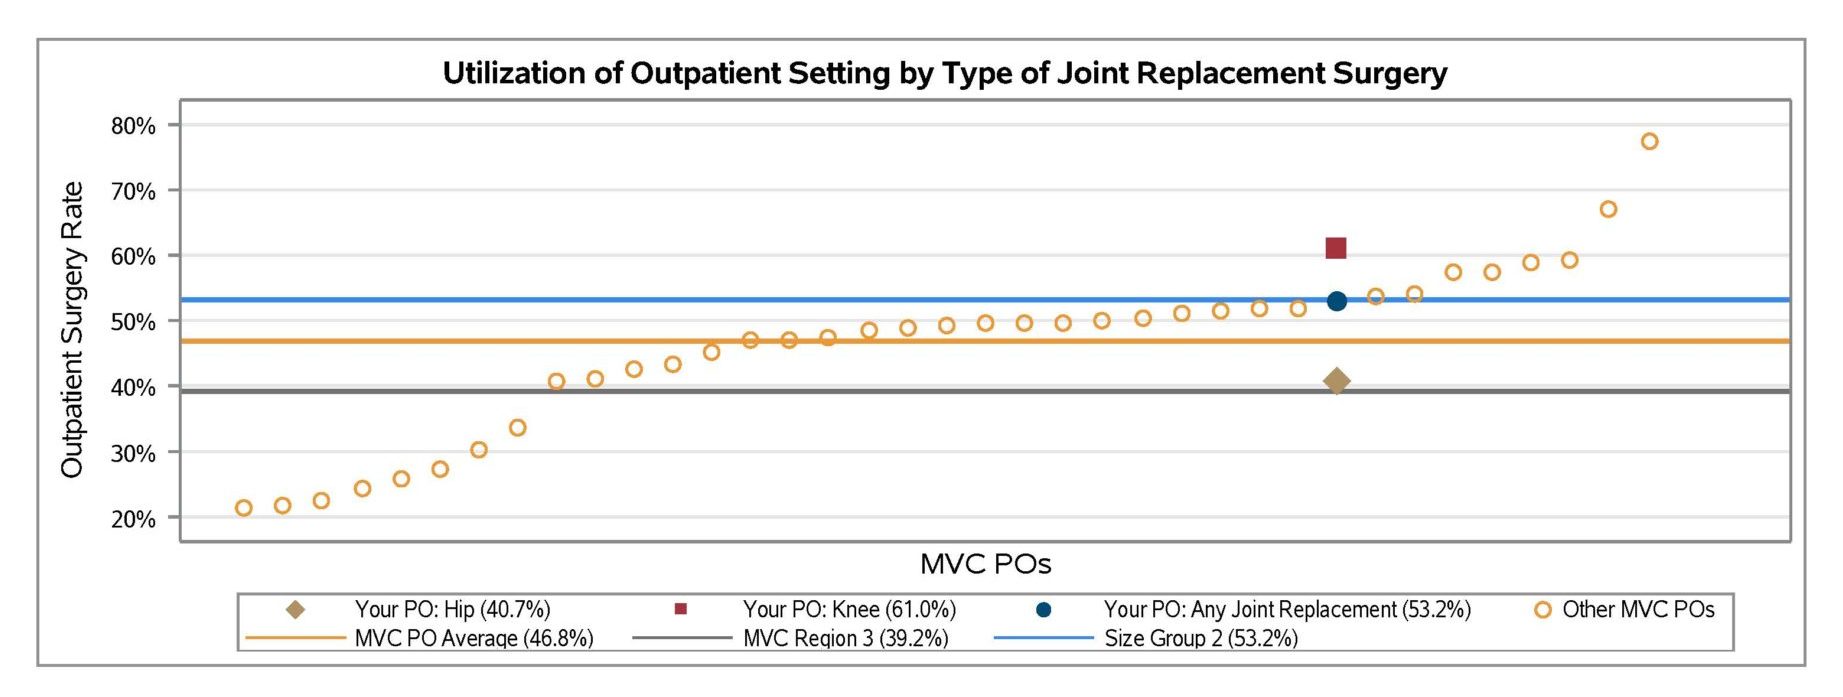
In general, report findings indicated that utilization of outpatient surgery settings continued to increase in 2021 on average (Figure 2). However, there was still significant variation between MVC’s 40 PO members in their average rate of joint replacement surgeries taking place in outpatient settings (Figure 3). For joint episodes in 2019 through the first half of 2021, outpatient surgery rates ranged from just over 20% to nearly 80%.
Figure 2.
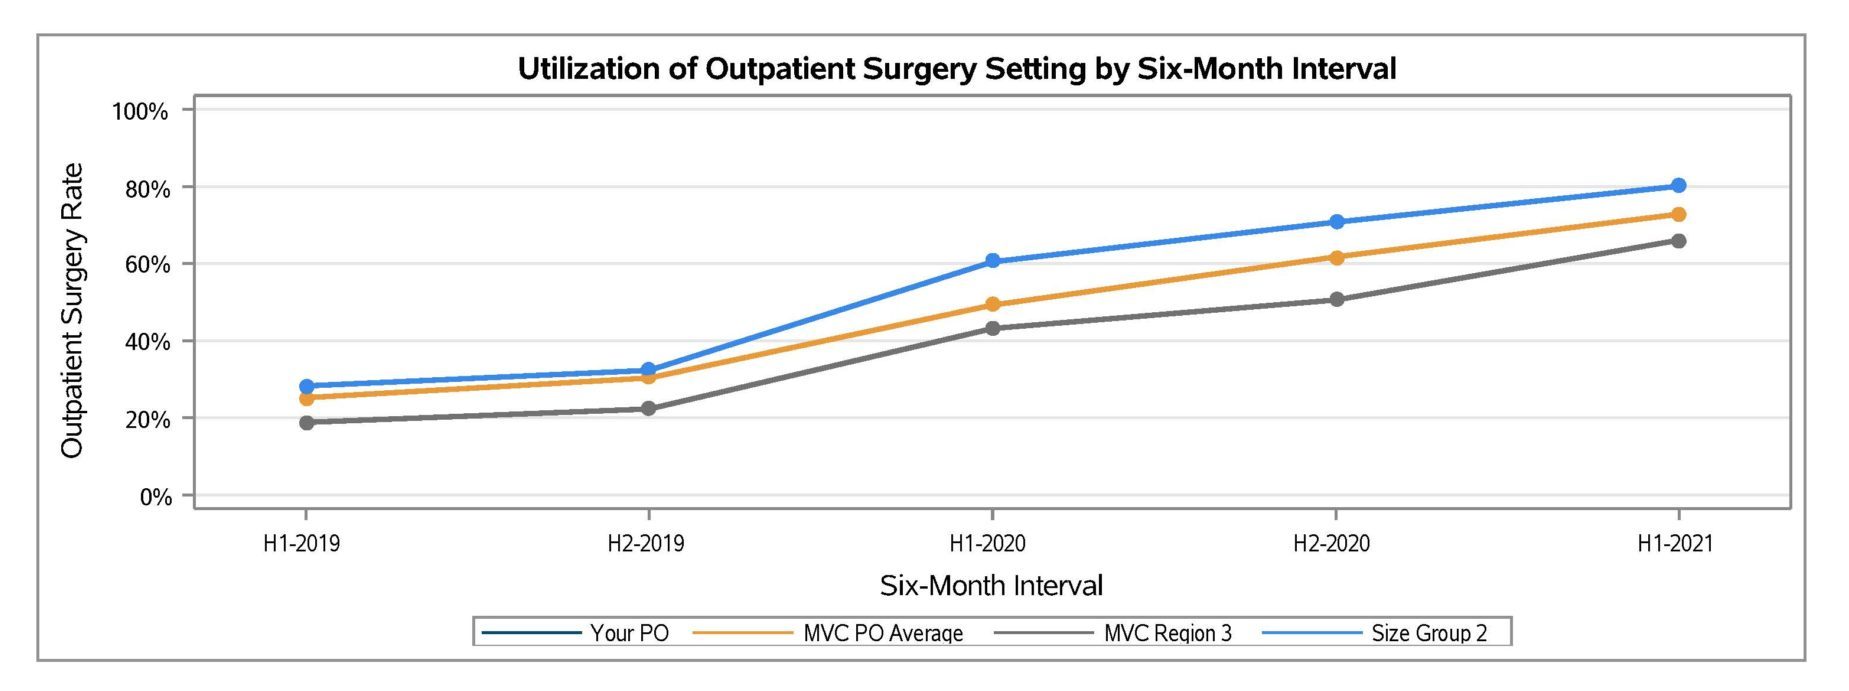
Figure 3.
On average across the collaborative, POs still had low rates of skilled nursing facility (SNF) utilization (6.7%) and higher rates of home health (HH) utilization (55.3%). However, variation in PO member HH utilization rates ranged from approximately 10% to 90%.
If you have feedback on your new PO joint replacement report or would like to request an additional custom analysis to better fit your needs, contact the Coordinating Center at Michigan-Value-Collaborative@med.umich.edu.
