The Michigan Value Collaborative (MVC) houses a wealth of administrative claims data for Blue Cross Blue Shield of Michigan, Blue Care Network, and Medicare Fee-For-Service beneficiaries in Michigan. These data provide valuable insights about health services utilization, patient outcomes, and the value of care received at facilities across Michigan. To gain meaningful insight from large sets of unprocessed claims data, MVC transforms these claims into 30- and 90-day episodes of care for over 40 different medical conditions and surgical procedures. These episodes are the core of MVC analytics and result in the data available to MVC members through the online data registry and push reports. In order to best understand the meaning of MVC analytic outputs, it’s important to know what an MVC episode actually includes and how it is created.
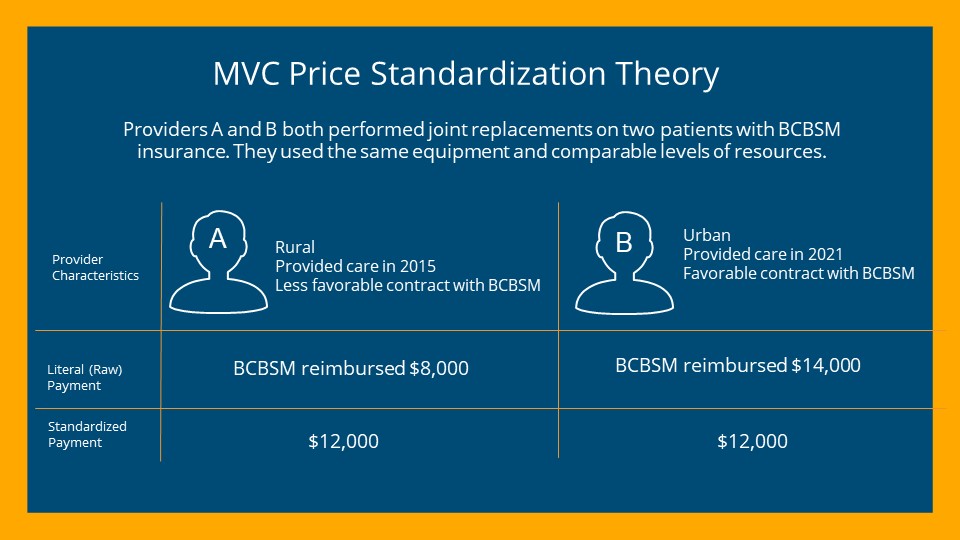
One of the ways that MVC provides insights into episodes of care is with data on payments for professional and facility healthcare services. A foundational aspect of MVC data is that payments are price standardized and risk adjusted. In other words, the payments that MVC shares in its reports and on the registry are not representative of actual dollars; they represent utilization of healthcare services that account for patient, provider, and payer differences for fairer comparisons between members and over time. Price standardization removes variation due to various factors that impact insurer payments, such as the payer, contractual agreements, geographic location, and time (see example scenario in Figure 1).
Figure 1.

On the other hand, risk adjustment accounts for differences between patients, because some patients have more healthcare needs than others and may experience a worse outcome or require greater amounts of care than another patient. Risk adjustment helps with fair comparisons between hospitals that see more complex patients compared to those with fewer complex patients. MVC’s risk adjustment always accounts for patient age, gender, payer, history of high healthcare expenditures, and comorbidities such as end-stage renal disease. It also sometimes accounts for condition-specific factors. Together, price standardization and risk adjustment allow for patients and hospitals to be compared more accurately and fairly in MVC reporting.
How are MVC episodes created?
Episodes are initiated by one of three types of index events: inpatient admission to a hospital, an emergency department visit resulting in an inpatient admission to a hospital, or an outpatient procedure at a hospital. To become an MVC episode, these initiating events must have corresponding billed and paid insurance claims that fit into the episode definition of an MVC condition. These definitions are typically comprised of inclusion and exclusion codes for ICD-9-CM and ICD-10-CM diagnosis codes, ICD-9-PCS and ICD-10-PCS codes, and/or CPT codes. Generally speaking, episodes of medical conditions have an initiating facility or professional inpatient claim with a qualifying diagnosis code in the primary diagnosis code position. For example, a patient admitted to an inpatient hospital with a primary diagnosis code of R65.20 (severe sepsis without septic shock) may have a sepsis episode in MVC data. The criteria for initiating surgical episodes are more varied and depend on the procedure. For more details about condition-specific episode definitions and rules, please refer to the MVC Episode Definitions document available on the resources page of the MVC registry.
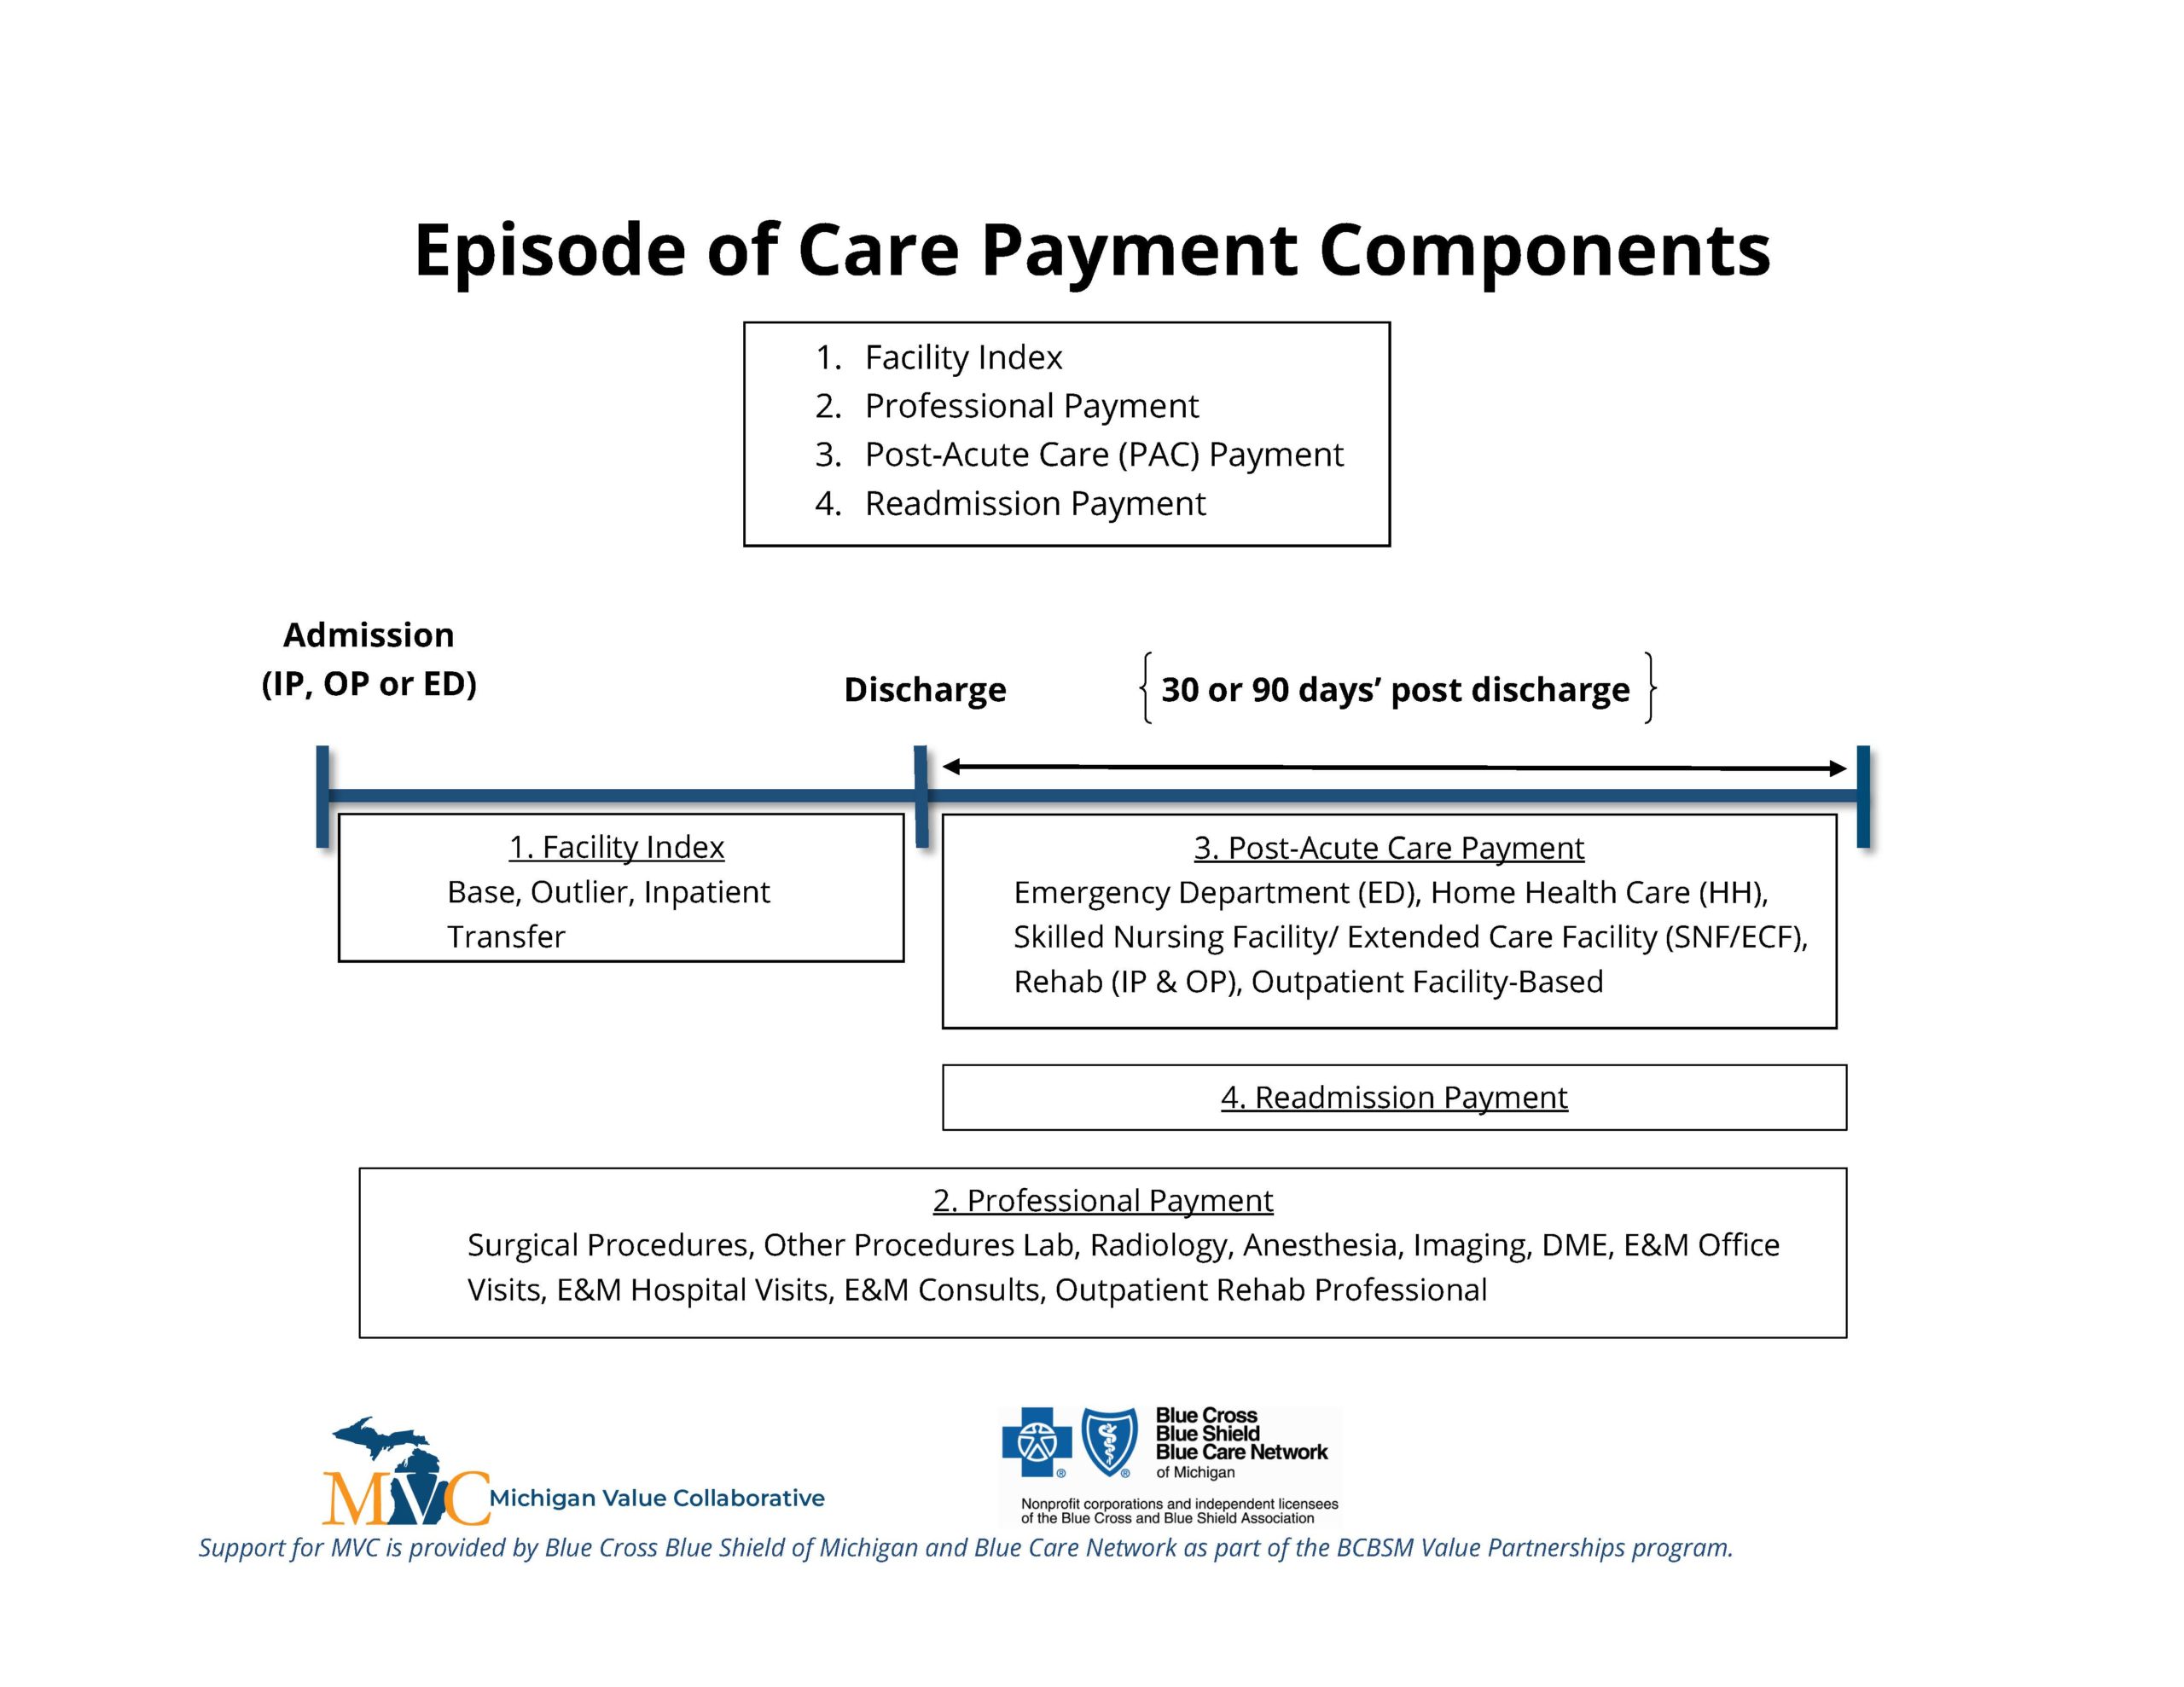
Once an episode is initiated, the claims that follow are attached to that episode and categorized into payment components (Figure 2). The span of the initiation of an episode through initial discharge is called the index event, for which MVC aggregates facility claims and associated price-standardized facility payments for the base payment as well as outlier and transfer payments, if applicable. The claim categories after index discharge make up the bulk of an episode. This post-discharge aspect of MVC episodes allows hospitals to follow their patients after they leave the hospital's four walls. For the 30 or 90 days after discharge, facility claims for that patient’s episode are price-standardized and categorized into post-acute care and inpatient readmission components. Post-acute care is further sub-categorized into the following categories: emergency department (ED), home health care (HH), skilled nursing facility (SNF), rehab (inpatient and outpatient), and outpatient facility-based services. For greater detail about MVC episode creation, see the MVC Data Guide on the resources page of the MVC website.
Figure 2.

While facility claims and their respective price-standardized payments are grouped into various categories, the price-standardized professional payment spans the entirety of the episode. Since claims for facility and professional-based services are billed separately, they can be brought together by service dates for a more comprehensive summary of care. The resources page on the MVC website contains a more detailed breakdown of episode payment components.
How are episodes used?
Once episodes are created, the MVC Coordinating Center analyzes these data to answer a variety of questions about health services utilization. For example, what proportion of a hospital’s joint replacement patients are going to a SNF after their procedure? How does that compare to the statewide average? How long is the average length of stay for a hospital’s sepsis patients? What proportion of sepsis patients are admitted to the ICU/CCU during their hospitalization? There are many questions surrounding utilization and outcomes that MVC utilizes its data to help answer. MVC episodes can help inform a wide variety of quality improvement initiatives for numerous conditions.
In addition to some of the measures mentioned above, MVC frequently includes comparison groups in reporting as a point of reference, which allows hospital and physician organization (PO) members to compare their performance, utilization, or outcomes with the collaborative average, regional average, or other individual hospitals or POs. MVC comparison groups are sometimes further tailored by size or type, such as by critical access hospital status or by PO size. See Figure 3 for a sample caterpillar plot from a recent chronic obstructive pulmonary disease (COPD) report for POs.
Figure 3.

While claims-based analytics can provide insights into health services utilization, it doesn’t always reveal the full picture. MVC encourages members to use its push reports and custom reports in conjunction with electronic medical record data and as conversation starters with staff and clinicians working on particular conditions or service lines. Additionally, many MVC conditions align with other collaborative quality initiatives (CQIs). As the MVC team collaborates with other CQIs to combine clinical and claims data, MVC encourages cross-collaboration of site champions to foster partnerships and information sharing.
The MVC Coordinating Center is always open to comments and suggestions to help improve its portfolio of analytic offerings. If you or your team has any feedback on existing reports, suggestions for new reports, or interest in new MVC conditions, please contact the Coordinating Center at Michigan-Value-Collaborative@med.umich.edu.


