In early 2020, the Michigan Value Collaborative (MVC) Coordinating Center created a new sepsis service line with the help of the Michigan Michigan Hospital Medicine Safety Consortium (HMS). Initially the service line began with 215,447 episodes and has since grown to 229,673 episodes. In conjunction with the creation of the sepsis service line, reports customized to each collaborative member hospital were developed. The most recent iteration of these, shared in two volumes, were disseminated to members in February 2021.
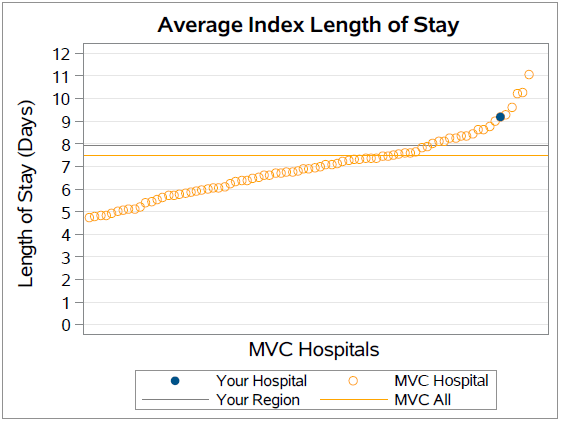
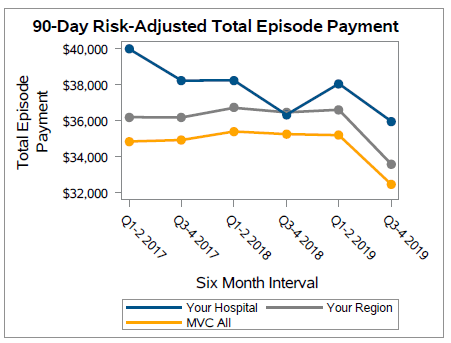
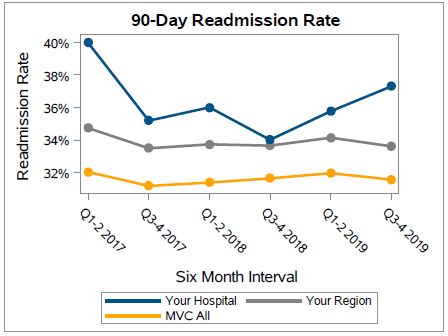
Each volume of the sepsis reports serves their own unique purpose. The first volume provides a detailed review into specific components of a sepsis episode with the ability for each member to compare individualized information to regional and statewide averages. These metrics help members garner a better understanding of the sepsis patient population from admission to 90-days post discharge with data on length of stay, causes for readmission, and post-acute care utilization. Figure 1 shares information on length of stay, and this example shows Hospital A’s (a fictional institution) average length of stay to be higher than both the regional and collaborative-wide average. Additionally, metrics such as total episode payment and readmission rates are displayed as trends over time as shown in Figure 2 and Figure 3.
Figure One.

Figure Two.

Figure 3 shows that the individual hospital trend for the 90-day readmission rate is higher than both the regional and MVC averages which mirror each other closely. Initially, the overall hospital trend decreases towards the regional average, but climbs again in 2019. MVC members may wish to use this information to investigate the root causes leading to increased readmissions.
Figure Three.

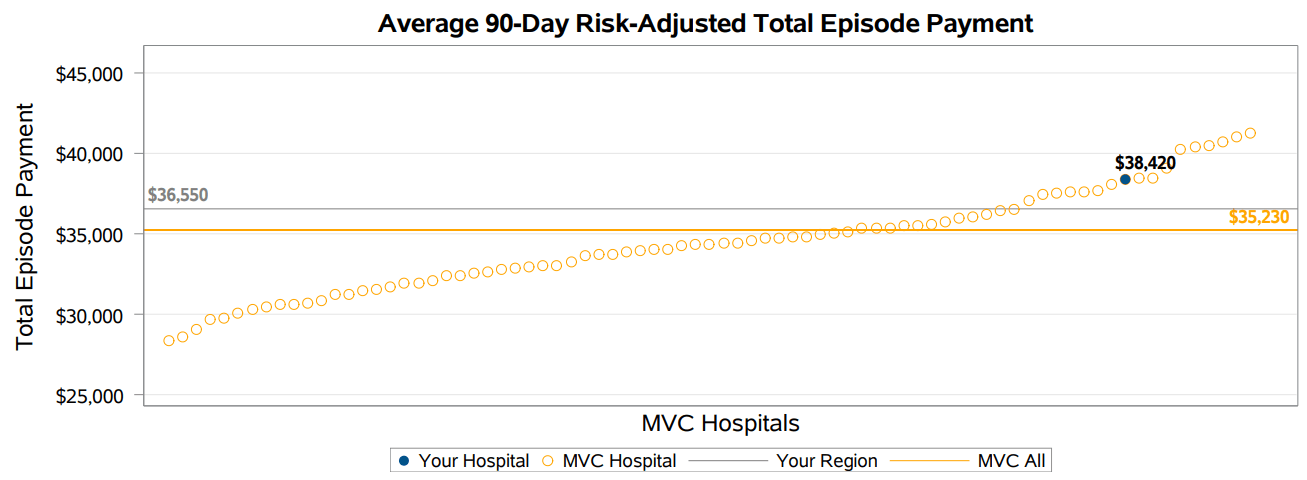
The second volume of MVC’s sepsis reports provides benchmarking for members to identify how they compare to all other MVC hospitals. Figure 4 shows information on a hospital’s total episode payment compared to the regional and MVC averages. In addition, it shows the range of the average total episode payments across the collaborative. By using previously sent reports, hospitals can compare how the metrics have changed - such as an increase or decrease in collaborative-wide or individualized total episode payments. As these reports are disseminated every six months, when comparing, it is important to take notice of the reporting period covered in each report which can be located in the associated cover letter and footnotes. Members can also access their own sepsis related data on the MVC registry.
Figure Four.

If you have any suggestions on how these reports can be improved or the data made more actionable, we would love to hear from you. We are also seeking feedback on how collaborative members are using this information in their quality improvement projects. Please reach out to the Coordinating Center at michiganvaluecollaborative@gmail.com to share your story. If you have any questions or are interested in custom data for your facility, contact us at the aforementioned email address.