
Earlier this month, the MVC Coordinating Center distributed a refreshed version of MVC’s common conditions report. This report delivered a comprehensive analysis of care episodes for six prevalent medical and surgical conditions frequently targeted for quality improvement initiatives within MVC hospitals. The included conditions were chronic obstructive pulmonary disease (COPD), congestive heart failure (CHF), coronary artery bypass graft (CABG), percutaneous coronary intervention (PCI), pneumonia, and sepsis. MVC generated hospital-level reports for 106 members, with tailored versions for general acute care hospital (GACH) and Critical Access Hospital (CAH) members.
Report pages focused on 30-day total episode payments, post-acute care utilization, readmission rates, and common reasons for readmissions. The report continued to highlight payments and outcomes for a two-year window, but the date range was updated to reflect claims from Jan. 1, 2024, through Dec. 31, 2025, for Blue Cross Blue Shield of Michigan (BCBSM)/Blue Care Network (BCN) Commercial, BCBSM/BCN Medicare Advantage (MA), and Michigan Medicaid; Medicare Fee-for Service (FFS) claims from the period of Jan. 1, 2024, through June 30, 2025, were used.
To ensure member reports had a sufficient sample from which to draw meaningful conclusions, MVC continued to apply case count inclusion criteria for the condition-specific pages. Previously, MVC required a site to have 11 episodes per year for both years to receive a condition-specific page; this year, condition-specific pages were included for all conditions with at least 20 episodes in the reporting period. This update expanded both the number of hospitals eligible for their report and report pages per hospital. For CAH members, MVC also expanded the reporting period for the CAH reports to Jan. 1, 2023, through Dec. 31, 2025, for all conditions.
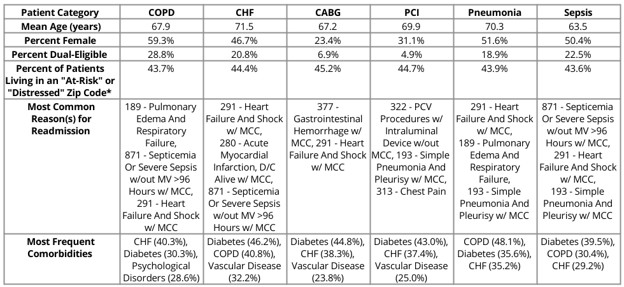
The report began with a summary of patient population characteristics (Figure 1), comparing demographics, risk factors, readmission diagnoses, and comorbidities across each eligible cohort. The table was provided to help hospitals better understand the patient populations underlying the reporting for these six conditions/procedures.
Figure 1. Sample Blinded Table for a Hospital’s Patient Population Snapshot, Common Reasons for Readmission, and Frequent Comorbidities
The remainder of the report was comprised of condition-specific pages. MVC provided benchmarking figures for average 30-day risk-adjusted, price-standardized total episode payment and 30-day inpatient readmission rate for each condition. MVC price standardized total episode payments to Medicare FFS amounts so that comparisons could be made across hospitals and over time. Payments were risk-adjusted for patient age, gender, payer, comorbidities, and high or low prior healthcare utilization/payments. These figures showcased a given hospital’s position relative to all other eligible MVC hospitals in the collaborative and provided the average total episode payment within a hospital’s region and statewide.
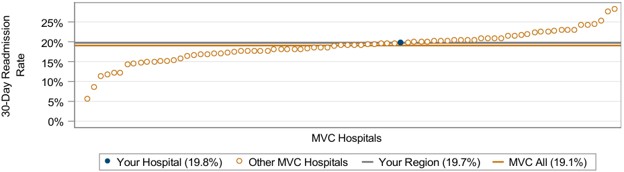
Across the collaborative, CABG had the highest average total episode payment at $53,183 (Figure 2), followed by sepsis and CHF. The collaborative-wide average total episode payment for all conditions did not vary significantly between the 2025 report and the 2026 report. Readmissions were observed to be highest across the collaborative at 19.1% for patients hospitalized for CHF (Figure 3), followed by patients hospitalized for sepsis or COPD. Readmission rates were lowest across the collaborative at 5.4% among patients who underwent a PCI procedure.
Figure 2. Average 30-Day Risk-Adjusted, Price-Standardized Total Episode Payment Among Patients Hospitalized for CABG (Blinded Report)
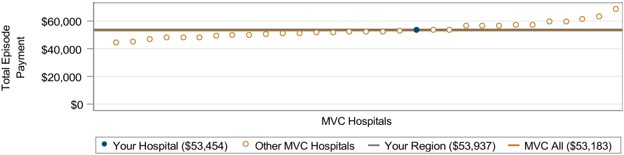
Figure 3. 30-Day Readmission Rate Among Patients Hospitalized for CHF (Blinded Report)
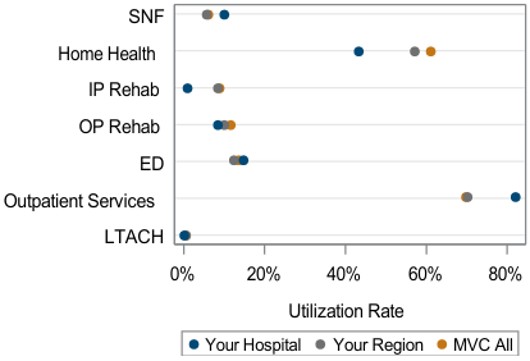
The final figures on the condition-specific pages worked in tandem to display the utilization and cost components that made up a hospital’s average price-standardized, risk-adjusted post-acute care (PAC) payments in the 30 days following discharge. Most hospitals received a figure displaying the breakdown of 30-day risk-adjusted, price-standardized post-acute care payments by payer categories (Figure 4). All payer categories with at least 11 episodes during the reporting period were reflected, including a “Dual-Eligible” category representing patients eligible for both Medicare and Medicaid coverage; as such, Medicare and Medicaid categories did not include dual-eligible patients when that category was included. The post-acute care categories for both figures included home health care, skilled nursing facility (SNF) care, inpatient rehab, outpatient rehab, emergency department (ED) care, long-term acute care hospitals (LTACH), and outpatient services.
Figure 4. Breakdown by Payer of 30-Day Risk-Adjusted, Price-Standardized Total Post-Acute Care Payments Among Patients Who Had a CABG Procedure (Blinded Report)
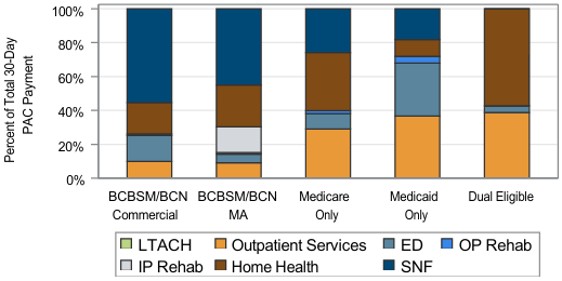
Beyond offering insights into payments by payer and post-acute care category, this figure can offer additional insights and context when considered alongside Figure 5 showing post-acute care utilization rates. The two figures together served to provide a clearer understanding of the relationship between rates of utilization and percent of episode spending for each post-acute care category, illustrating whether spending aligns with utilization frequency. For example, payment categories with a high percentage of post-acute care payment in Figure 4 and a low overall utilization rate in Figure 5 may be indicative of low volume, high-cost outliers within a given condition at that hospital.
Figure 5. 30-Day Post-Acute Care Utilization Among Patients who had a CABG Procedure (Blinded Report)
MVC is dedicated to regularly updating its commons conditions report, aiming to equip collaborative partners with insightful data that can drive and reinforce meaningful advancements in healthcare quality. Please contact MVC with any questions or related analytic requests. If you require any digital accessibility accommodation, please let us know and we will be happy to provide alternative formats.