Recently, the MVC Coordinating Center published its annual Qualified Entity Certification Program (QECP) public report for 2026. This report was published on the QECP section on MVC’s Data/Registry webpage and is an annual requirement for MVC as a qualified entity with the Centers for Medicare & Medicaid Services (CMS). This was MVC’s fifth public QECP report, which continued to provide unidentified aggregated data about Michigan hospital performance on two measures: rates of 30-day rehospitalizations following start of home health care, and rates of outpatient follow-up received after hospitalization for congestive heart failure (CHF) or chronic obstructive pulmonary disease (COPD).
All measures in the report were created using data from MVC claims-based episodes of care initialized by inpatient hospitalizations or surgeries between Jan. 1, 2018, and Dec. 31, 2024. Claims were incorporated from all MVC payer sources, including Medicare Fee-for-Service (FFS), Blue Cross Blue Shield of Michigan (BCBSM), Blue Care Network (BCN), and Michigan Medicaid.
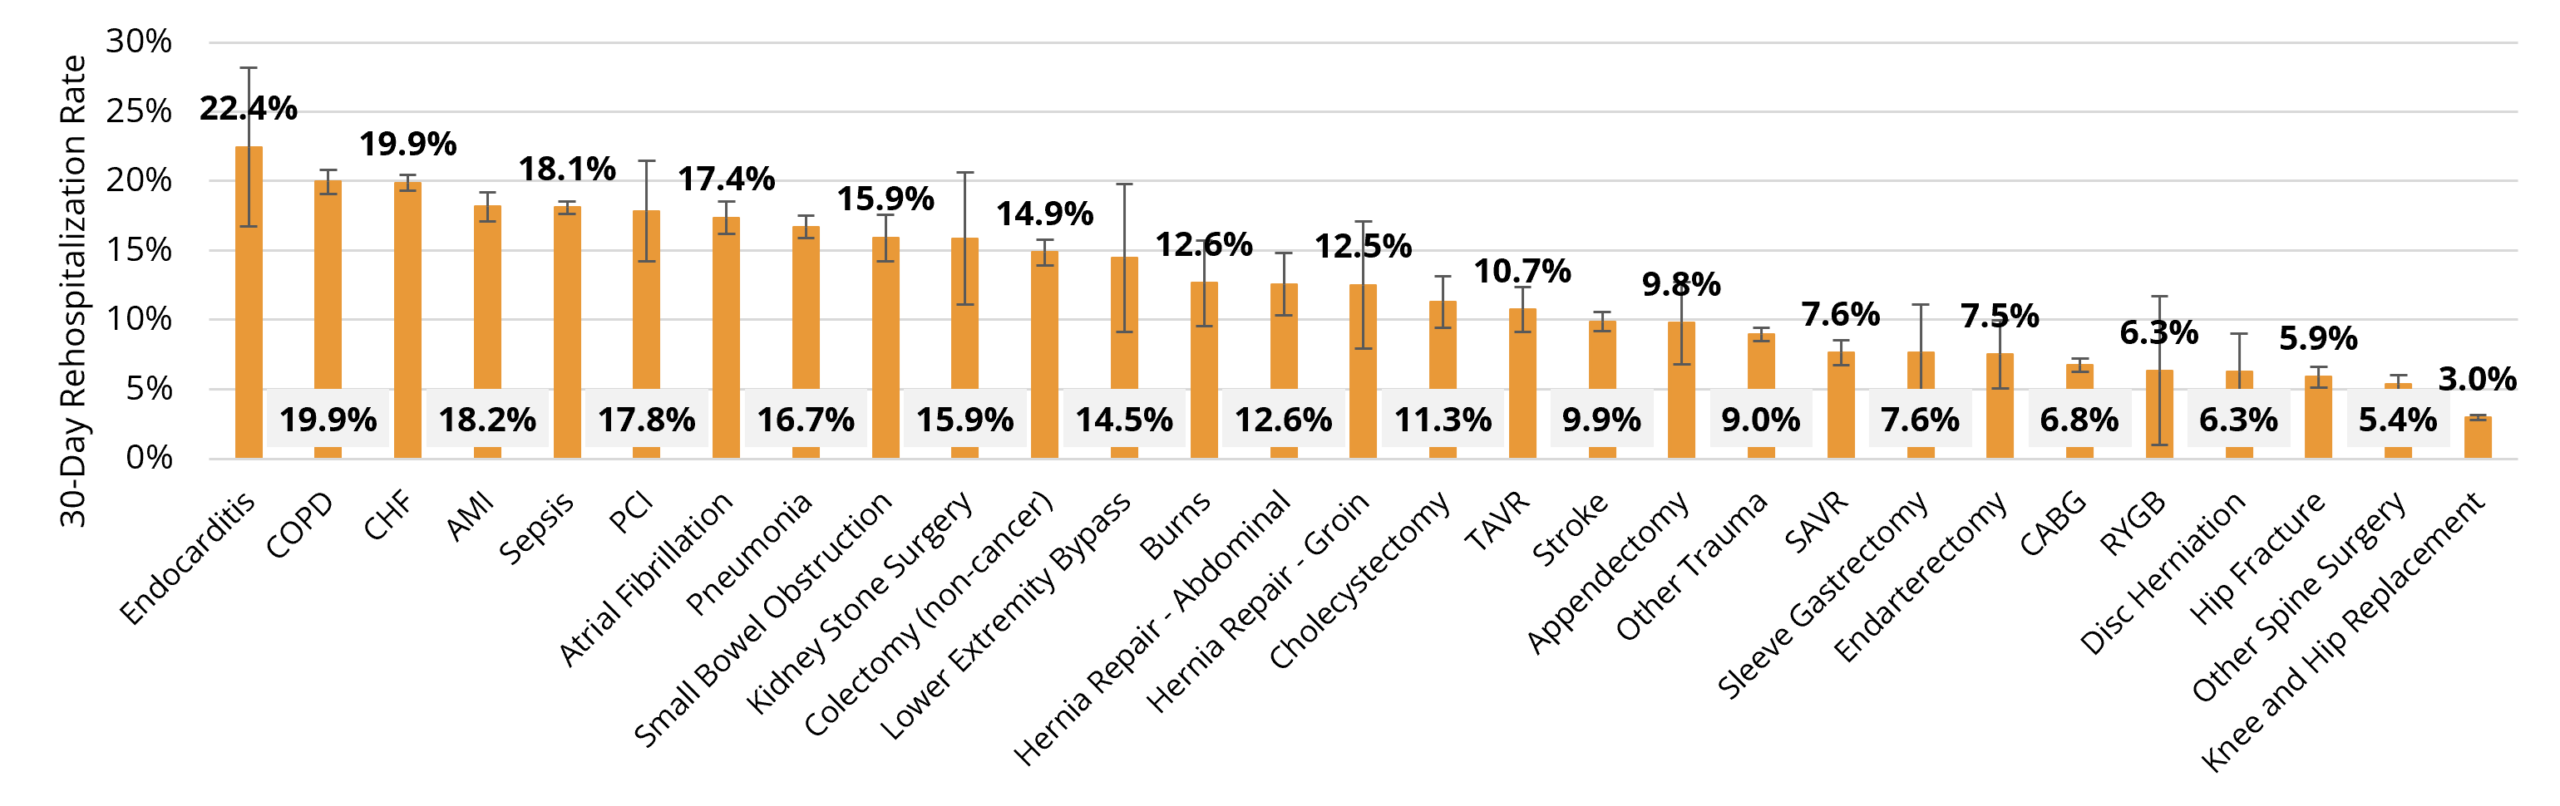
The reported overall risk-adjusted rate of 30-day unplanned rehospitalization after the start of post-acute home health care among episodes beginning at MVC hospitals in Michigan was 11.9% for 2018-2024. Risk-adjusted rates by index hospital ranged from 4.5% to 16.4% (Figure 1). By home health provider, risk-adjusted rates ranged from 2.4% to 23.9%. Patients whose episode of care began with an index event for endocarditis, COPD, or CHF were more likely than patients with other index conditions to experience an unplanned rehospitalization in the 30 days after they started home health care, with rehospitalization rates of 22.4%, 19.9%, and 19.9%, respectively (Figure 2). Patients with a joint replacement episode of care were least likely to have an unplanned rehospitalization following the start of home health care (3% rehospitalization rate).
Figure 1. Risk-Adjusted Rates of 30-Day Unplanned Rehospitalization from Home Health, by MVC Hospital
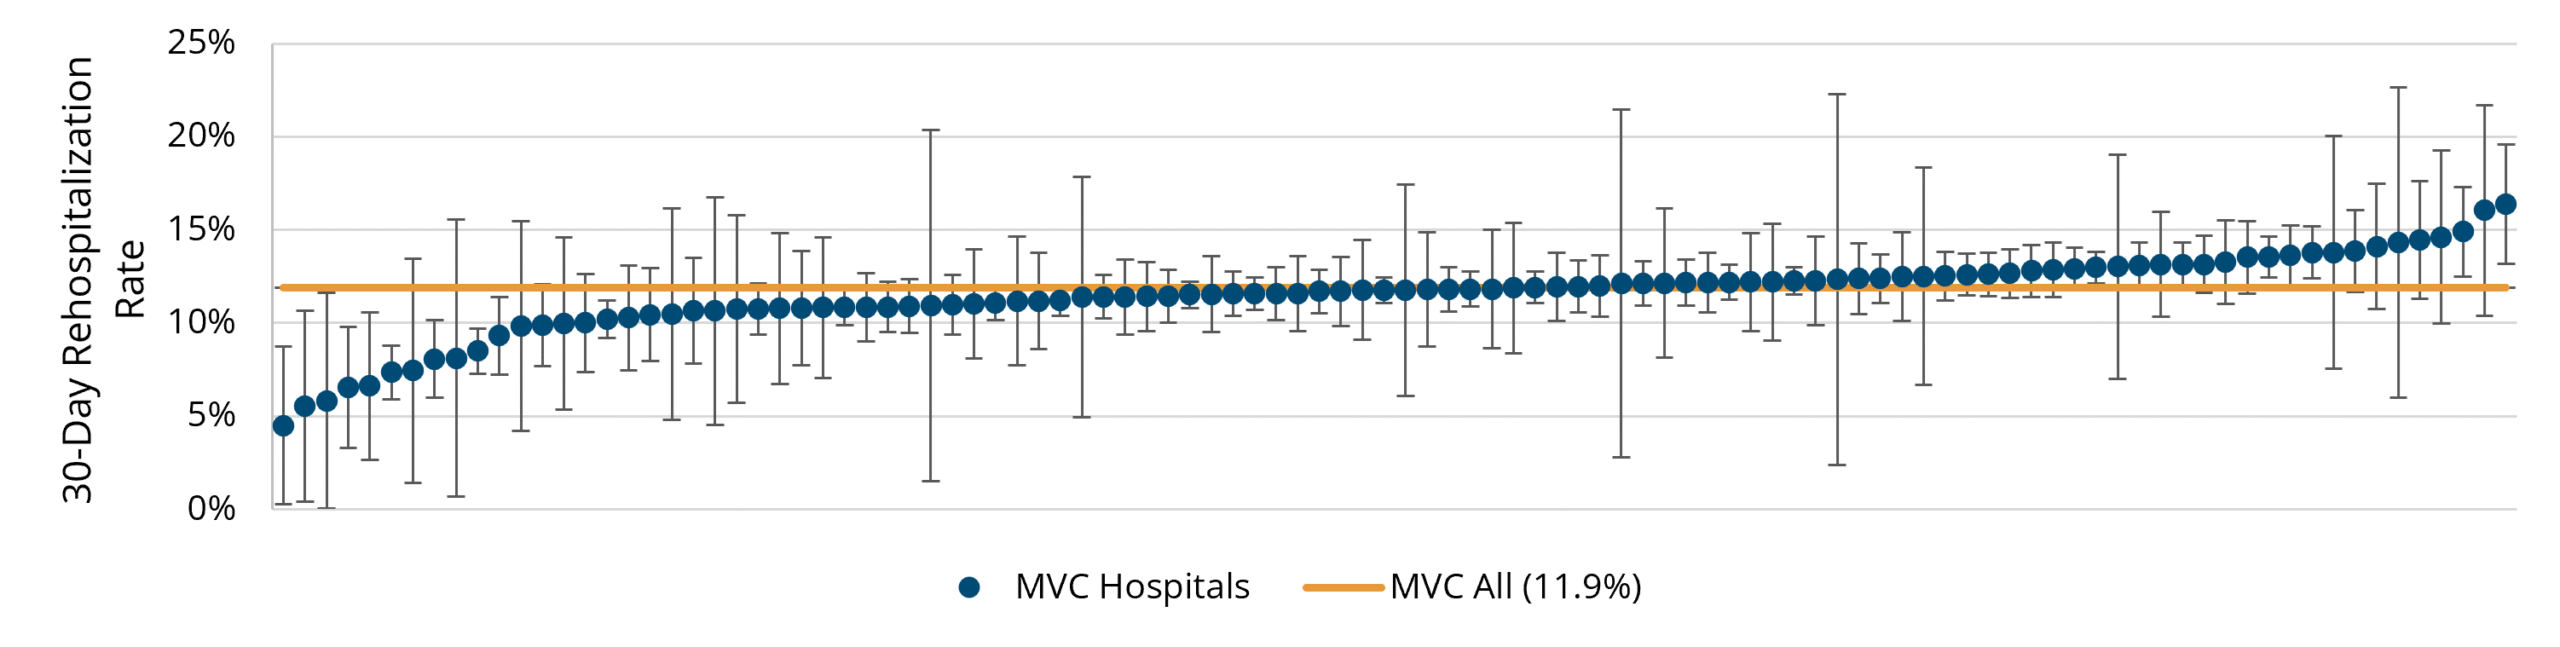
Figure 2. Unadjusted Rates of 30-Day Unplanned Rehospitalization from Home Health, by Condition
Results for the outpatient follow-up metrics remained similar to findings from previous annual reports. Across episodes of care for index events in 2018-2024 at the 107 MVC hospitals in Michigan, the unadjusted rate of patients receiving outpatient follow-up within 7 days after hospitalization for CHF was 43.6% (Figure 3). Following index hospitalizations for COPD, 35.5% of patients received outpatient follow-up within 7 days (Figure 4). Looking at 30-day follow-up for both conditions, there was wide variation across hospitals in follow-up rates after hospitalization, with rates ranging between less than 20% to over 80%. MVC calculated follow-up rates after CHF and COPD hospitalizations using 3-day, 7-day, 14-day, and 30-day follow-up windows, with those rate and hospital-level rate distributions summarized in the full report. Rates of follow-up were steady over time. Overall, follow-up rates were lower for COPD episodes compared to CHF episodes across all evaluated follow-up windows.
Figure 3. 7-Day Follow-Up After CHF Hospitalization by MVC Hospital

Figure 4. 7-Day Follow-Up After COPD Hospitalization by MVC Hospital

For more information and the entire set of findings we invite you to read the full 2026 report.
QE certification status allows MVC to provide hospital members with additional data from Medicare FFS claims at a level of granularity not otherwise available under standard CMS data use agreements. Reports located under the “QE Medicare” icon on the MVC registry allow hospital registry users to see unsuppressed Medicare data including case counts <11 as well as utilization rates and average payments based on case counts <11. In addition, on any QE Medicare registry report, members can click on specific data points to load a list of all episodes underlying that data point. From that episode list it is possible to view drilldown information on individual episodes to learn more about the claims and price-standardized payments comprising that episode.
Members may contact the MVC Coordinating Center by email to learn more about data available through MVC’s QECP reports and to receive the forms necessary to gain access on the registry.