Data Offerings for Members
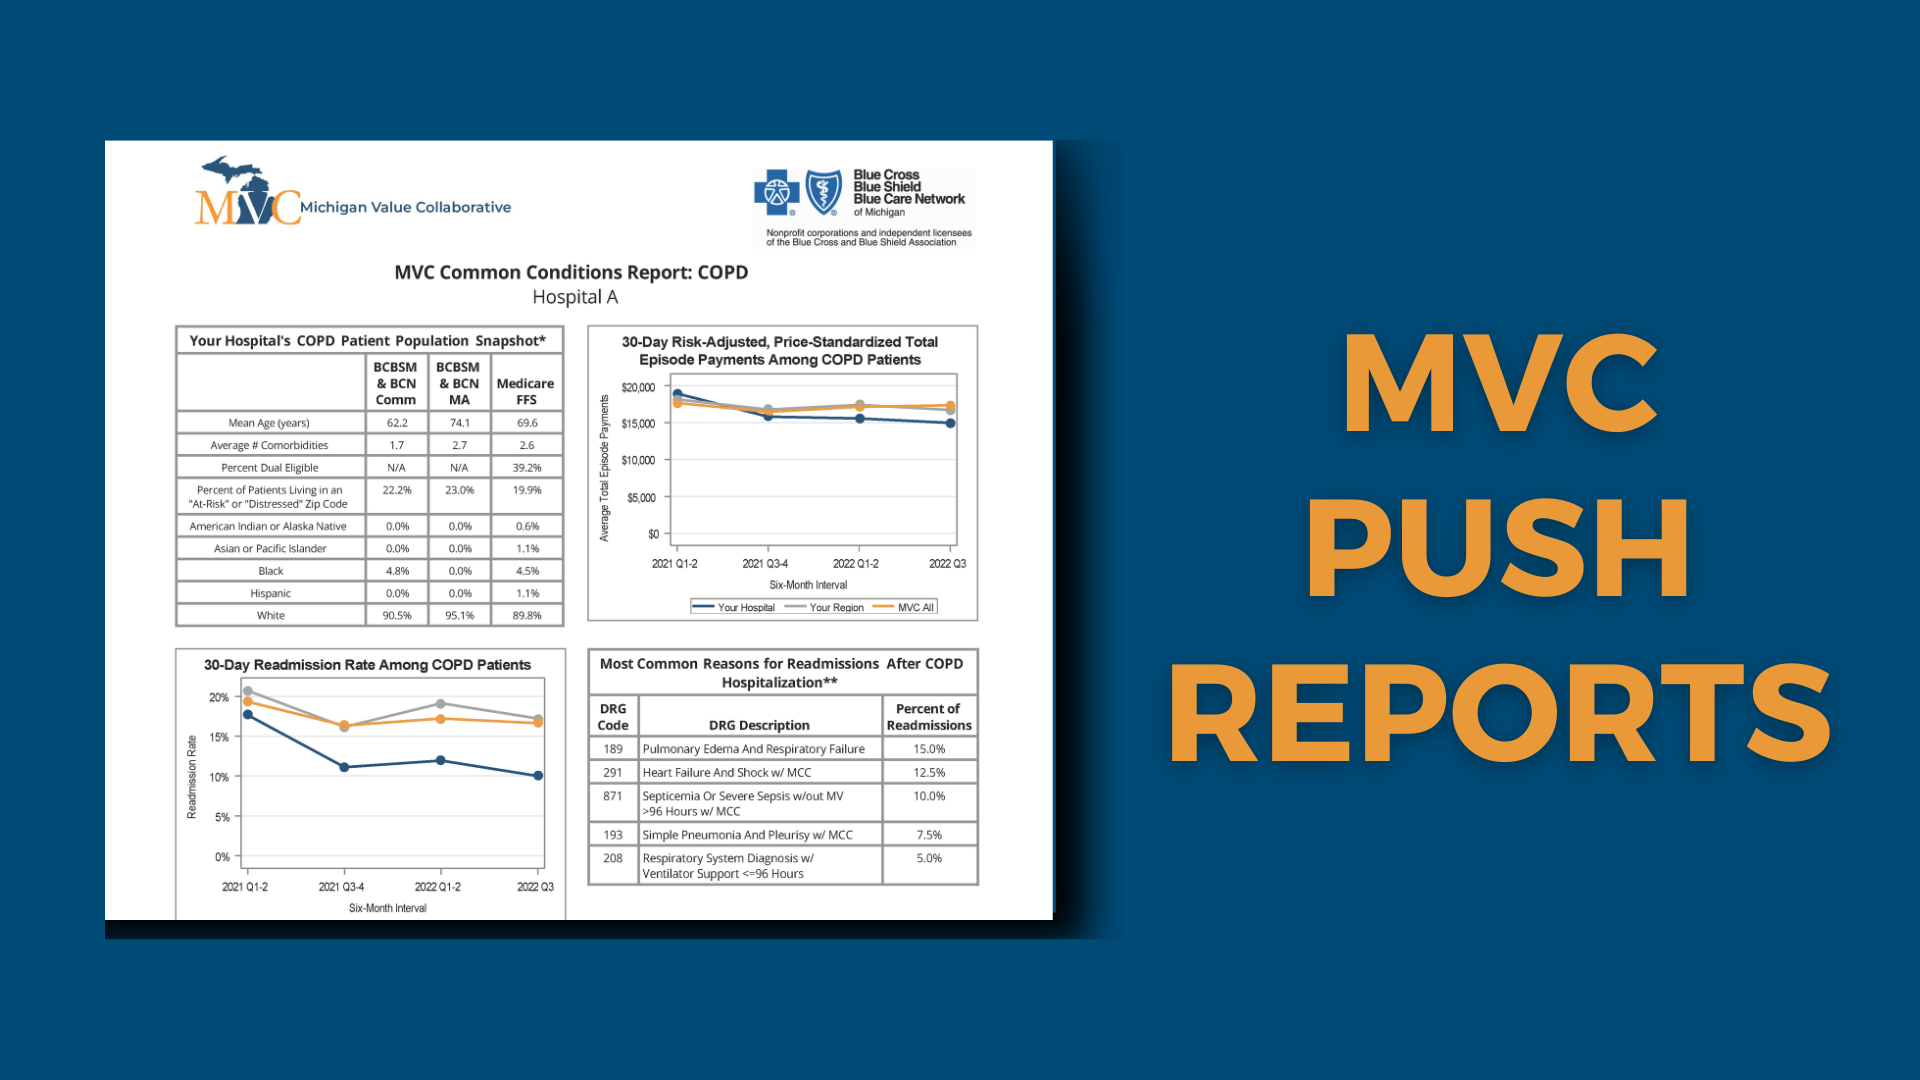
MVC members receive individualized reports pushed directly to secure password-protected folders. These reports focus on common areas for quality improvement to provide greater detail into patient outcomes and cost opportunities.
MVC members receive access to a secure website with over 20 interactive data visualization reports for MVC's 40+ inpatient/surgery-based episodes of care, which can help benchmark care utilization, track trends, and identify cost opportunities.
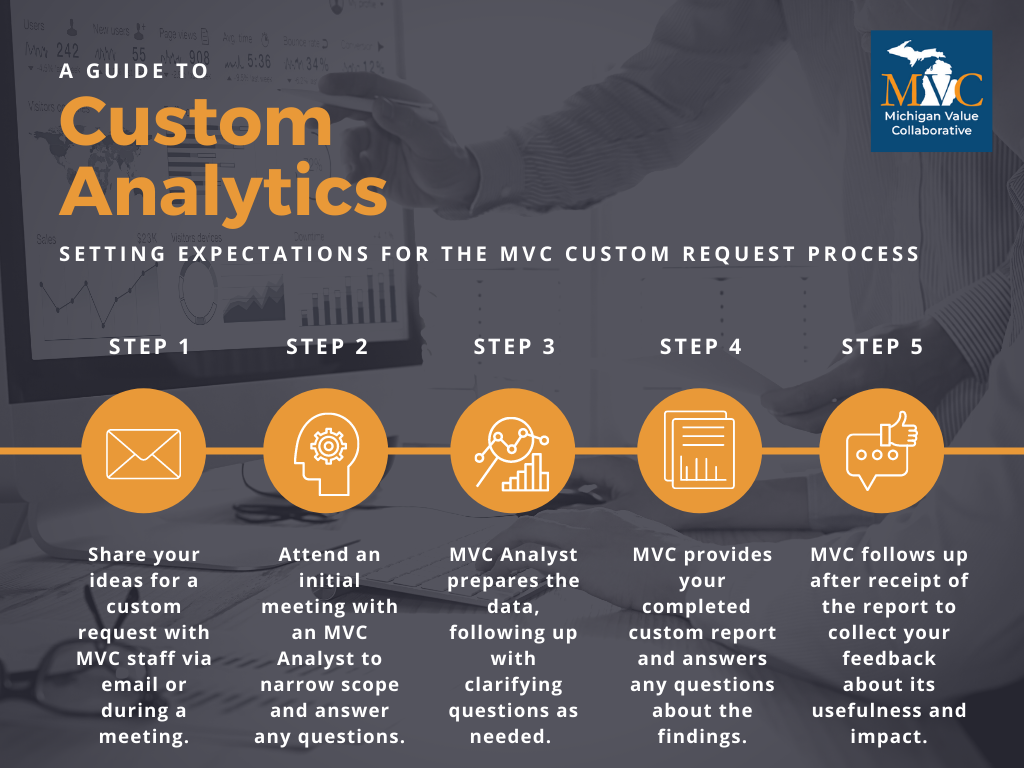
The MVC analytic team will provide custom reports upon request. These allow for greater tailoring and nuanced investigations into drivers of episode spending and healthcare utilization and allow supplementation of claims data with other data sets.
Custom Reports
Now Available for P4P Engagement Points
Hospitals who complete MVC's custom report process will be eligible to earn 0.25 engagement points toward their PY 2025 P4P score. Contact MVC now to leverage our robust claims data to inform your site's quality improvement efforts.

MVC Data Sources & Episodes
MVC uses claims data from a variety of providers (see below) to create 30-day and 90-day episodes of care for 40 different medical and surgical conditions. The claims are price standardized and risk adjusted to allow for the study of practice pattern variation and fair comparisons across hospitals. At present, the MVC registry captures approximately 84% of the insured population of Michigan. For further details on MVC's methods, please see the MVC Data Guide from February 2022.

Medicare Fee for Service (FFS)

Michigan Medicaid

Blue Care Network (BCN)

BCBSM Commercial Preferred Provider Organization (PPO)

BCN Medicare Advantage

BCBSM PPO Medicare Advantage
ED-Based Episodes
Now Available for Custom Analytics
MVC's newest episode structure is initialized by a patient visit to the emergency department (ED) and incorporate all patient care from the index ED visit through 30 days post-ED for a variety of high-volume, ED-relevant conditions. Any MVC partners interested in seeing their organization's data for one or more available ED-based conditions are welcome to request a custom analytic report using this data.
1.7B+
inpatient episodes created
40+
conditions for inpatient-based episodes
1.7M+
ED-based episodes created
15+
conditions for ED-based episodes
NEW FROM THE BLOG...
Learn more about MVC data in action and updates from across the collaborative


